Zip Codes with the Highest Percentage of Households with Income Above $100,000 in Philadelphia, PA
RELATED REPORTS & OPTIONS
Household Income | $100k+
Philadelphia
Compare Zip Codes
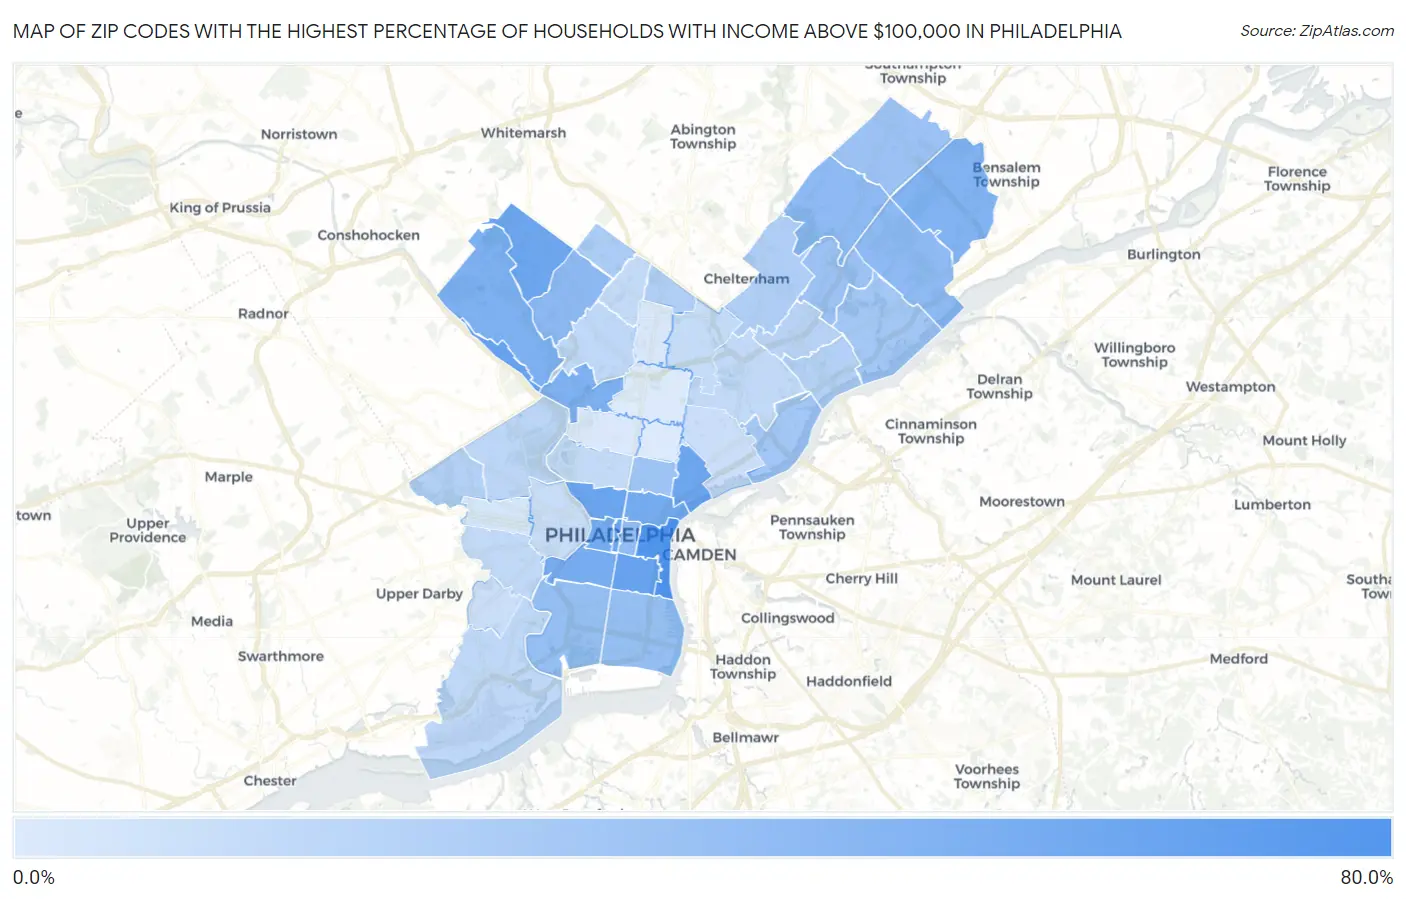
Map of Zip Codes with the Highest Percentage of Households with Income Above $100,000 in Philadelphia
8.9%
67.6%
Zip Codes with the Highest Percentage of Households with Income Above $100,000 in Philadelphia, PA
| Zip Code | Households with Income > $100k | vs State | vs National | |
| 1. | 19108 | 67.6% | 35.9%(+31.7)#64 | 37.3%(+30.3)#1,217 |
| 2. | 19106 | 61.6% | 35.9%(+25.7)#104 | 37.3%(+24.3)#2,064 |
| 3. | 19127 | 52.7% | 35.9%(+16.8)#203 | 37.3%(+15.4)#4,068 |
| 4. | 19147 | 52.3% | 35.9%(+16.4)#207 | 37.3%(+15.0)#4,158 |
| 5. | 19130 | 51.0% | 35.9%(+15.1)#223 | 37.3%(+13.7)#4,535 |
| 6. | 19102 | 51.0% | 35.9%(+15.1)#225 | 37.3%(+13.7)#4,548 |
| 7. | 19118 | 50.2% | 35.9%(+14.3)#237 | 37.3%(+12.9)#4,778 |
| 8. | 19125 | 50.0% | 35.9%(+14.1)#238 | 37.3%(+12.7)#4,822 |
| 9. | 19103 | 47.0% | 35.9%(+11.1)#281 | 37.3%(+9.70)#5,822 |
| 10. | 19123 | 46.7% | 35.9%(+10.8)#287 | 37.3%(+9.40)#5,940 |
| 11. | 19146 | 45.7% | 35.9%(+9.80)#305 | 37.3%(+8.40)#6,322 |
| 12. | 19128 | 42.9% | 35.9%(+7.00)#369 | 37.3%(+5.60)#7,474 |
| 13. | 19129 | 42.6% | 35.9%(+6.70)#375 | 37.3%(+5.30)#7,623 |
| 14. | 19154 | 41.8% | 35.9%(+5.90)#390 | 37.3%(+4.50)#7,988 |
| 15. | 19119 | 37.5% | 35.9%(+1.60)#512 | 37.3%(+0.200)#10,255 |
| 16. | 19114 | 36.7% | 35.9%(+0.800)#544 | 37.3%(-0.600)#10,744 |
| 17. | 19115 | 36.0% | 35.9%(+0.100)#569 | 37.3%(-1.30)#11,123 |
| 18. | 19107 | 34.7% | 35.9%(-1.20)#626 | 37.3%(-2.60)#11,948 |
| 19. | 19148 | 34.1% | 35.9%(-1.80)#650 | 37.3%(-3.20)#12,320 |
| 20. | 19145 | 33.4% | 35.9%(-2.50)#680 | 37.3%(-3.90)#12,812 |
| 21. | 19116 | 31.4% | 35.9%(-4.50)#787 | 37.3%(-5.90)#14,307 |
| 22. | 19152 | 30.9% | 35.9%(-5.00)#816 | 37.3%(-6.40)#14,711 |
| 23. | 19122 | 30.4% | 35.9%(-5.50)#843 | 37.3%(-6.90)#15,112 |
| 24. | 19136 | 28.9% | 35.9%(-7.00)#921 | 37.3%(-8.40)#16,312 |
| 25. | 19137 | 28.5% | 35.9%(-7.40)#946 | 37.3%(-8.80)#16,695 |
| 26. | 19150 | 25.1% | 35.9%(-10.8)#1,131 | 37.3%(-12.2)#19,664 |
| 27. | 19111 | 24.6% | 35.9%(-11.3)#1,154 | 37.3%(-12.7)#20,083 |
| 28. | 19126 | 23.6% | 35.9%(-12.3)#1,206 | 37.3%(-13.7)#21,020 |
| 29. | 19135 | 23.1% | 35.9%(-12.8)#1,228 | 37.3%(-14.2)#21,472 |
| 30. | 19151 | 22.9% | 35.9%(-13.0)#1,243 | 37.3%(-14.4)#21,645 |
| 31. | 19149 | 21.1% | 35.9%(-14.8)#1,332 | 37.3%(-16.2)#23,150 |
| 32. | 19131 | 19.1% | 35.9%(-16.8)#1,419 | 37.3%(-18.2)#24,742 |
| 33. | 19153 | 19.0% | 35.9%(-16.9)#1,429 | 37.3%(-18.3)#24,826 |
| 34. | 19144 | 18.9% | 35.9%(-17.0)#1,433 | 37.3%(-18.4)#24,894 |
| 35. | 19124 | 18.3% | 35.9%(-17.6)#1,456 | 37.3%(-19.0)#25,325 |
| 36. | 19143 | 18.1% | 35.9%(-17.8)#1,461 | 37.3%(-19.2)#25,458 |
| 37. | 19121 | 16.9% | 35.9%(-19.0)#1,500 | 37.3%(-20.4)#26,286 |
| 38. | 19138 | 16.9% | 35.9%(-19.0)#1,501 | 37.3%(-20.4)#26,289 |
| 39. | 19120 | 16.4% | 35.9%(-19.5)#1,513 | 37.3%(-20.9)#26,617 |
| 40. | 19104 | 15.6% | 35.9%(-20.3)#1,533 | 37.3%(-21.7)#27,166 |
| 41. | 19134 | 15.1% | 35.9%(-20.8)#1,555 | 37.3%(-22.2)#27,464 |
| 42. | 19142 | 14.5% | 35.9%(-21.4)#1,572 | 37.3%(-22.8)#27,824 |
| 43. | 19139 | 11.0% | 35.9%(-24.9)#1,648 | 37.3%(-26.3)#29,444 |
| 44. | 19141 | 10.5% | 35.9%(-25.4)#1,660 | 37.3%(-26.8)#29,633 |
| 45. | 19132 | 9.9% | 35.9%(-26.0)#1,669 | 37.3%(-27.4)#29,858 |
| 46. | 19140 | 9.1% | 35.9%(-26.8)#1,683 | 37.3%(-28.2)#30,110 |
| 47. | 19133 | 8.9% | 35.9%(-27.0)#1,693 | 37.3%(-28.4)#30,176 |
1
Common Questions
What are the Top 10 Zip Codes with the Highest Percentage of Households with Income Above $100,000 in Philadelphia, PA?
Top 10 Zip Codes with the Highest Percentage of Households with Income Above $100,000 in Philadelphia, PA are:
What zip code has the Highest Percentage of Households with Income Above $100,000 in Philadelphia, PA?
19108 has the Highest Percentage of Households with Income Above $100,000 in Philadelphia, PA with 67.6%.
What is the Percentage of Households with Income Above $100,000 in Philadelphia, PA?
Percentage of Households with Income Above $100,000 in Philadelphia is 27.6%.
What is the Percentage of Households with Income Above $100,000 in Pennsylvania?
Percentage of Households with Income Above $100,000 in Pennsylvania is 35.9%.
What is the Percentage of Households with Income Above $100,000 in the United States?
Percentage of Households with Income Above $100,000 in the United States is 37.3%.