Zip Codes with the Highest Percentage of Population Employed in Professional & Scientific Services in Philadelphia, PA
RELATED REPORTS & OPTIONS
Professional & Scientific Services
Philadelphia
Compare Zip Codes
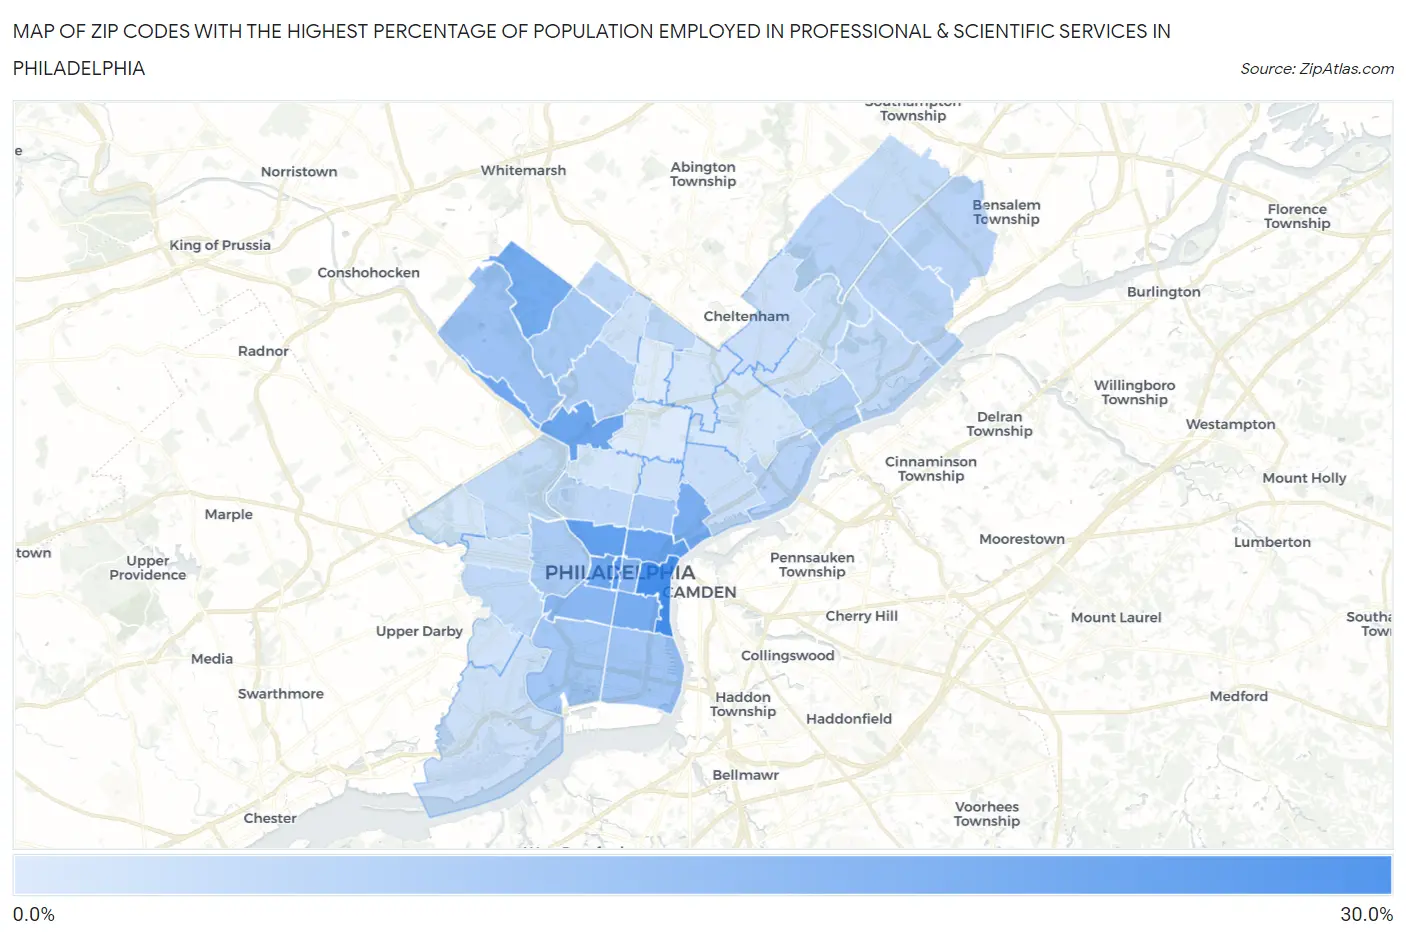
Map of Zip Codes with the Highest Percentage of Population Employed in Professional & Scientific Services in Philadelphia
1.2%
25.3%
Zip Codes with the Highest Percentage of Population Employed in Professional & Scientific Services in Philadelphia, PA
| Zip Code | % Employed | vs State | vs National | |
| 1. | 19106 | 25.3% | 7.1%(+18.2)#20 | 7.8%(+17.5)#406 |
| 2. | 19102 | 22.0% | 7.1%(+14.9)#28 | 7.8%(+14.2)#664 |
| 3. | 19130 | 20.5% | 7.1%(+13.4)#32 | 7.8%(+12.6)#826 |
| 4. | 19123 | 19.3% | 7.1%(+12.2)#38 | 7.8%(+11.4)#972 |
| 5. | 19129 | 18.5% | 7.1%(+11.4)#39 | 7.8%(+10.7)#1,074 |
| 6. | 19103 | 18.4% | 7.1%(+11.3)#42 | 7.8%(+10.6)#1,088 |
| 7. | 19127 | 18.2% | 7.1%(+11.1)#44 | 7.8%(+10.4)#1,121 |
| 8. | 19108 | 17.4% | 7.1%(+10.3)#51 | 7.8%(+9.54)#1,275 |
| 9. | 19118 | 17.3% | 7.1%(+10.2)#53 | 7.8%(+9.45)#1,296 |
| 10. | 19147 | 17.1% | 7.1%(+9.92)#56 | 7.8%(+9.21)#1,345 |
| 11. | 19125 | 16.6% | 7.1%(+9.51)#63 | 7.8%(+8.79)#1,452 |
| 12. | 19107 | 14.4% | 7.1%(+7.28)#97 | 7.8%(+6.56)#2,123 |
| 13. | 19146 | 14.0% | 7.1%(+6.91)#106 | 7.8%(+6.19)#2,257 |
| 14. | 19128 | 11.2% | 7.1%(+4.09)#175 | 7.8%(+3.37)#3,692 |
| 15. | 19148 | 10.3% | 7.1%(+3.19)#211 | 7.8%(+2.48)#4,338 |
| 16. | 19145 | 9.9% | 7.1%(+2.81)#232 | 7.8%(+2.09)#4,628 |
| 17. | 19122 | 9.4% | 7.1%(+2.28)#247 | 7.8%(+1.57)#5,077 |
| 18. | 19119 | 9.0% | 7.1%(+1.91)#264 | 7.8%(+1.19)#5,472 |
| 19. | 19104 | 8.7% | 7.1%(+1.61)#280 | 7.8%(+0.898)#5,764 |
| 20. | 19144 | 8.1% | 7.1%(+0.960)#320 | 7.8%(+0.245)#6,542 |
| 21. | 19135 | 7.8% | 7.1%(+0.700)#340 | 7.8%(-0.014)#6,887 |
| 22. | 19114 | 6.8% | 7.1%(-0.331)#426 | 7.8%(-1.05)#8,482 |
| 23. | 19137 | 6.8% | 7.1%(-0.344)#427 | 7.8%(-1.06)#8,500 |
| 24. | 19115 | 6.7% | 7.1%(-0.391)#436 | 7.8%(-1.11)#8,591 |
| 25. | 19154 | 6.5% | 7.1%(-0.627)#463 | 7.8%(-1.34)#9,039 |
| 26. | 19126 | 6.1% | 7.1%(-1.05)#507 | 7.8%(-1.77)#9,814 |
| 27. | 19150 | 6.1% | 7.1%(-1.07)#514 | 7.8%(-1.79)#9,869 |
| 28. | 19143 | 5.7% | 7.1%(-1.46)#561 | 7.8%(-2.17)#10,635 |
| 29. | 19121 | 5.7% | 7.1%(-1.48)#565 | 7.8%(-2.19)#10,690 |
| 30. | 19136 | 5.4% | 7.1%(-1.76)#601 | 7.8%(-2.47)#11,389 |
| 31. | 19131 | 5.1% | 7.1%(-2.07)#649 | 7.8%(-2.79)#12,184 |
| 32. | 19116 | 4.9% | 7.1%(-2.21)#669 | 7.8%(-2.93)#12,522 |
| 33. | 19152 | 4.8% | 7.1%(-2.37)#692 | 7.8%(-3.08)#12,926 |
| 34. | 19134 | 4.3% | 7.1%(-2.84)#759 | 7.8%(-3.55)#14,245 |
| 35. | 19111 | 3.8% | 7.1%(-3.36)#859 | 7.8%(-4.08)#15,832 |
| 36. | 19153 | 3.7% | 7.1%(-3.46)#873 | 7.8%(-4.17)#16,124 |
| 37. | 19139 | 3.3% | 7.1%(-3.87)#951 | 7.8%(-4.58)#17,505 |
| 38. | 19133 | 3.2% | 7.1%(-3.89)#957 | 7.8%(-4.60)#17,579 |
| 39. | 19138 | 3.1% | 7.1%(-4.07)#999 | 7.8%(-4.79)#18,251 |
| 40. | 19142 | 3.0% | 7.1%(-4.16)#1,011 | 7.8%(-4.87)#18,517 |
| 41. | 19149 | 2.9% | 7.1%(-4.23)#1,032 | 7.8%(-4.95)#18,805 |
| 42. | 19132 | 2.6% | 7.1%(-4.52)#1,102 | 7.8%(-5.24)#19,804 |
| 43. | 19151 | 2.5% | 7.1%(-4.62)#1,125 | 7.8%(-5.34)#20,137 |
| 44. | 19120 | 2.5% | 7.1%(-4.64)#1,127 | 7.8%(-5.35)#20,192 |
| 45. | 19124 | 2.3% | 7.1%(-4.81)#1,171 | 7.8%(-5.52)#20,801 |
| 46. | 19141 | 1.2% | 7.1%(-5.91)#1,365 | 7.8%(-6.62)#24,420 |
| 47. | 19140 | 1.2% | 7.1%(-5.95)#1,369 | 7.8%(-6.66)#24,513 |
1
Common Questions
What are the Top 10 Zip Codes with the Highest Percentage of Population Employed in Professional & Scientific Services in Philadelphia, PA?
Top 10 Zip Codes with the Highest Percentage of Population Employed in Professional & Scientific Services in Philadelphia, PA are:
What zip code has the Highest Percentage of Population Employed in Professional & Scientific Services in Philadelphia, PA?
19106 has the Highest Percentage of Population Employed in Professional & Scientific Services in Philadelphia, PA with 25.3%.
What is the Percentage of Population Employed in Professional & Scientific Services in Philadelphia, PA?
Percentage of Population Employed in Professional & Scientific Services in Philadelphia is 8.1%.
What is the Percentage of Population Employed in Professional & Scientific Services in Pennsylvania?
Percentage of Population Employed in Professional & Scientific Services in Pennsylvania is 7.1%.
What is the Percentage of Population Employed in Professional & Scientific Services in the United States?
Percentage of Population Employed in Professional & Scientific Services in the United States is 7.8%.