Zip Codes with the Highest Percentage of Population Employed in Office & Administration in Philadelphia, PA
RELATED REPORTS & OPTIONS
Office & Administration
Philadelphia
Compare Zip Codes
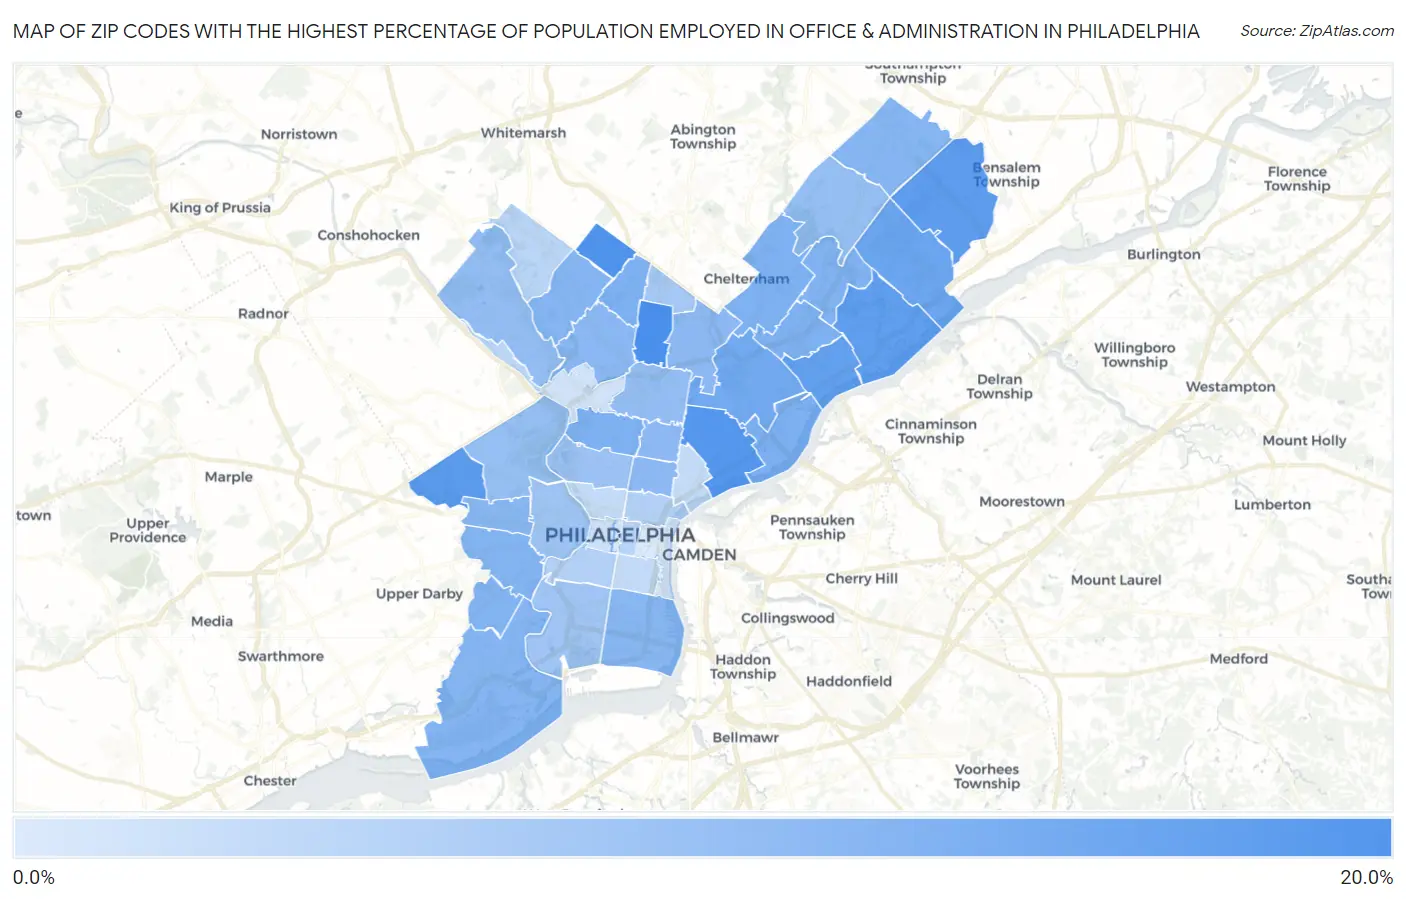
Map of Zip Codes with the Highest Percentage of Population Employed in Office & Administration in Philadelphia
4.4%
17.4%
Zip Codes with the Highest Percentage of Population Employed in Office & Administration in Philadelphia, PA
| Zip Code | % Employed | vs State | vs National | |
| 1. | 19108 | 17.4% | 10.9%(+6.50)#179 | 10.9%(+6.53)#2,651 |
| 2. | 19141 | 17.2% | 10.9%(+6.32)#185 | 10.9%(+6.35)#2,743 |
| 3. | 19150 | 16.7% | 10.9%(+5.85)#202 | 10.9%(+5.88)#2,998 |
| 4. | 19134 | 16.2% | 10.9%(+5.27)#231 | 10.9%(+5.30)#3,440 |
| 5. | 19151 | 15.6% | 10.9%(+4.70)#254 | 10.9%(+4.73)#3,929 |
| 6. | 19154 | 15.2% | 10.9%(+4.35)#274 | 10.9%(+4.38)#4,282 |
| 7. | 19136 | 15.1% | 10.9%(+4.26)#279 | 10.9%(+4.29)#4,389 |
| 8. | 19135 | 14.9% | 10.9%(+3.98)#307 | 10.9%(+4.02)#4,736 |
| 9. | 19114 | 14.0% | 10.9%(+3.16)#376 | 10.9%(+3.19)#5,936 |
| 10. | 19124 | 13.4% | 10.9%(+2.47)#435 | 10.9%(+2.51)#7,236 |
| 11. | 19137 | 12.5% | 10.9%(+1.66)#537 | 10.9%(+1.69)#9,163 |
| 12. | 19132 | 12.4% | 10.9%(+1.49)#567 | 10.9%(+1.52)#9,633 |
| 13. | 19149 | 12.4% | 10.9%(+1.48)#568 | 10.9%(+1.51)#9,665 |
| 14. | 19111 | 12.4% | 10.9%(+1.47)#574 | 10.9%(+1.50)#9,699 |
| 15. | 19138 | 12.3% | 10.9%(+1.45)#576 | 10.9%(+1.48)#9,748 |
| 16. | 19152 | 12.2% | 10.9%(+1.30)#605 | 10.9%(+1.33)#10,186 |
| 17. | 19142 | 12.0% | 10.9%(+1.09)#637 | 10.9%(+1.12)#10,802 |
| 18. | 19143 | 11.9% | 10.9%(+1.02)#655 | 10.9%(+1.05)#11,032 |
| 19. | 19119 | 11.9% | 10.9%(+0.982)#661 | 10.9%(+1.01)#11,137 |
| 20. | 19116 | 11.8% | 10.9%(+0.903)#673 | 10.9%(+0.934)#11,368 |
| 21. | 19153 | 11.7% | 10.9%(+0.816)#695 | 10.9%(+0.847)#11,610 |
| 22. | 19148 | 11.7% | 10.9%(+0.779)#702 | 10.9%(+0.810)#11,729 |
| 23. | 19139 | 11.5% | 10.9%(+0.614)#725 | 10.9%(+0.645)#12,235 |
| 24. | 19144 | 11.4% | 10.9%(+0.541)#733 | 10.9%(+0.572)#12,446 |
| 25. | 19122 | 11.3% | 10.9%(+0.387)#768 | 10.9%(+0.419)#12,961 |
| 26. | 19120 | 11.2% | 10.9%(+0.277)#788 | 10.9%(+0.309)#13,316 |
| 27. | 19133 | 11.1% | 10.9%(+0.212)#798 | 10.9%(+0.244)#13,534 |
| 28. | 19140 | 10.6% | 10.9%(-0.250)#885 | 10.9%(-0.218)#15,008 |
| 29. | 19128 | 10.6% | 10.9%(-0.277)#891 | 10.9%(-0.245)#15,093 |
| 30. | 19115 | 10.5% | 10.9%(-0.421)#927 | 10.9%(-0.390)#15,606 |
| 31. | 19131 | 10.5% | 10.9%(-0.429)#930 | 10.9%(-0.397)#15,637 |
| 32. | 19121 | 10.1% | 10.9%(-0.798)#993 | 10.9%(-0.766)#16,832 |
| 33. | 19104 | 9.6% | 10.9%(-1.32)#1,080 | 10.9%(-1.29)#18,516 |
| 34. | 19145 | 9.3% | 10.9%(-1.56)#1,119 | 10.9%(-1.53)#19,310 |
| 35. | 19126 | 9.0% | 10.9%(-1.91)#1,172 | 10.9%(-1.88)#20,325 |
| 36. | 19146 | 7.9% | 10.9%(-3.02)#1,327 | 10.9%(-2.99)#23,341 |
| 37. | 19123 | 7.7% | 10.9%(-3.15)#1,345 | 10.9%(-3.12)#23,608 |
| 38. | 19107 | 7.3% | 10.9%(-3.59)#1,394 | 10.9%(-3.56)#24,610 |
| 39. | 19118 | 7.2% | 10.9%(-3.67)#1,403 | 10.9%(-3.64)#24,783 |
| 40. | 19127 | 7.1% | 10.9%(-3.77)#1,413 | 10.9%(-3.74)#24,997 |
| 41. | 19147 | 6.5% | 10.9%(-4.35)#1,466 | 10.9%(-4.31)#26,027 |
| 42. | 19125 | 6.5% | 10.9%(-4.35)#1,467 | 10.9%(-4.32)#26,035 |
| 43. | 19130 | 6.4% | 10.9%(-4.44)#1,473 | 10.9%(-4.41)#26,187 |
| 44. | 19103 | 5.6% | 10.9%(-5.32)#1,522 | 10.9%(-5.28)#27,435 |
| 45. | 19129 | 5.3% | 10.9%(-5.54)#1,536 | 10.9%(-5.51)#27,721 |
| 46. | 19102 | 5.0% | 10.9%(-5.88)#1,552 | 10.9%(-5.85)#28,100 |
| 47. | 19106 | 4.4% | 10.9%(-6.51)#1,581 | 10.9%(-6.48)#28,685 |
1
Common Questions
What are the Top 10 Zip Codes with the Highest Percentage of Population Employed in Office & Administration in Philadelphia, PA?
Top 10 Zip Codes with the Highest Percentage of Population Employed in Office & Administration in Philadelphia, PA are:
What zip code has the Highest Percentage of Population Employed in Office & Administration in Philadelphia, PA?
19108 has the Highest Percentage of Population Employed in Office & Administration in Philadelphia, PA with 17.4%.
What is the Percentage of Population Employed in Office & Administration in Philadelphia, PA?
Percentage of Population Employed in Office & Administration in Philadelphia is 11.1%.
What is the Percentage of Population Employed in Office & Administration in Pennsylvania?
Percentage of Population Employed in Office & Administration in Pennsylvania is 10.9%.
What is the Percentage of Population Employed in Office & Administration in the United States?
Percentage of Population Employed in Office & Administration in the United States is 10.9%.