Zip Codes with the Highest Percentage of Households with Income Above $200,000 in Philadelphia, PA
RELATED REPORTS & OPTIONS
Household Income | $200k+
Philadelphia
Compare Zip Codes
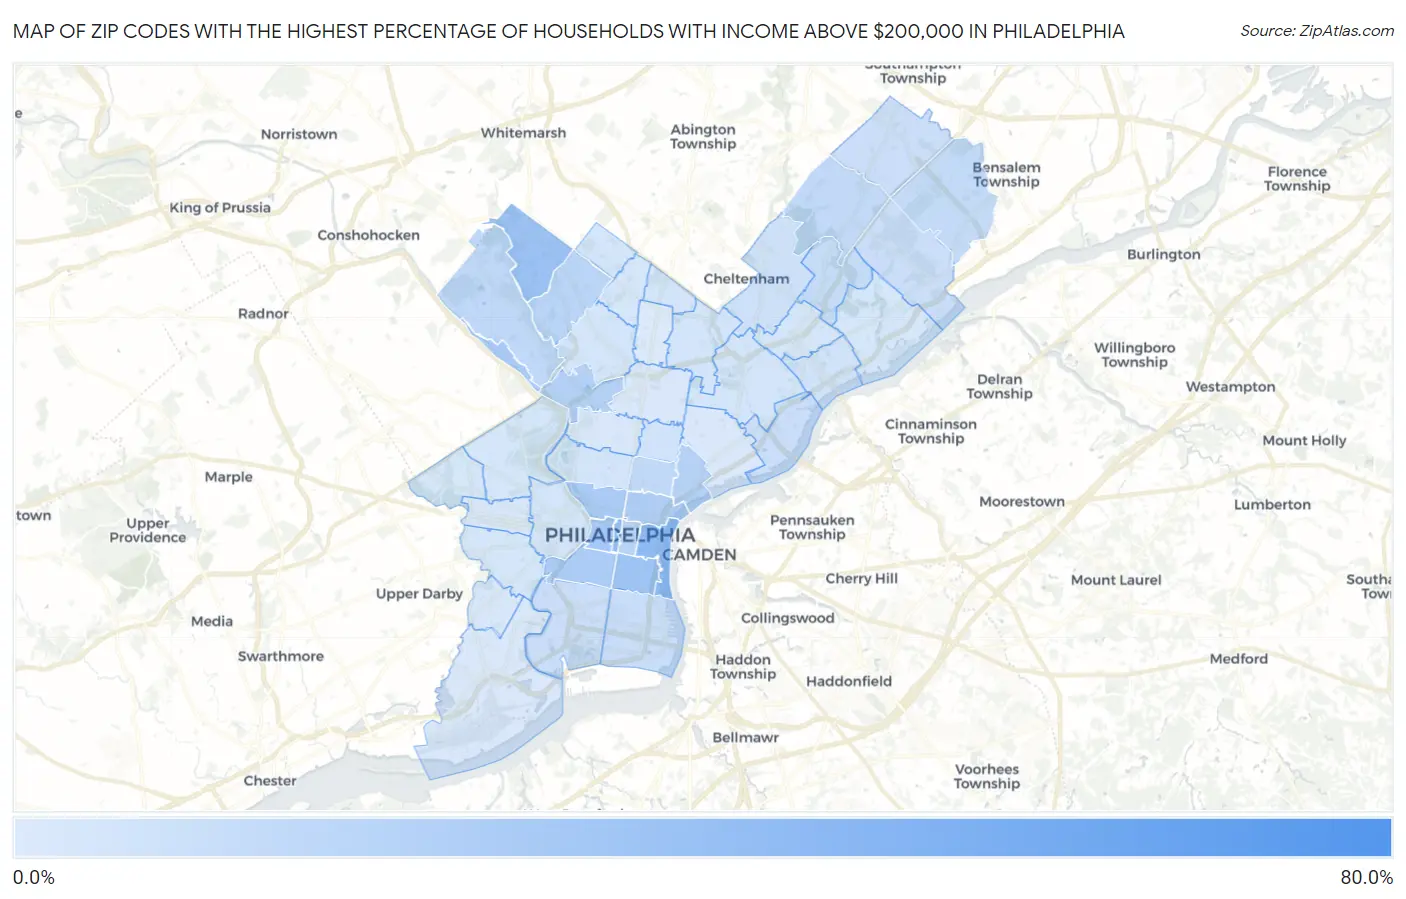
Map of Zip Codes with the Highest Percentage of Households with Income Above $200,000 in Philadelphia
0.60%
67.6%
Zip Codes with the Highest Percentage of Households with Income Above $200,000 in Philadelphia, PA
| Zip Code | Households with Income > $200k | vs State | vs National | |
| 1. | 19108 | 67.6% | 10.2%(+57.4)#10 | 11.4%(+56.2)#66 |
| 2. | 19106 | 30.1% | 10.2%(+19.9)#68 | 11.4%(+18.7)#1,445 |
| 3. | 19102 | 28.0% | 10.2%(+17.8)#79 | 11.4%(+16.6)#1,730 |
| 4. | 19118 | 25.6% | 10.2%(+15.4)#92 | 11.4%(+14.2)#2,088 |
| 5. | 19147 | 24.6% | 10.2%(+14.4)#99 | 11.4%(+13.2)#2,257 |
| 6. | 19103 | 21.5% | 10.2%(+11.3)#122 | 11.4%(+10.1)#2,884 |
| 7. | 19127 | 19.9% | 10.2%(+9.70)#141 | 11.4%(+8.50)#3,330 |
| 8. | 19130 | 19.6% | 10.2%(+9.40)#144 | 11.4%(+8.20)#3,397 |
| 9. | 19146 | 18.5% | 10.2%(+8.30)#160 | 11.4%(+7.10)#3,695 |
| 10. | 19123 | 18.1% | 10.2%(+7.90)#164 | 11.4%(+6.70)#3,820 |
| 11. | 19129 | 15.9% | 10.2%(+5.70)#197 | 11.4%(+4.50)#4,617 |
| 12. | 19125 | 14.9% | 10.2%(+4.70)#211 | 11.4%(+3.50)#5,030 |
| 13. | 19107 | 14.0% | 10.2%(+3.80)#228 | 11.4%(+2.60)#5,471 |
| 14. | 19119 | 13.3% | 10.2%(+3.10)#243 | 11.4%(+1.90)#5,845 |
| 15. | 19128 | 11.4% | 10.2%(+1.20)#304 | 11.4%(=0.000)#7,075 |
| 16. | 19122 | 10.5% | 10.2%(+0.300)#352 | 11.4%(-0.900)#7,787 |
| 17. | 19115 | 10.3% | 10.2%(+0.100)#362 | 11.4%(-1.10)#7,951 |
| 18. | 19154 | 9.9% | 10.2%(-0.300)#374 | 11.4%(-1.50)#8,347 |
| 19. | 19152 | 8.4% | 10.2%(-1.80)#465 | 11.4%(-3.00)#9,862 |
| 20. | 19148 | 7.6% | 10.2%(-2.60)#519 | 11.4%(-3.80)#10,892 |
| 21. | 19114 | 7.4% | 10.2%(-2.80)#534 | 11.4%(-4.00)#11,193 |
| 22. | 19145 | 7.2% | 10.2%(-3.00)#553 | 11.4%(-4.20)#11,474 |
| 23. | 19116 | 7.1% | 10.2%(-3.10)#561 | 11.4%(-4.30)#11,630 |
| 24. | 19137 | 7.0% | 10.2%(-3.20)#568 | 11.4%(-4.40)#11,797 |
| 25. | 19111 | 5.2% | 10.2%(-5.00)#737 | 11.4%(-6.20)#15,060 |
| 26. | 19135 | 4.6% | 10.2%(-5.60)#810 | 11.4%(-6.80)#16,519 |
| 27. | 19133 | 4.4% | 10.2%(-5.80)#837 | 11.4%(-7.00)#17,027 |
| 28. | 19150 | 4.2% | 10.2%(-6.00)#865 | 11.4%(-7.20)#17,577 |
| 29. | 19121 | 4.0% | 10.2%(-6.20)#896 | 11.4%(-7.40)#18,079 |
| 30. | 19126 | 4.0% | 10.2%(-6.20)#899 | 11.4%(-7.40)#18,128 |
| 31. | 19124 | 3.9% | 10.2%(-6.30)#915 | 11.4%(-7.50)#18,322 |
| 32. | 19104 | 3.9% | 10.2%(-6.30)#916 | 11.4%(-7.50)#18,323 |
| 33. | 19120 | 3.7% | 10.2%(-6.50)#951 | 11.4%(-7.70)#18,849 |
| 34. | 19144 | 3.7% | 10.2%(-6.50)#952 | 11.4%(-7.70)#18,861 |
| 35. | 19136 | 3.4% | 10.2%(-6.80)#993 | 11.4%(-8.00)#19,687 |
| 36. | 19143 | 3.3% | 10.2%(-6.90)#1,014 | 11.4%(-8.10)#19,990 |
| 37. | 19149 | 3.0% | 10.2%(-7.20)#1,060 | 11.4%(-8.40)#20,864 |
| 38. | 19131 | 3.0% | 10.2%(-7.20)#1,061 | 11.4%(-8.40)#20,872 |
| 39. | 19151 | 3.0% | 10.2%(-7.20)#1,062 | 11.4%(-8.40)#20,879 |
| 40. | 19138 | 2.9% | 10.2%(-7.30)#1,081 | 11.4%(-8.50)#21,154 |
| 41. | 19139 | 2.5% | 10.2%(-7.70)#1,148 | 11.4%(-8.90)#22,312 |
| 42. | 19132 | 2.4% | 10.2%(-7.80)#1,166 | 11.4%(-9.00)#22,624 |
| 43. | 19142 | 2.0% | 10.2%(-8.20)#1,241 | 11.4%(-9.40)#23,745 |
| 44. | 19153 | 1.5% | 10.2%(-8.70)#1,310 | 11.4%(-9.90)#25,074 |
| 45. | 19134 | 1.3% | 10.2%(-8.90)#1,340 | 11.4%(-10.1)#25,515 |
| 46. | 19140 | 1.1% | 10.2%(-9.10)#1,368 | 11.4%(-10.3)#25,945 |
| 47. | 19141 | 0.60% | 10.2%(-9.60)#1,421 | 11.4%(-10.8)#26,926 |
1
Common Questions
What are the Top 10 Zip Codes with the Highest Percentage of Households with Income Above $200,000 in Philadelphia, PA?
Top 10 Zip Codes with the Highest Percentage of Households with Income Above $200,000 in Philadelphia, PA are:
What zip code has the Highest Percentage of Households with Income Above $200,000 in Philadelphia, PA?
19108 has the Highest Percentage of Households with Income Above $200,000 in Philadelphia, PA with 67.6%.
What is the Percentage of Households with Income Above $200,000 in Philadelphia, PA?
Percentage of Households with Income Above $200,000 in Philadelphia is 7.8%.
What is the Percentage of Households with Income Above $200,000 in Pennsylvania?
Percentage of Households with Income Above $200,000 in Pennsylvania is 10.2%.
What is the Percentage of Households with Income Above $200,000 in the United States?
Percentage of Households with Income Above $200,000 in the United States is 11.4%.