Zip Codes with the Highest Percentage of Population Employed in Business & Financial in Philadelphia, PA
RELATED REPORTS & OPTIONS
Business & Financial
Philadelphia
Compare Zip Codes
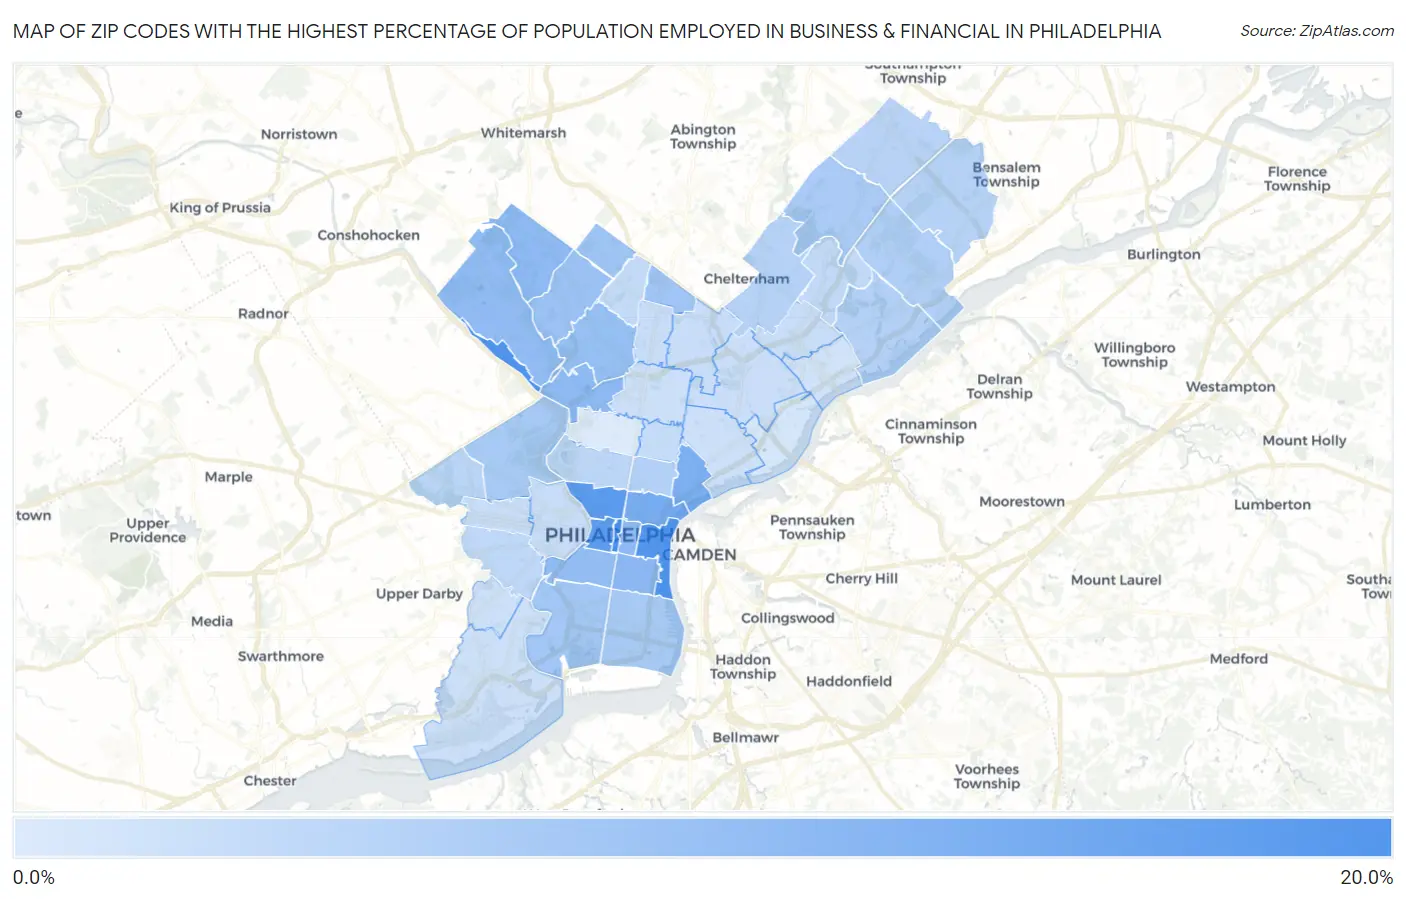
Map of Zip Codes with the Highest Percentage of Population Employed in Business & Financial in Philadelphia
1.1%
17.6%
Zip Codes with the Highest Percentage of Population Employed in Business & Financial in Philadelphia, PA
| Zip Code | % Employed | vs State | vs National | |
| 1. | 19102 | 17.6% | 5.9%(+11.7)#24 | 5.8%(+11.8)#383 |
| 2. | 19127 | 16.8% | 5.9%(+10.9)#27 | 5.8%(+11.1)#430 |
| 3. | 19106 | 16.2% | 5.9%(+10.3)#29 | 5.8%(+10.5)#482 |
| 4. | 19130 | 15.1% | 5.9%(+9.25)#35 | 5.8%(+9.38)#595 |
| 5. | 19103 | 14.9% | 5.9%(+9.06)#38 | 5.8%(+9.19)#613 |
| 6. | 19123 | 11.9% | 5.9%(+6.00)#70 | 5.8%(+6.13)#1,246 |
| 7. | 19125 | 11.5% | 5.9%(+5.60)#79 | 5.8%(+5.73)#1,414 |
| 8. | 19147 | 9.6% | 5.9%(+3.69)#153 | 5.8%(+3.82)#2,551 |
| 9. | 19107 | 9.5% | 5.9%(+3.61)#157 | 5.8%(+3.74)#2,616 |
| 10. | 19118 | 9.5% | 5.9%(+3.59)#159 | 5.8%(+3.72)#2,643 |
| 11. | 19129 | 9.3% | 5.9%(+3.44)#166 | 5.8%(+3.57)#2,774 |
| 12. | 19128 | 9.2% | 5.9%(+3.34)#173 | 5.8%(+3.47)#2,853 |
| 13. | 19146 | 8.9% | 5.9%(+3.02)#189 | 5.8%(+3.15)#3,170 |
| 14. | 19144 | 8.8% | 5.9%(+2.89)#198 | 5.8%(+3.02)#3,315 |
| 15. | 19119 | 7.9% | 5.9%(+1.98)#245 | 5.8%(+2.11)#4,426 |
| 16. | 19150 | 7.6% | 5.9%(+1.67)#264 | 5.8%(+1.80)#4,880 |
| 17. | 19126 | 7.3% | 5.9%(+1.46)#289 | 5.8%(+1.59)#5,223 |
| 18. | 19145 | 7.3% | 5.9%(+1.36)#297 | 5.8%(+1.49)#5,397 |
| 19. | 19148 | 6.7% | 5.9%(+0.764)#354 | 5.8%(+0.896)#6,449 |
| 20. | 19131 | 6.6% | 5.9%(+0.702)#361 | 5.8%(+0.833)#6,578 |
| 21. | 19115 | 6.3% | 5.9%(+0.414)#389 | 5.8%(+0.545)#7,136 |
| 22. | 19114 | 5.7% | 5.9%(-0.176)#466 | 5.8%(-0.045)#8,501 |
| 23. | 19136 | 5.5% | 5.9%(-0.376)#499 | 5.8%(-0.245)#8,997 |
| 24. | 19122 | 5.5% | 5.9%(-0.428)#503 | 5.8%(-0.297)#9,128 |
| 25. | 19111 | 5.2% | 5.9%(-0.701)#548 | 5.8%(-0.570)#9,898 |
| 26. | 19154 | 5.2% | 5.9%(-0.724)#550 | 5.8%(-0.593)#9,971 |
| 27. | 19116 | 5.0% | 5.9%(-0.882)#581 | 5.8%(-0.751)#10,426 |
| 28. | 19151 | 4.7% | 5.9%(-1.20)#644 | 5.8%(-1.07)#11,451 |
| 29. | 19121 | 4.6% | 5.9%(-1.31)#657 | 5.8%(-1.18)#11,822 |
| 30. | 19143 | 4.2% | 5.9%(-1.72)#738 | 5.8%(-1.59)#13,216 |
| 31. | 19152 | 4.0% | 5.9%(-1.85)#762 | 5.8%(-1.71)#13,676 |
| 32. | 19138 | 3.8% | 5.9%(-2.12)#818 | 5.8%(-1.99)#14,690 |
| 33. | 19133 | 3.5% | 5.9%(-2.39)#891 | 5.8%(-2.26)#15,818 |
| 34. | 19149 | 3.4% | 5.9%(-2.53)#922 | 5.8%(-2.40)#16,395 |
| 35. | 19120 | 3.3% | 5.9%(-2.62)#938 | 5.8%(-2.49)#16,761 |
| 36. | 19104 | 3.3% | 5.9%(-2.64)#946 | 5.8%(-2.51)#16,837 |
| 37. | 19139 | 3.2% | 5.9%(-2.71)#954 | 5.8%(-2.58)#17,108 |
| 38. | 19141 | 3.2% | 5.9%(-2.73)#957 | 5.8%(-2.60)#17,179 |
| 39. | 19124 | 3.1% | 5.9%(-2.79)#968 | 5.8%(-2.66)#17,400 |
| 40. | 19142 | 2.8% | 5.9%(-3.07)#1,033 | 5.8%(-2.94)#18,546 |
| 41. | 19153 | 2.8% | 5.9%(-3.09)#1,038 | 5.8%(-2.96)#18,623 |
| 42. | 19134 | 2.8% | 5.9%(-3.11)#1,043 | 5.8%(-2.98)#18,719 |
| 43. | 19140 | 2.8% | 5.9%(-3.12)#1,045 | 5.8%(-2.99)#18,773 |
| 44. | 19135 | 2.2% | 5.9%(-3.67)#1,169 | 5.8%(-3.54)#20,919 |
| 45. | 19137 | 1.8% | 5.9%(-4.06)#1,250 | 5.8%(-3.93)#22,416 |
| 46. | 19132 | 1.1% | 5.9%(-4.77)#1,364 | 5.8%(-4.64)#24,703 |
1
Common Questions
What are the Top 10 Zip Codes with the Highest Percentage of Population Employed in Business & Financial in Philadelphia, PA?
Top 10 Zip Codes with the Highest Percentage of Population Employed in Business & Financial in Philadelphia, PA are:
What zip code has the Highest Percentage of Population Employed in Business & Financial in Philadelphia, PA?
19102 has the Highest Percentage of Population Employed in Business & Financial in Philadelphia, PA with 17.6%.
What is the Percentage of Population Employed in Business & Financial in Philadelphia, PA?
Percentage of Population Employed in Business & Financial in Philadelphia is 6.3%.
What is the Percentage of Population Employed in Business & Financial in Pennsylvania?
Percentage of Population Employed in Business & Financial in Pennsylvania is 5.9%.
What is the Percentage of Population Employed in Business & Financial in the United States?
Percentage of Population Employed in Business & Financial in the United States is 5.8%.