Zip Codes with the Highest Percentage of Population with a Degree in Bio, Nature & Agricultural in Philadelphia, PA
RELATED REPORTS & OPTIONS
Bio, Nature & Agricultural
Philadelphia
Compare Zip Codes
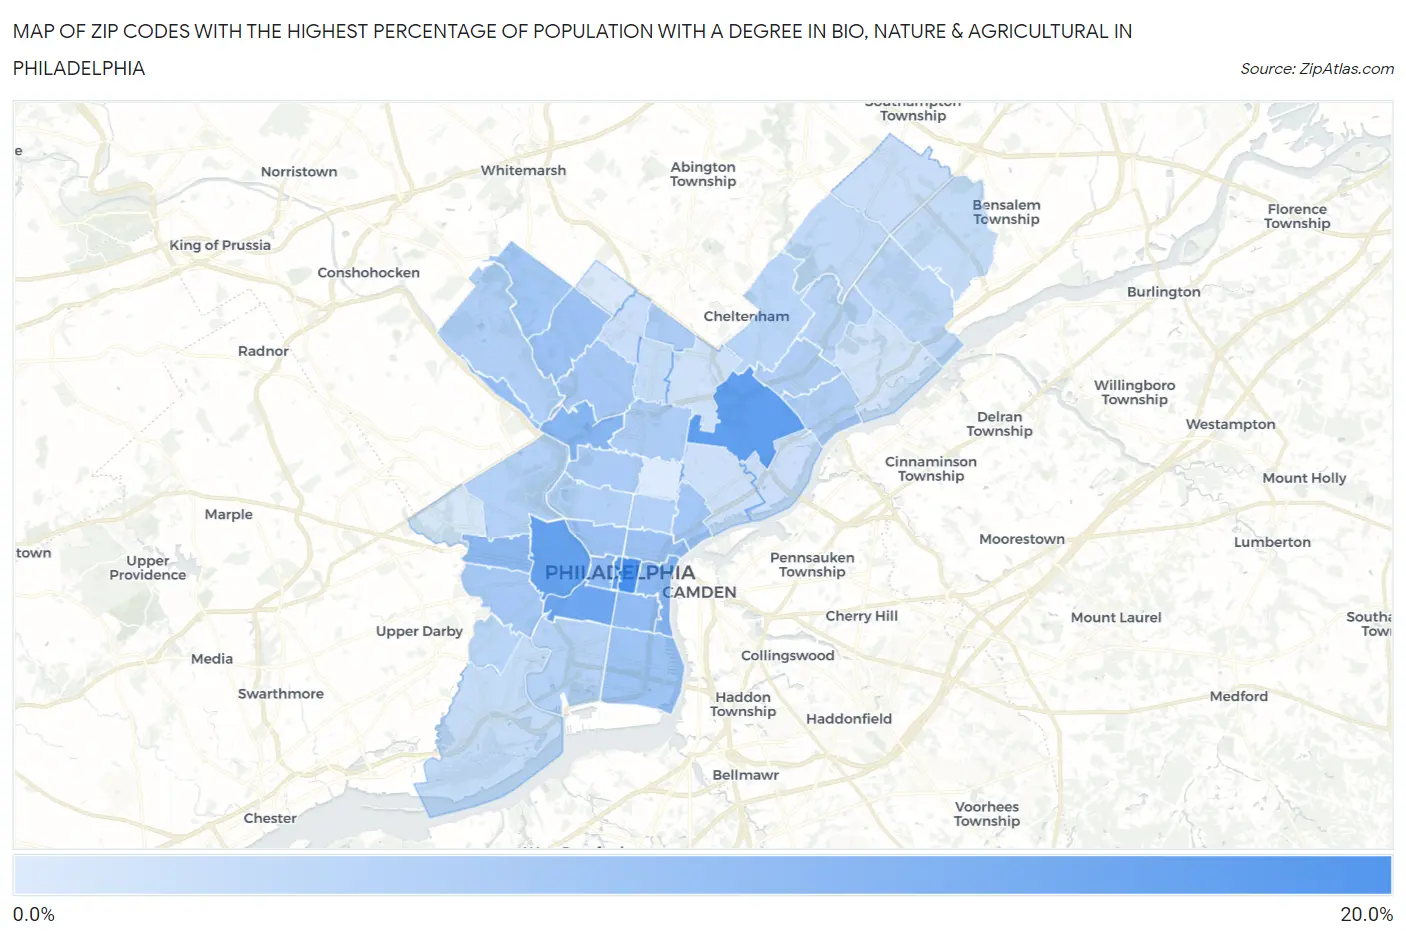
Map of Zip Codes with the Highest Percentage of Population with a Degree in Bio, Nature & Agricultural in Philadelphia
0.65%
17.8%
Zip Codes with the Highest Percentage of Population with a Degree in Bio, Nature & Agricultural in Philadelphia, PA
| Zip Code | % Graduates | vs State | vs National | |
| 1. | 19107 | 17.8% | 6.5%(+11.3)#98 | 6.4%(+11.5)#3,138 |
| 2. | 19102 | 15.1% | 6.5%(+8.64)#129 | 6.4%(+8.77)#4,187 |
| 3. | 19124 | 14.6% | 6.5%(+8.14)#140 | 6.4%(+8.27)#4,446 |
| 4. | 19104 | 14.1% | 6.5%(+7.66)#155 | 6.4%(+7.79)#4,698 |
| 5. | 19146 | 13.0% | 6.5%(+6.52)#179 | 6.4%(+6.65)#5,385 |
| 6. | 19129 | 10.1% | 6.5%(+3.63)#288 | 6.4%(+3.76)#7,996 |
| 7. | 19139 | 9.6% | 6.5%(+3.08)#328 | 6.4%(+3.21)#8,689 |
| 8. | 19106 | 9.2% | 6.5%(+2.75)#352 | 6.4%(+2.88)#9,162 |
| 9. | 19103 | 9.2% | 6.5%(+2.71)#355 | 6.4%(+2.83)#9,220 |
| 10. | 19147 | 9.0% | 6.5%(+2.47)#382 | 6.4%(+2.60)#9,616 |
| 11. | 19127 | 8.3% | 6.5%(+1.79)#446 | 6.4%(+1.91)#10,719 |
| 12. | 19123 | 8.0% | 6.5%(+1.49)#471 | 6.4%(+1.62)#11,240 |
| 13. | 19119 | 7.9% | 6.5%(+1.38)#481 | 6.4%(+1.51)#11,456 |
| 14. | 19130 | 7.8% | 6.5%(+1.28)#493 | 6.4%(+1.40)#11,649 |
| 15. | 19148 | 7.5% | 6.5%(+0.994)#522 | 6.4%(+1.12)#12,231 |
| 16. | 19125 | 7.0% | 6.5%(+0.551)#577 | 6.4%(+0.678)#13,250 |
| 17. | 19118 | 6.9% | 6.5%(+0.446)#592 | 6.4%(+0.574)#13,512 |
| 18. | 19144 | 6.6% | 6.5%(+0.151)#639 | 6.4%(+0.278)#14,270 |
| 19. | 19143 | 6.6% | 6.5%(+0.082)#650 | 6.4%(+0.209)#14,455 |
| 20. | 19132 | 6.1% | 6.5%(-0.341)#727 | 6.4%(-0.213)#15,542 |
| 21. | 19126 | 6.0% | 6.5%(-0.519)#750 | 6.4%(-0.391)#16,028 |
| 22. | 19140 | 5.9% | 6.5%(-0.598)#760 | 6.4%(-0.471)#16,250 |
| 23. | 19135 | 5.6% | 6.5%(-0.876)#805 | 6.4%(-0.749)#17,005 |
| 24. | 19149 | 5.6% | 6.5%(-0.880)#806 | 6.4%(-0.753)#17,019 |
| 25. | 19128 | 5.4% | 6.5%(-1.06)#831 | 6.4%(-0.935)#17,534 |
| 26. | 19122 | 5.2% | 6.5%(-1.28)#863 | 6.4%(-1.16)#18,217 |
| 27. | 19131 | 5.2% | 6.5%(-1.30)#865 | 6.4%(-1.17)#18,265 |
| 28. | 19121 | 5.2% | 6.5%(-1.31)#866 | 6.4%(-1.19)#18,303 |
| 29. | 19145 | 4.9% | 6.5%(-1.62)#924 | 6.4%(-1.49)#19,214 |
| 30. | 19152 | 4.6% | 6.5%(-1.86)#952 | 6.4%(-1.74)#19,935 |
| 31. | 19111 | 4.3% | 6.5%(-2.13)#990 | 6.4%(-2.01)#20,695 |
| 32. | 19142 | 4.3% | 6.5%(-2.19)#999 | 6.4%(-2.06)#20,889 |
| 33. | 19114 | 4.1% | 6.5%(-2.38)#1,025 | 6.4%(-2.25)#21,400 |
| 34. | 19115 | 3.5% | 6.5%(-2.97)#1,098 | 6.4%(-2.84)#22,788 |
| 35. | 19154 | 3.3% | 6.5%(-3.16)#1,127 | 6.4%(-3.03)#23,211 |
| 36. | 19153 | 3.2% | 6.5%(-3.30)#1,141 | 6.4%(-3.18)#23,519 |
| 37. | 19141 | 3.1% | 6.5%(-3.39)#1,152 | 6.4%(-3.27)#23,715 |
| 38. | 19116 | 2.8% | 6.5%(-3.64)#1,178 | 6.4%(-3.51)#24,168 |
| 39. | 19138 | 2.6% | 6.5%(-3.92)#1,204 | 6.4%(-3.80)#24,620 |
| 40. | 19137 | 2.5% | 6.5%(-3.97)#1,206 | 6.4%(-3.84)#24,697 |
| 41. | 19134 | 2.4% | 6.5%(-4.13)#1,218 | 6.4%(-4.00)#24,918 |
| 42. | 19120 | 2.2% | 6.5%(-4.29)#1,238 | 6.4%(-4.17)#25,134 |
| 43. | 19136 | 1.8% | 6.5%(-4.71)#1,274 | 6.4%(-4.58)#25,595 |
| 44. | 19151 | 1.5% | 6.5%(-4.99)#1,300 | 6.4%(-4.87)#25,855 |
| 45. | 19150 | 0.92% | 6.5%(-5.56)#1,317 | 6.4%(-5.44)#26,262 |
| 46. | 19133 | 0.65% | 6.5%(-5.83)#1,322 | 6.4%(-5.71)#26,377 |
1
Common Questions
What are the Top 10 Zip Codes with the Highest Percentage of Population with a Degree in Bio, Nature & Agricultural in Philadelphia, PA?
Top 10 Zip Codes with the Highest Percentage of Population with a Degree in Bio, Nature & Agricultural in Philadelphia, PA are:
What zip code has the Highest Percentage of Population with a Degree in Bio, Nature & Agricultural in Philadelphia, PA?
19107 has the Highest Percentage of Population with a Degree in Bio, Nature & Agricultural in Philadelphia, PA with 17.8%.
What is the Percentage of Population with a Degree in Bio, Nature & Agricultural in Philadelphia, PA?
Percentage of Population with a Degree in Bio, Nature & Agricultural in Philadelphia is 7.2%.
What is the Percentage of Population with a Degree in Bio, Nature & Agricultural in Pennsylvania?
Percentage of Population with a Degree in Bio, Nature & Agricultural in Pennsylvania is 6.5%.
What is the Percentage of Population with a Degree in Bio, Nature & Agricultural in the United States?
Percentage of Population with a Degree in Bio, Nature & Agricultural in the United States is 6.4%.