Zip Codes with the Highest Percentage of Families with Income Above $100,000 in Albany, OR
RELATED REPORTS & OPTIONS
Family Income | $100k+
Albany
Compare Zip Codes
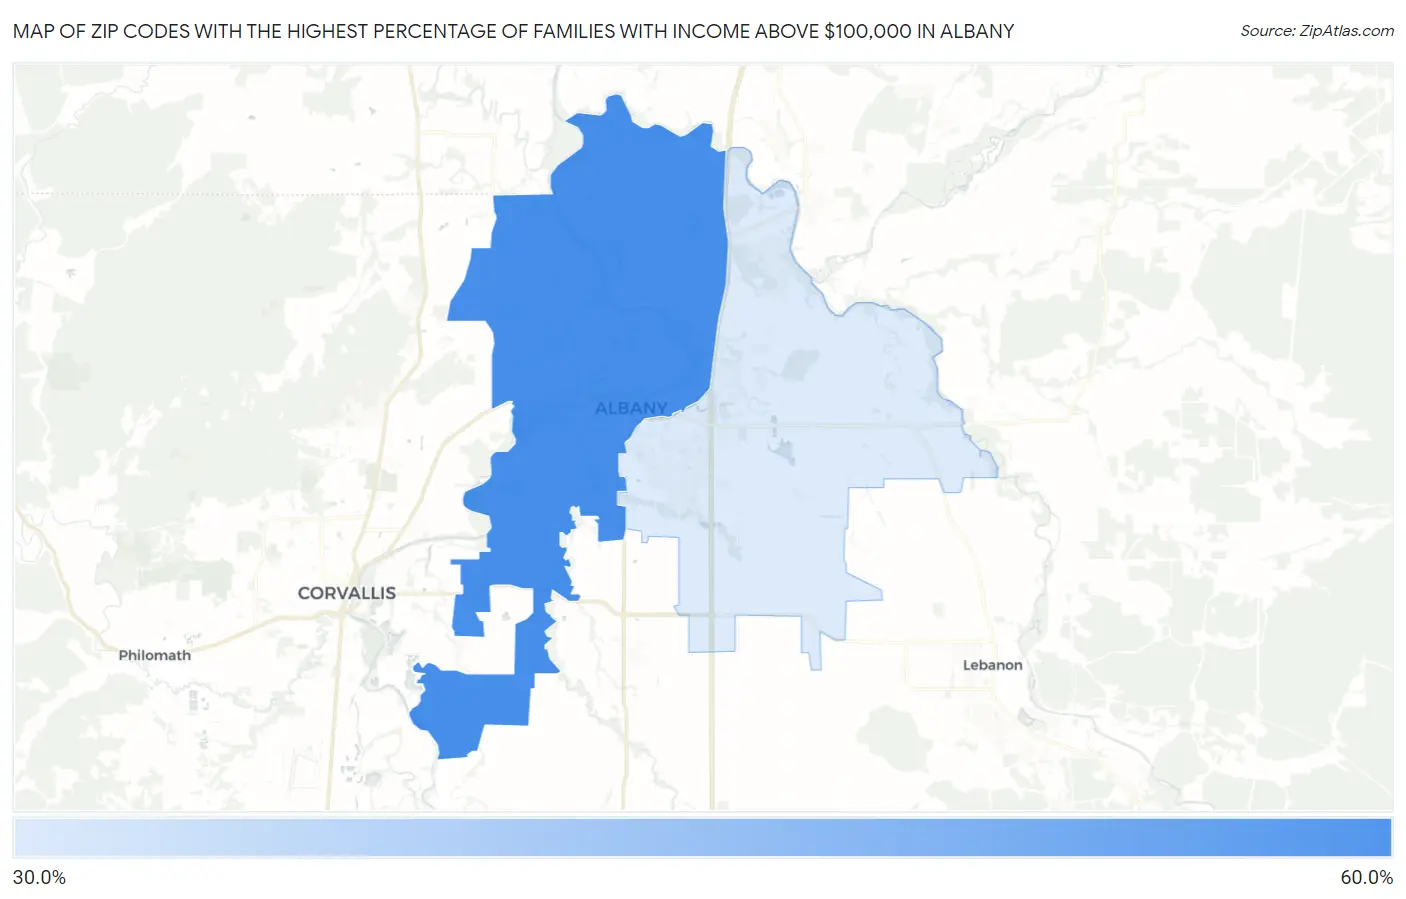
Map of Zip Codes with the Highest Percentage of Families with Income Above $100,000 in Albany
31.6%
56.8%
Zip Codes with the Highest Percentage of Families with Income Above $100,000 in Albany, OR
| Zip Code | Families with Income > $100k | vs State | vs National | |
| 1. | 97321 | 56.8% | 47.1%(+9.70)#75 | 46.1%(+10.7)#6,155 |
| 2. | 97322 | 31.6% | 47.1%(-15.5)#279 | 46.1%(-14.5)#20,266 |
1
Common Questions
What are the Top Zip Codes with the Highest Percentage of Families with Income Above $100,000 in Albany, OR?
Top Zip Codes with the Highest Percentage of Families with Income Above $100,000 in Albany, OR are:
What zip code has the Highest Percentage of Families with Income Above $100,000 in Albany, OR?
97321 has the Highest Percentage of Families with Income Above $100,000 in Albany, OR with 56.8%.
What is the Percentage of Families with Income Above $100,000 in Albany, OR?
Percentage of Families with Income Above $100,000 in Albany is 39.7%.
What is the Percentage of Families with Income Above $100,000 in Oregon?
Percentage of Families with Income Above $100,000 in Oregon is 47.1%.
What is the Percentage of Families with Income Above $100,000 in the United States?
Percentage of Families with Income Above $100,000 in the United States is 46.1%.