Zip Codes with the Highest Percentage of Households Without a Vehicle in Shawnee, OK
RELATED REPORTS & OPTIONS
Households without a Cars
Shawnee
Compare Zip Codes
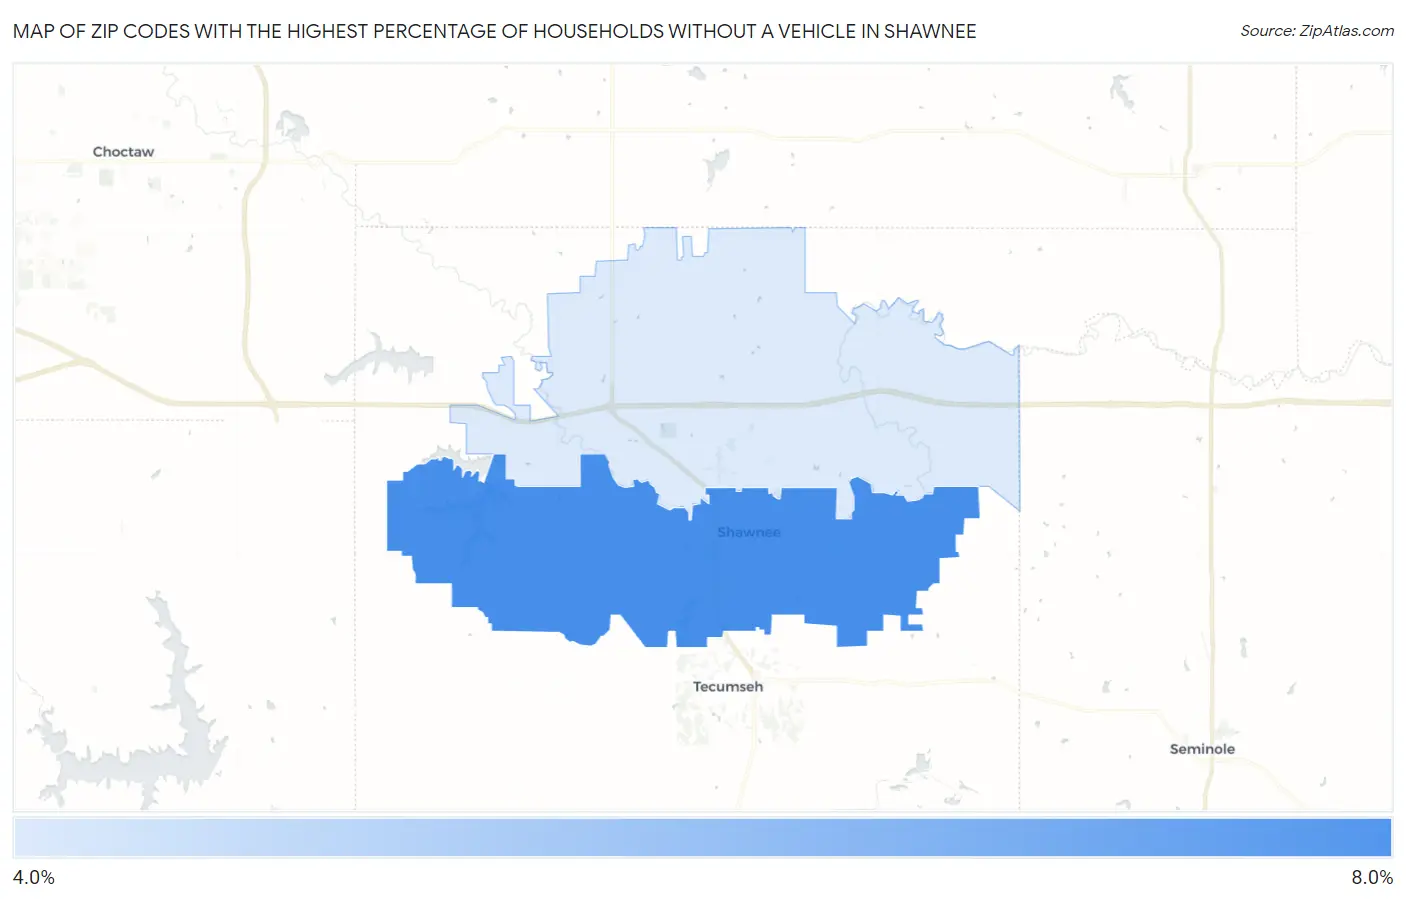
Map of Zip Codes with the Highest Percentage of Households Without a Vehicle in Shawnee
4.1%
7.9%
Zip Codes with the Highest Percentage of Households Without a Vehicle in Shawnee, OK
| Zip Code | Housholds Without a Car | vs State | vs National | |
| 1. | 74801 | 7.9% | 5.4%(+2.50)#92 | 8.3%(-0.400)#7,107 |
| 2. | 74804 | 4.1% | 5.4%(-1.30)#271 | 8.3%(-4.20)#15,413 |
1
Common Questions
What are the Top Zip Codes with the Highest Percentage of Households Without a Vehicle in Shawnee, OK?
Top Zip Codes with the Highest Percentage of Households Without a Vehicle in Shawnee, OK are:
What zip code has the Highest Percentage of Households Without a Vehicle in Shawnee, OK?
74801 has the Highest Percentage of Households Without a Vehicle in Shawnee, OK with 7.9%.
What is the Percentage of Households Without a Vehicle in Shawnee, OK?
Percentage of Households Without a Vehicle in Shawnee is 7.2%.
What is the Percentage of Households Without a Vehicle in Oklahoma?
Percentage of Households Without a Vehicle in Oklahoma is 5.4%.
What is the Percentage of Households Without a Vehicle in the United States?
Percentage of Households Without a Vehicle in the United States is 8.3%.