Zip Codes with the Highest Percentage of Households with Income Below $10,000 in Plattsburgh, NY
RELATED REPORTS & OPTIONS
Household Income | $0-10k
Plattsburgh
Compare Zip Codes
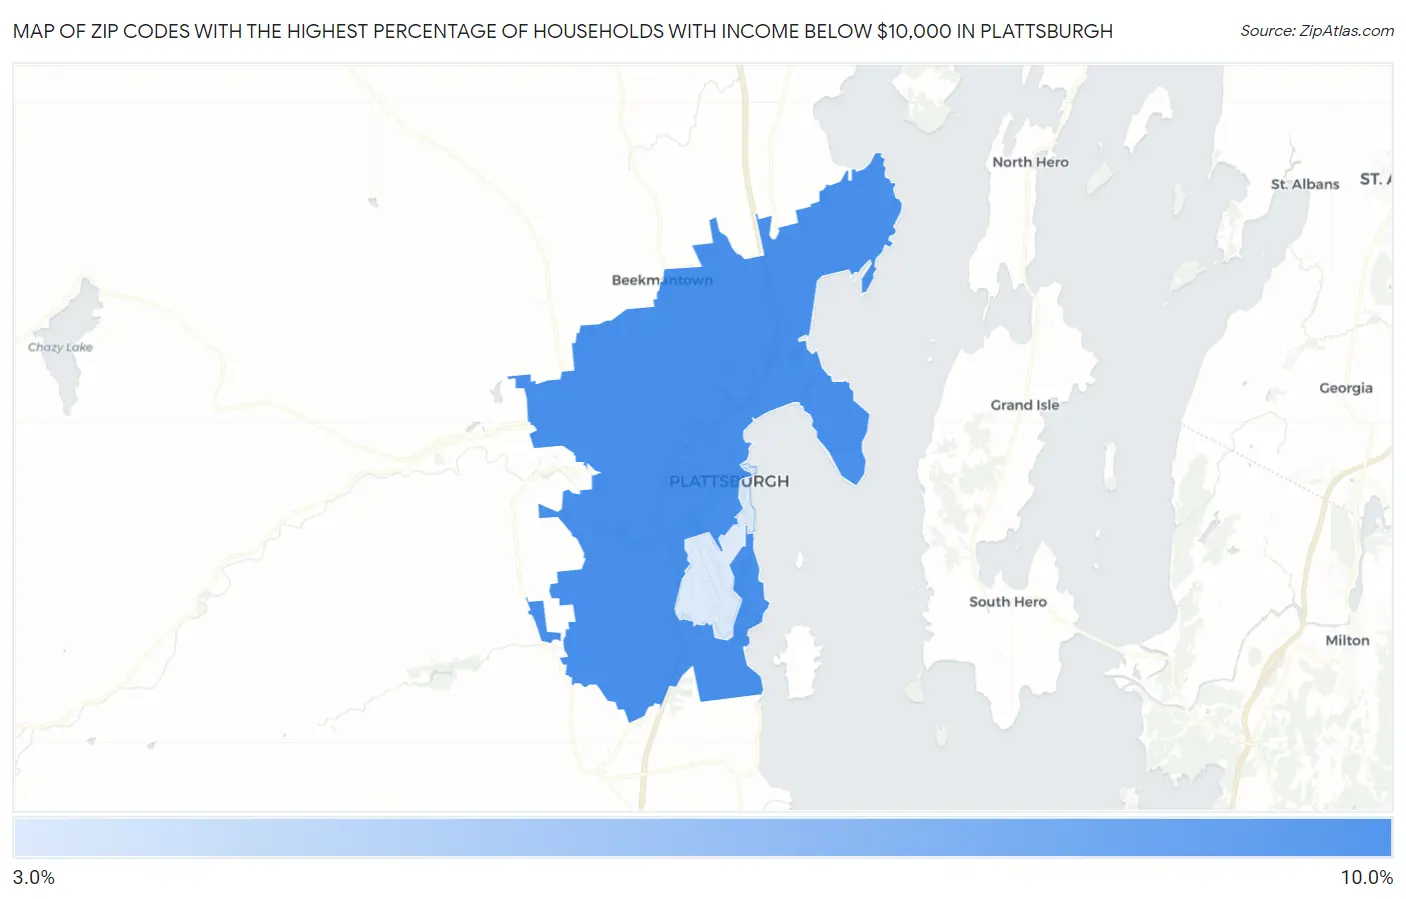
Map of Zip Codes with the Highest Percentage of Households with Income Below $10,000 in Plattsburgh
3.6%
8.9%
Zip Codes with the Highest Percentage of Households with Income Below $10,000 in Plattsburgh, NY
| Zip Code | Households with Income < $10k | vs State | vs National | |
| 1. | 12901 | 8.9% | 5.6%(+3.30)#200 | 4.9%(+4.00)#4,508 |
| 2. | 12903 | 3.6% | 5.6%(-2.00)#832 | 4.9%(-1.30)#17,074 |
1
Common Questions
What are the Top Zip Codes with the Highest Percentage of Households with Income Below $10,000 in Plattsburgh, NY?
Top Zip Codes with the Highest Percentage of Households with Income Below $10,000 in Plattsburgh, NY are:
What zip code has the Highest Percentage of Households with Income Below $10,000 in Plattsburgh, NY?
12901 has the Highest Percentage of Households with Income Below $10,000 in Plattsburgh, NY with 8.9%.
What is the Percentage of Households with Income Below $10,000 in Plattsburgh, NY?
Percentage of Households with Income Below $10,000 in Plattsburgh is 11.6%.
What is the Percentage of Households with Income Below $10,000 in New York?
Percentage of Households with Income Below $10,000 in New York is 5.6%.
What is the Percentage of Households with Income Below $10,000 in the United States?
Percentage of Households with Income Below $10,000 in the United States is 4.9%.