Zip Codes with the Highest Percentage of Population Employed in Arts, Media & Entertainment in Sparks, NV
RELATED REPORTS & OPTIONS
Arts, Media & Entertainment
Sparks
Compare Zip Codes
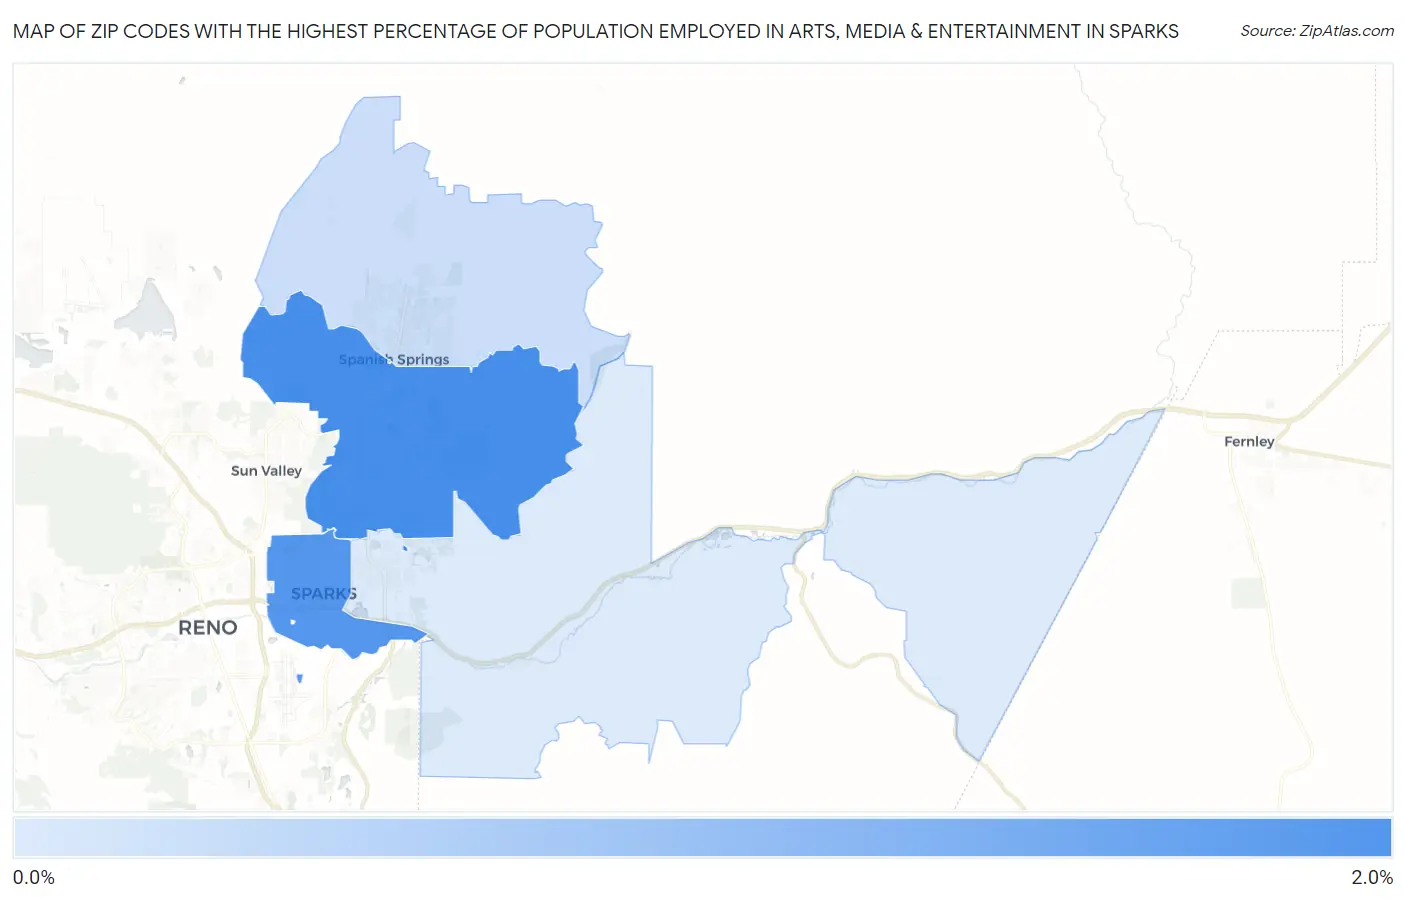
Map of Zip Codes with the Highest Percentage of Population Employed in Arts, Media & Entertainment in Sparks
0.88%
1.7%
Zip Codes with the Highest Percentage of Population Employed in Arts, Media & Entertainment in Sparks, NV
| Zip Code | % Employed | vs State | vs National | |
| 1. | 89436 | 1.7% | 2.1%(-0.368)#74 | 2.1%(-0.368)#9,675 |
| 2. | 89431 | 1.6% | 2.1%(-0.445)#75 | 2.1%(-0.444)#10,221 |
| 3. | 89441 | 0.98% | 2.1%(-1.08)#97 | 2.1%(-1.08)#14,953 |
| 4. | 89434 | 0.88% | 2.1%(-1.18)#99 | 2.1%(-1.18)#15,829 |
1
Common Questions
What are the Top 3 Zip Codes with the Highest Percentage of Population Employed in Arts, Media & Entertainment in Sparks, NV?
Top 3 Zip Codes with the Highest Percentage of Population Employed in Arts, Media & Entertainment in Sparks, NV are:
What zip code has the Highest Percentage of Population Employed in Arts, Media & Entertainment in Sparks, NV?
89436 has the Highest Percentage of Population Employed in Arts, Media & Entertainment in Sparks, NV with 1.7%.
What is the Percentage of Population Employed in Arts, Media & Entertainment in Sparks, NV?
Percentage of Population Employed in Arts, Media & Entertainment in Sparks is 1.5%.
What is the Percentage of Population Employed in Arts, Media & Entertainment in Nevada?
Percentage of Population Employed in Arts, Media & Entertainment in Nevada is 2.1%.
What is the Percentage of Population Employed in Arts, Media & Entertainment in the United States?
Percentage of Population Employed in Arts, Media & Entertainment in the United States is 2.1%.