Zip Codes with the Highest Percentage of Households with Income Below $10,000 in Millstone Township, NJ
RELATED REPORTS & OPTIONS
Household Income | $0-10k
Millstone Township
Compare Zip Codes
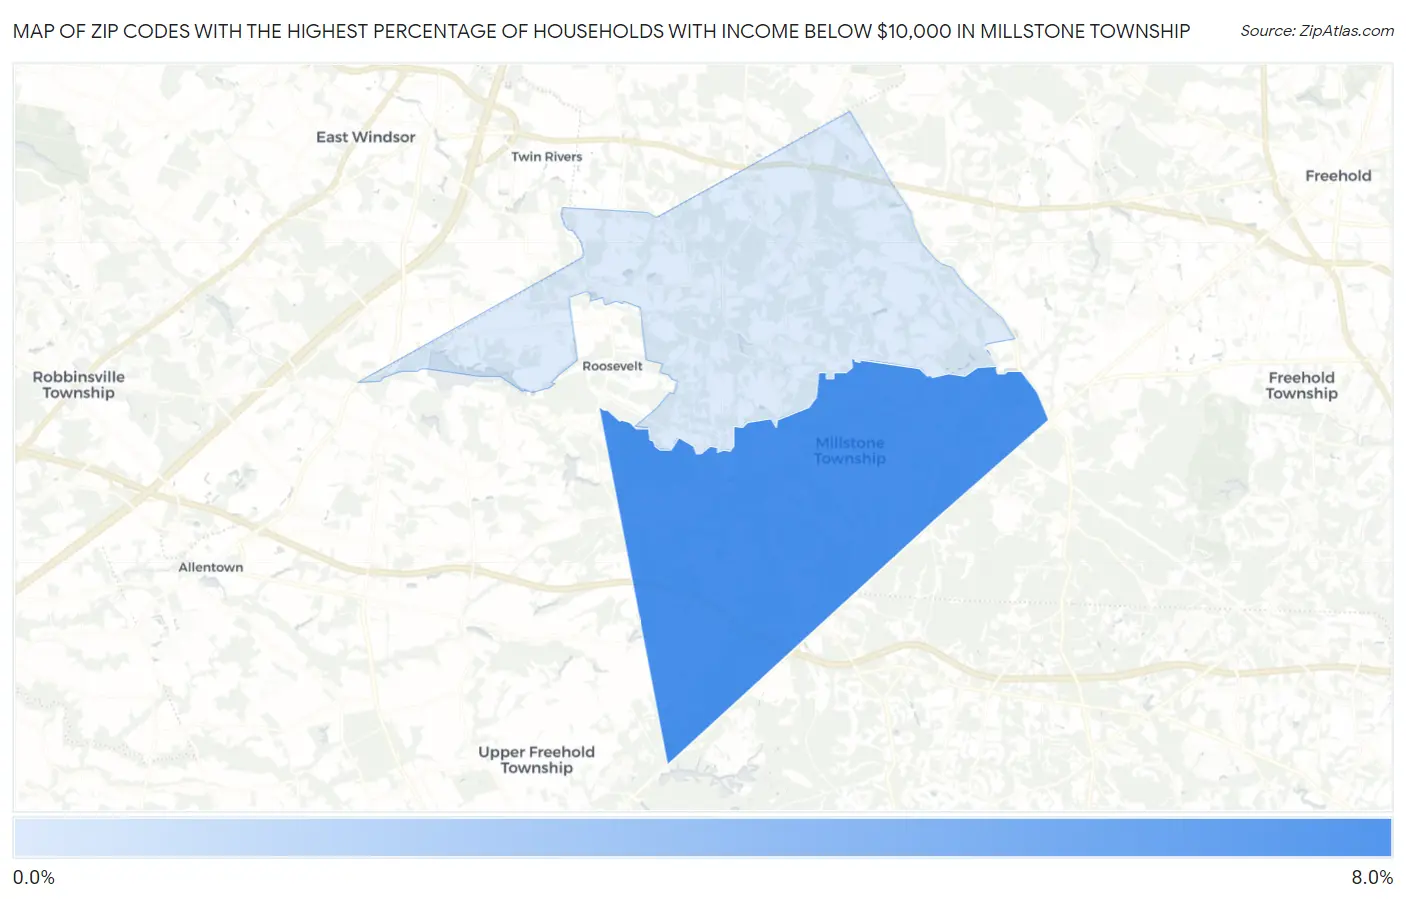
Map of Zip Codes with the Highest Percentage of Households with Income Below $10,000 in Millstone Township
0.60%
6.3%
Zip Codes with the Highest Percentage of Households with Income Below $10,000 in Millstone Township, NJ
| Zip Code | Households with Income < $10k | vs State | vs National | |
| 1. | 08510 | 6.3% | 4.1%(+2.20)#71 | 4.9%(+1.40)#8,401 |
| 2. | 08535 | 0.60% | 4.1%(-3.50)#511 | 4.9%(-4.30)#27,712 |
1
Common Questions
What are the Top Zip Codes with the Highest Percentage of Households with Income Below $10,000 in Millstone Township, NJ?
Top Zip Codes with the Highest Percentage of Households with Income Below $10,000 in Millstone Township, NJ are:
What zip code has the Highest Percentage of Households with Income Below $10,000 in Millstone Township, NJ?
08510 has the Highest Percentage of Households with Income Below $10,000 in Millstone Township, NJ with 6.3%.
What is the Percentage of Households with Income Below $10,000 in New Jersey?
Percentage of Households with Income Below $10,000 in New Jersey is 4.1%.
What is the Percentage of Households with Income Below $10,000 in the United States?
Percentage of Households with Income Below $10,000 in the United States is 4.9%.