Zip Codes with the Highest Percentage of Households Heated by Utility Gas in Millstone Township, NJ
RELATED REPORTS & OPTIONS
Utility Gas Heating
Millstone Township
Compare Zip Codes
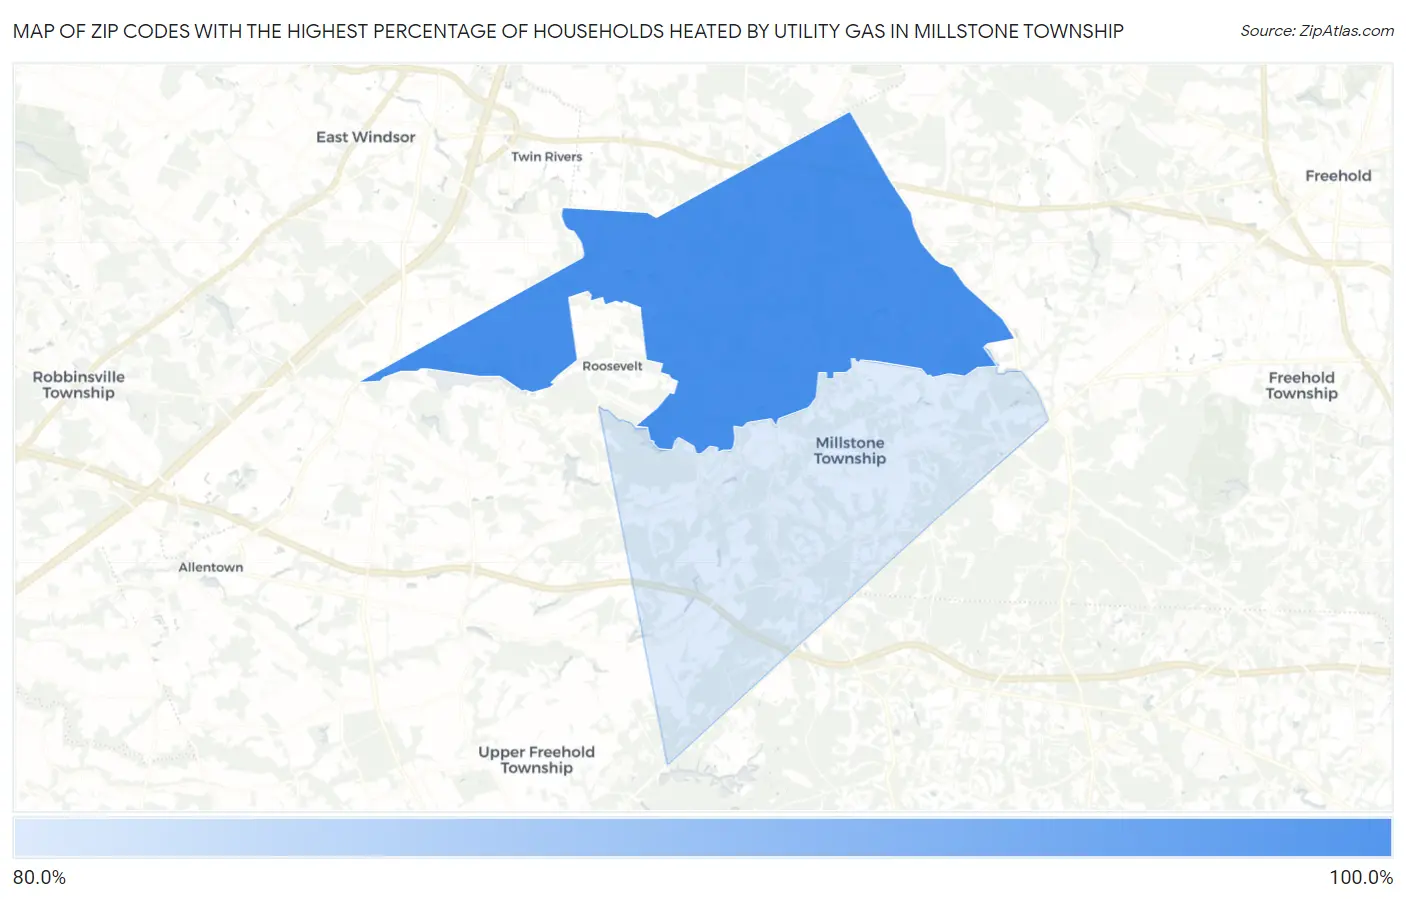
Map of Zip Codes with the Highest Percentage of Households Heated by Utility Gas in Millstone Township
83.7%
85.5%
Zip Codes with the Highest Percentage of Households Heated by Utility Gas in Millstone Township, NJ
| Zip Code | Utility Gas Heating | vs State | vs National | |
| 1. | 08535 | 85.5% | 73.8%(+11.7)#122 | 47.1%(+38.4)#1,238 |
| 2. | 08510 | 83.7% | 73.8%(+9.90)#163 | 47.1%(+36.6)#1,557 |
1
Common Questions
What are the Top Zip Codes with the Highest Percentage of Households Heated by Utility Gas in Millstone Township, NJ?
Top Zip Codes with the Highest Percentage of Households Heated by Utility Gas in Millstone Township, NJ are:
What zip code has the Highest Percentage of Households Heated by Utility Gas in Millstone Township, NJ?
08535 has the Highest Percentage of Households Heated by Utility Gas in Millstone Township, NJ with 85.5%.
What is the Percentage of Households Heated by Utility Gas in New Jersey?
Percentage of Households Heated by Utility Gas in New Jersey is 73.8%.
What is the Percentage of Households Heated by Utility Gas in the United States?
Percentage of Households Heated by Utility Gas in the United States is 47.1%.