Zip Codes with the Highest Percentage of Population Employed in Arts, Entertainment & Recreation in Millstone Township, NJ
RELATED REPORTS & OPTIONS
Arts, Entertainment & Recreation
Millstone Township
Compare Zip Codes
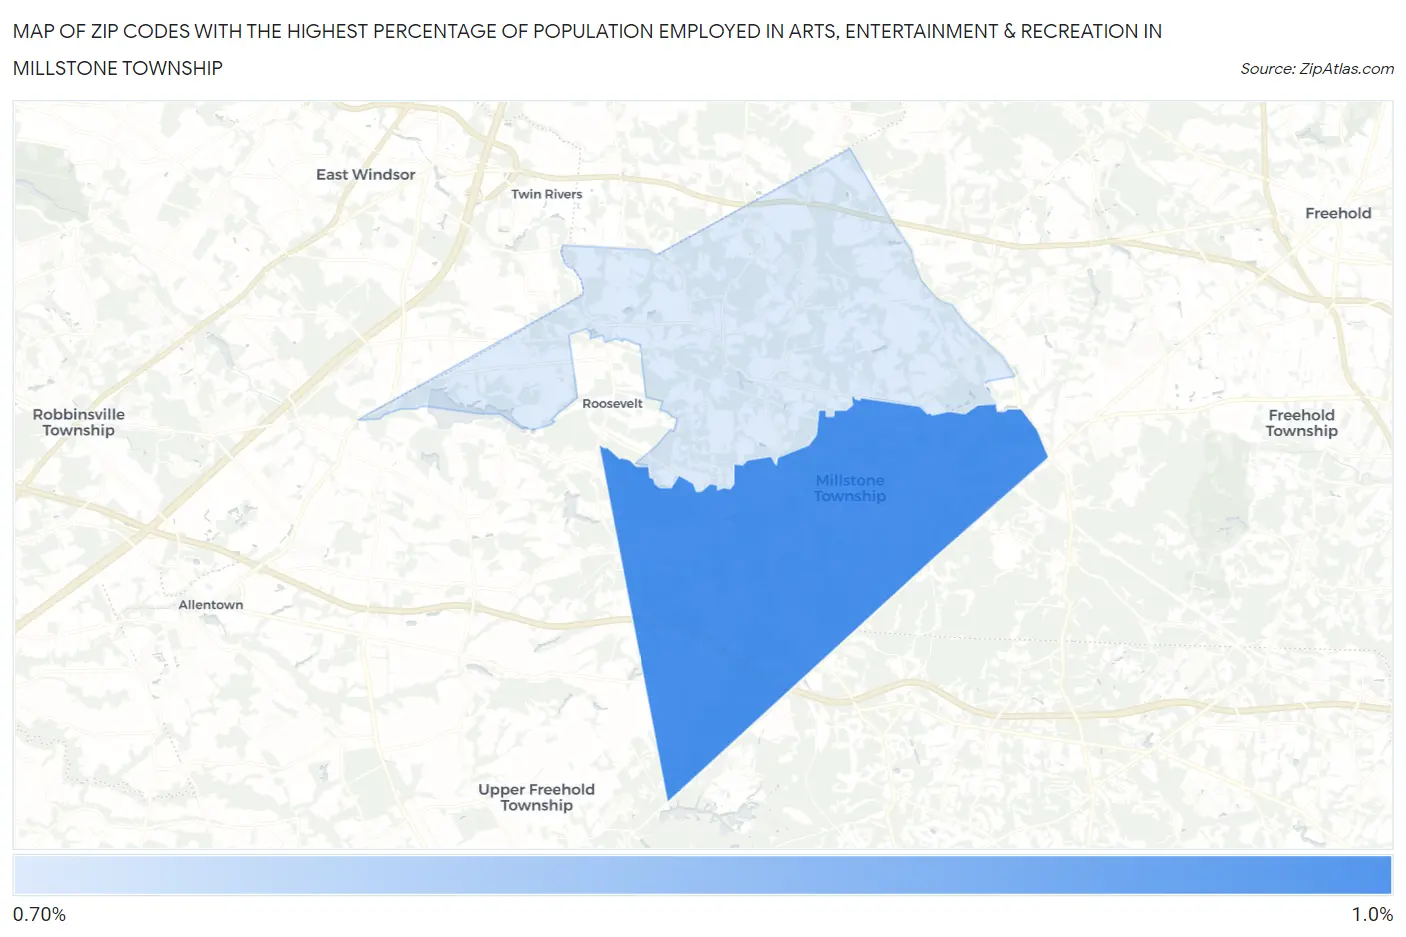
Map of Zip Codes with the Highest Percentage of Population Employed in Arts, Entertainment & Recreation in Millstone Township
0.73%
0.94%
Zip Codes with the Highest Percentage of Population Employed in Arts, Entertainment & Recreation in Millstone Township, NJ
| Zip Code | % Employed | vs State | vs National | |
| 1. | 08510 | 0.94% | 2.1%(-1.13)#457 | 2.1%(-1.14)#17,364 |
| 2. | 08535 | 0.73% | 2.1%(-1.34)#496 | 2.1%(-1.35)#18,925 |
1
Common Questions
What are the Top Zip Codes with the Highest Percentage of Population Employed in Arts, Entertainment & Recreation in Millstone Township, NJ?
Top Zip Codes with the Highest Percentage of Population Employed in Arts, Entertainment & Recreation in Millstone Township, NJ are:
What zip code has the Highest Percentage of Population Employed in Arts, Entertainment & Recreation in Millstone Township, NJ?
08510 has the Highest Percentage of Population Employed in Arts, Entertainment & Recreation in Millstone Township, NJ with 0.94%.
What is the Percentage of Population Employed in Arts, Entertainment & Recreation in New Jersey?
Percentage of Population Employed in Arts, Entertainment & Recreation in New Jersey is 2.1%.
What is the Percentage of Population Employed in Arts, Entertainment & Recreation in the United States?
Percentage of Population Employed in Arts, Entertainment & Recreation in the United States is 2.1%.