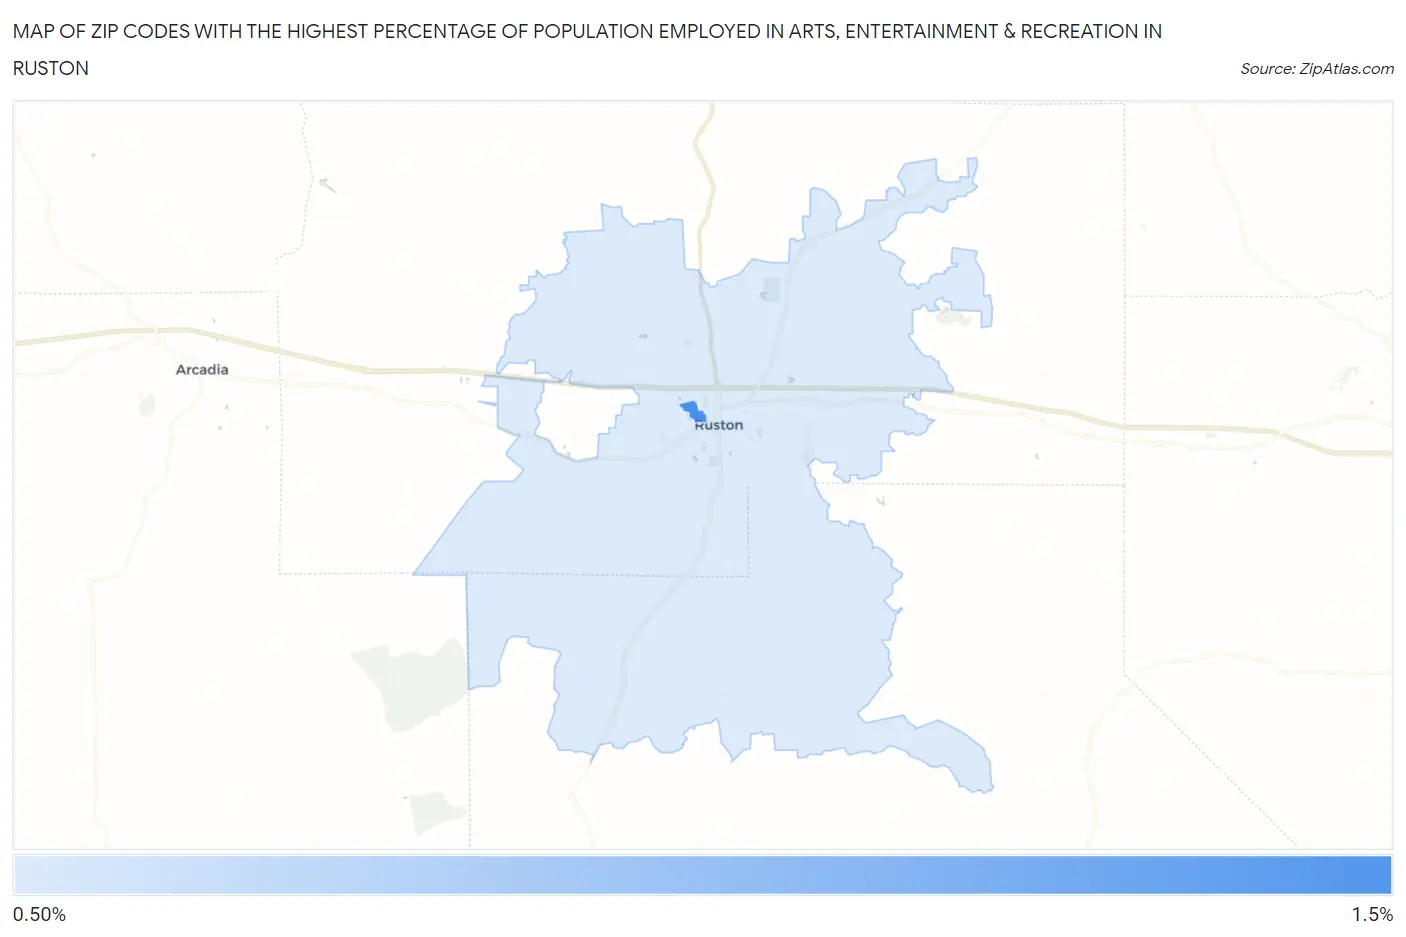
Zip Codes with the Highest Percentage of Population Employed in Arts, Entertainment & Recreation in Ruston, LA
RELATED REPORTS & OPTIONS
Arts, Entertainment & Recreation
Ruston
Compare Zip Codes
Map of Zip Codes with the Highest Percentage of Population Employed in Arts, Entertainment & Recreation in Ruston
0.76%
1.5%
Zip Codes with the Highest Percentage of Population Employed in Arts, Entertainment & Recreation in Ruston, LA
| Zip Code | % Employed | vs State | vs National | |
| 1. | 71272 | 1.5% | 2.2%(-0.744)#215 | 2.1%(-0.628)#13,568 |
| 2. | 71270 | 0.76% | 2.2%(-1.44)#279 | 2.1%(-1.32)#18,680 |
1
Common Questions
What are the Top Zip Codes with the Highest Percentage of Population Employed in Arts, Entertainment & Recreation in Ruston, LA?
Top Zip Codes with the Highest Percentage of Population Employed in Arts, Entertainment & Recreation in Ruston, LA are:
What zip code has the Highest Percentage of Population Employed in Arts, Entertainment & Recreation in Ruston, LA?
71272 has the Highest Percentage of Population Employed in Arts, Entertainment & Recreation in Ruston, LA with 1.5%.
What is the Percentage of Population Employed in Arts, Entertainment & Recreation in Ruston, LA?
Percentage of Population Employed in Arts, Entertainment & Recreation in Ruston is 1.2%.
What is the Percentage of Population Employed in Arts, Entertainment & Recreation in Louisiana?
Percentage of Population Employed in Arts, Entertainment & Recreation in Louisiana is 2.2%.
What is the Percentage of Population Employed in Arts, Entertainment & Recreation in the United States?
Percentage of Population Employed in Arts, Entertainment & Recreation in the United States is 2.1%.