Zip Codes with the Highest Percentage of Population Employed in Office & Administration in Ruston, LA
RELATED REPORTS & OPTIONS
Office & Administration
Ruston
Compare Zip Codes
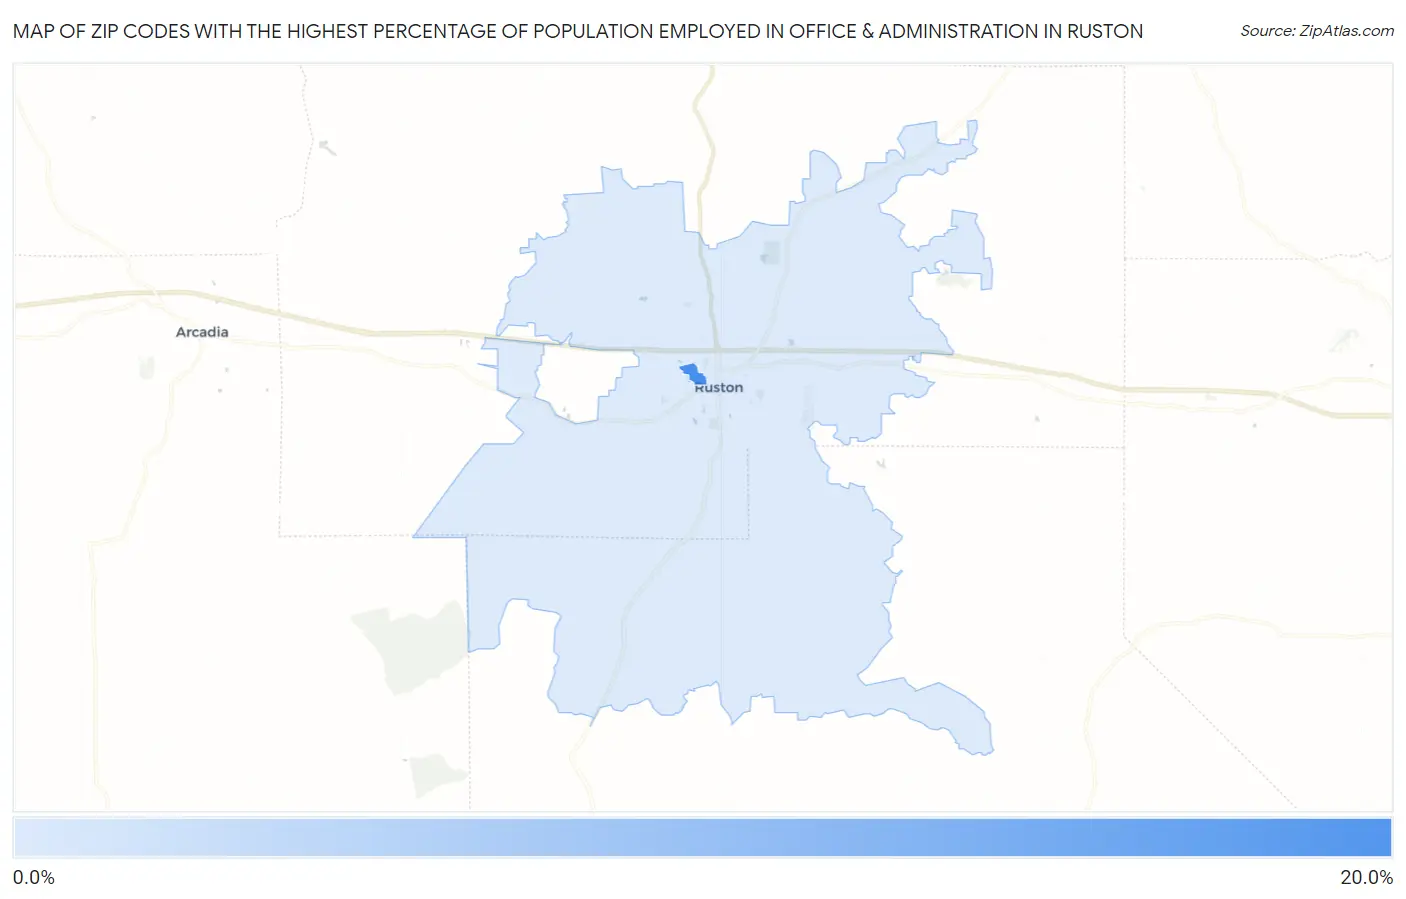
Map of Zip Codes with the Highest Percentage of Population Employed in Office & Administration in Ruston
8.4%
16.7%
Zip Codes with the Highest Percentage of Population Employed in Office & Administration in Ruston, LA
| Zip Code | % Employed | vs State | vs National | |
| 1. | 71272 | 16.7% | 10.6%(+6.07)#56 | 10.9%(+5.81)#3,029 |
| 2. | 71270 | 8.4% | 10.6%(-2.22)#336 | 10.9%(-2.48)#22,004 |
1
Common Questions
What are the Top Zip Codes with the Highest Percentage of Population Employed in Office & Administration in Ruston, LA?
Top Zip Codes with the Highest Percentage of Population Employed in Office & Administration in Ruston, LA are:
What zip code has the Highest Percentage of Population Employed in Office & Administration in Ruston, LA?
71272 has the Highest Percentage of Population Employed in Office & Administration in Ruston, LA with 16.7%.
What is the Percentage of Population Employed in Office & Administration in Ruston, LA?
Percentage of Population Employed in Office & Administration in Ruston is 9.4%.
What is the Percentage of Population Employed in Office & Administration in Louisiana?
Percentage of Population Employed in Office & Administration in Louisiana is 10.6%.
What is the Percentage of Population Employed in Office & Administration in the United States?
Percentage of Population Employed in Office & Administration in the United States is 10.9%.