Zip Codes with the Highest Percentage of Population Employed in Sales & Related in Ruston, LA
RELATED REPORTS & OPTIONS
Sales & Related
Ruston
Compare Zip Codes
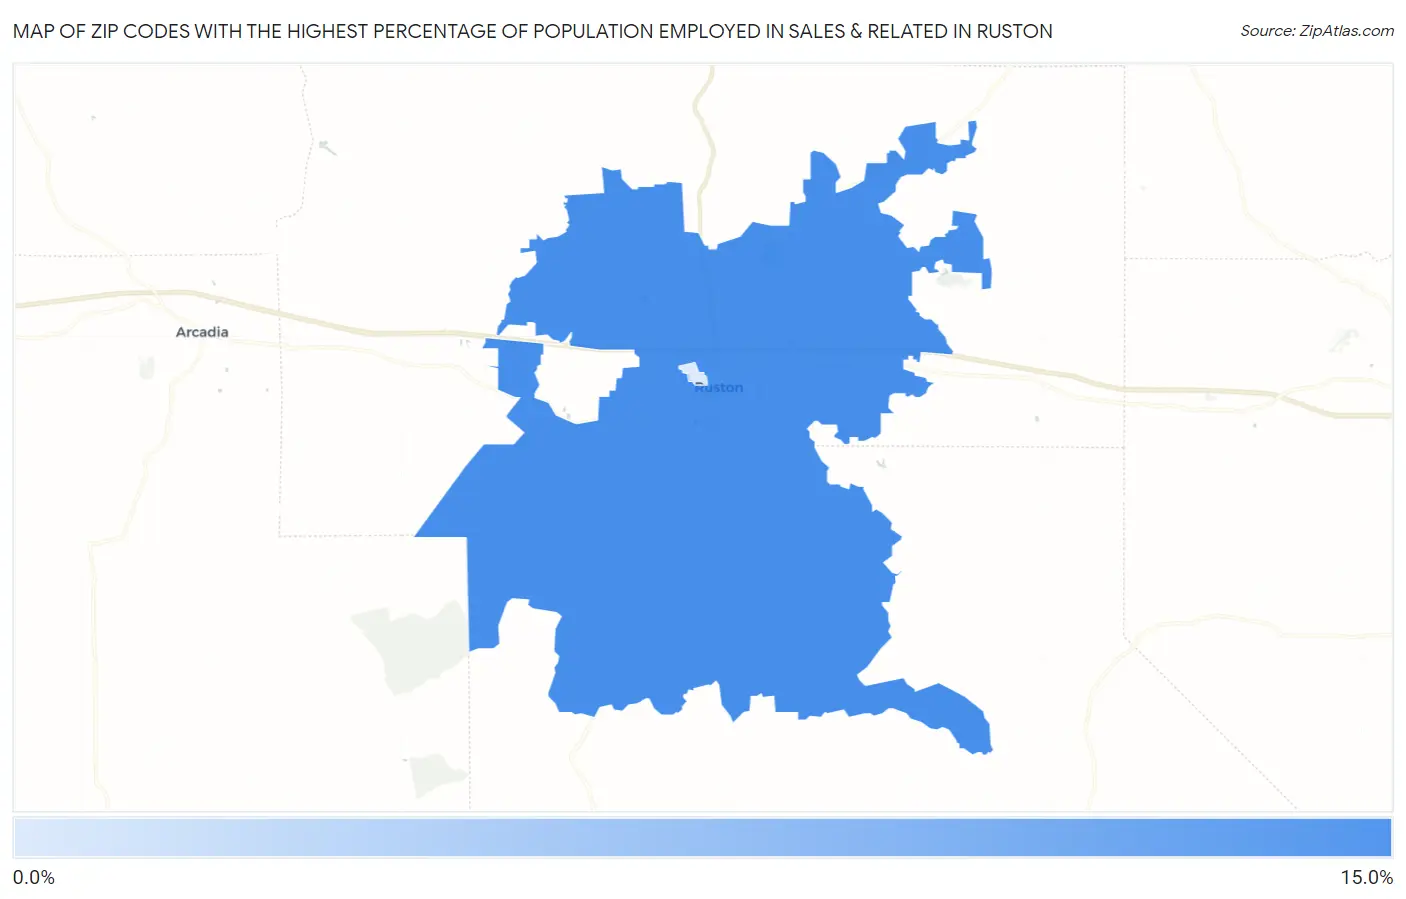
Map of Zip Codes with the Highest Percentage of Population Employed in Sales & Related in Ruston
1.6%
14.1%
Zip Codes with the Highest Percentage of Population Employed in Sales & Related in Ruston, LA
| Zip Code | % Employed | vs State | vs National | |
| 1. | 71270 | 14.1% | 10.2%(+3.93)#63 | 9.6%(+4.55)#3,359 |
| 2. | 71272 | 1.6% | 10.2%(-8.65)#449 | 9.6%(-8.03)#29,220 |
1
Common Questions
What are the Top Zip Codes with the Highest Percentage of Population Employed in Sales & Related in Ruston, LA?
Top Zip Codes with the Highest Percentage of Population Employed in Sales & Related in Ruston, LA are:
What zip code has the Highest Percentage of Population Employed in Sales & Related in Ruston, LA?
71270 has the Highest Percentage of Population Employed in Sales & Related in Ruston, LA with 14.1%.
What is the Percentage of Population Employed in Sales & Related in Ruston, LA?
Percentage of Population Employed in Sales & Related in Ruston is 14.6%.
What is the Percentage of Population Employed in Sales & Related in Louisiana?
Percentage of Population Employed in Sales & Related in Louisiana is 10.2%.
What is the Percentage of Population Employed in Sales & Related in the United States?
Percentage of Population Employed in Sales & Related in the United States is 9.6%.