Zip Codes with the Highest Percentage of Population Employed in Community & Social Service in Ruston, LA
RELATED REPORTS & OPTIONS
Community & Social Service
Ruston
Compare Zip Codes
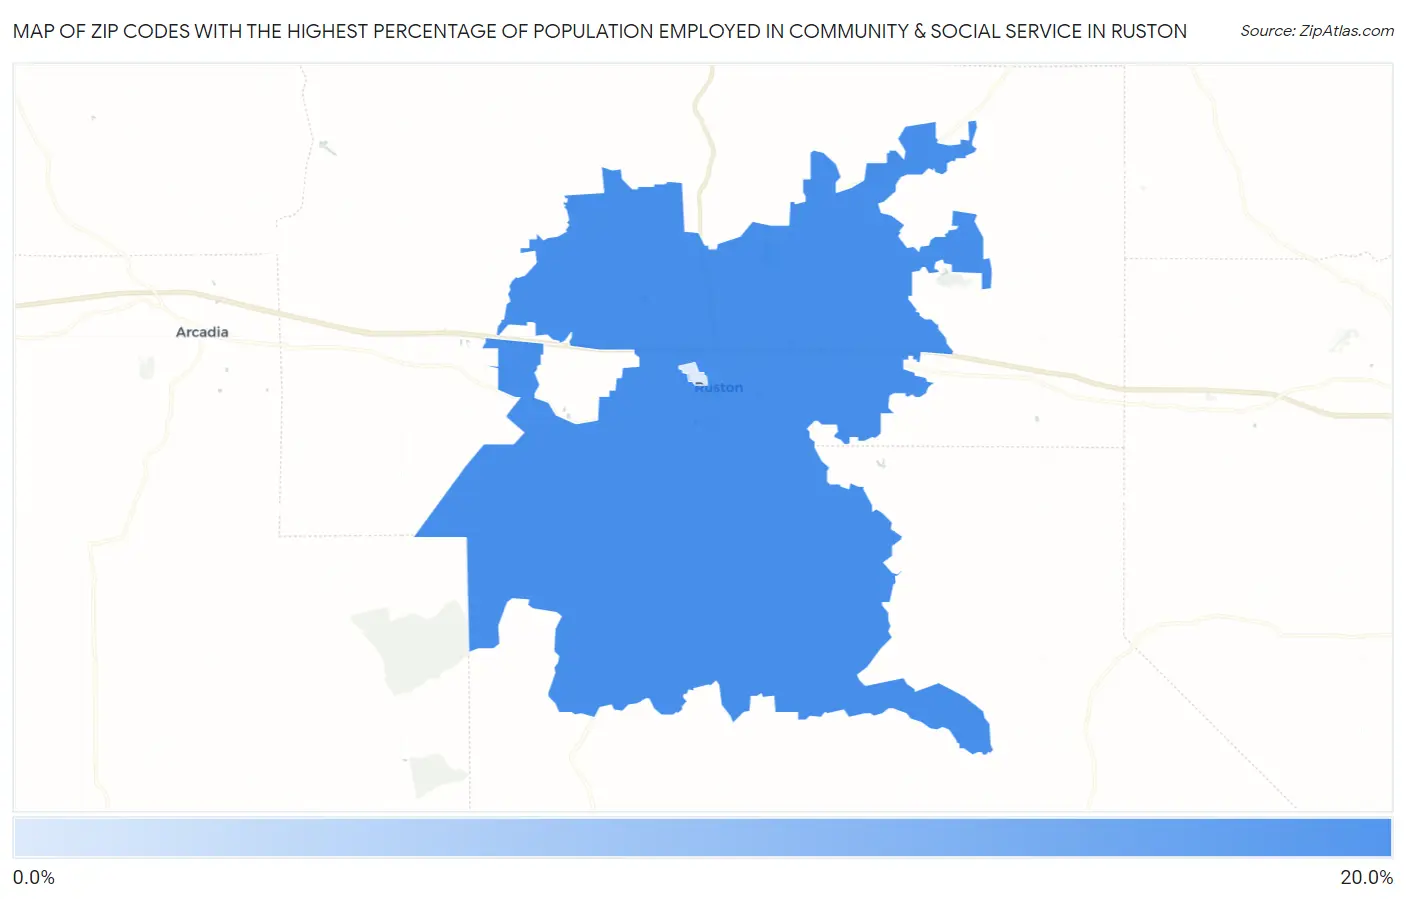
Map of Zip Codes with the Highest Percentage of Population Employed in Community & Social Service in Ruston
6.7%
15.3%
Zip Codes with the Highest Percentage of Population Employed in Community & Social Service in Ruston, LA
| Zip Code | % Employed | vs State | vs National | |
| 1. | 71270 | 15.3% | 11.4%(+3.87)#74 | 11.2%(+4.07)#4,717 |
| 2. | 71272 | 6.7% | 11.4%(-4.70)#348 | 11.2%(-4.50)#22,796 |
1
Common Questions
What are the Top Zip Codes with the Highest Percentage of Population Employed in Community & Social Service in Ruston, LA?
Top Zip Codes with the Highest Percentage of Population Employed in Community & Social Service in Ruston, LA are:
What zip code has the Highest Percentage of Population Employed in Community & Social Service in Ruston, LA?
71270 has the Highest Percentage of Population Employed in Community & Social Service in Ruston, LA with 15.3%.
What is the Percentage of Population Employed in Community & Social Service in Ruston, LA?
Percentage of Population Employed in Community & Social Service in Ruston is 14.4%.
What is the Percentage of Population Employed in Community & Social Service in Louisiana?
Percentage of Population Employed in Community & Social Service in Louisiana is 11.4%.
What is the Percentage of Population Employed in Community & Social Service in the United States?
Percentage of Population Employed in Community & Social Service in the United States is 11.2%.