Zip Codes with the Highest Percentage of Population Employed in Accommodation & Food Services in Ruston, LA
RELATED REPORTS & OPTIONS
Accommodation & Food Services
Ruston
Compare Zip Codes
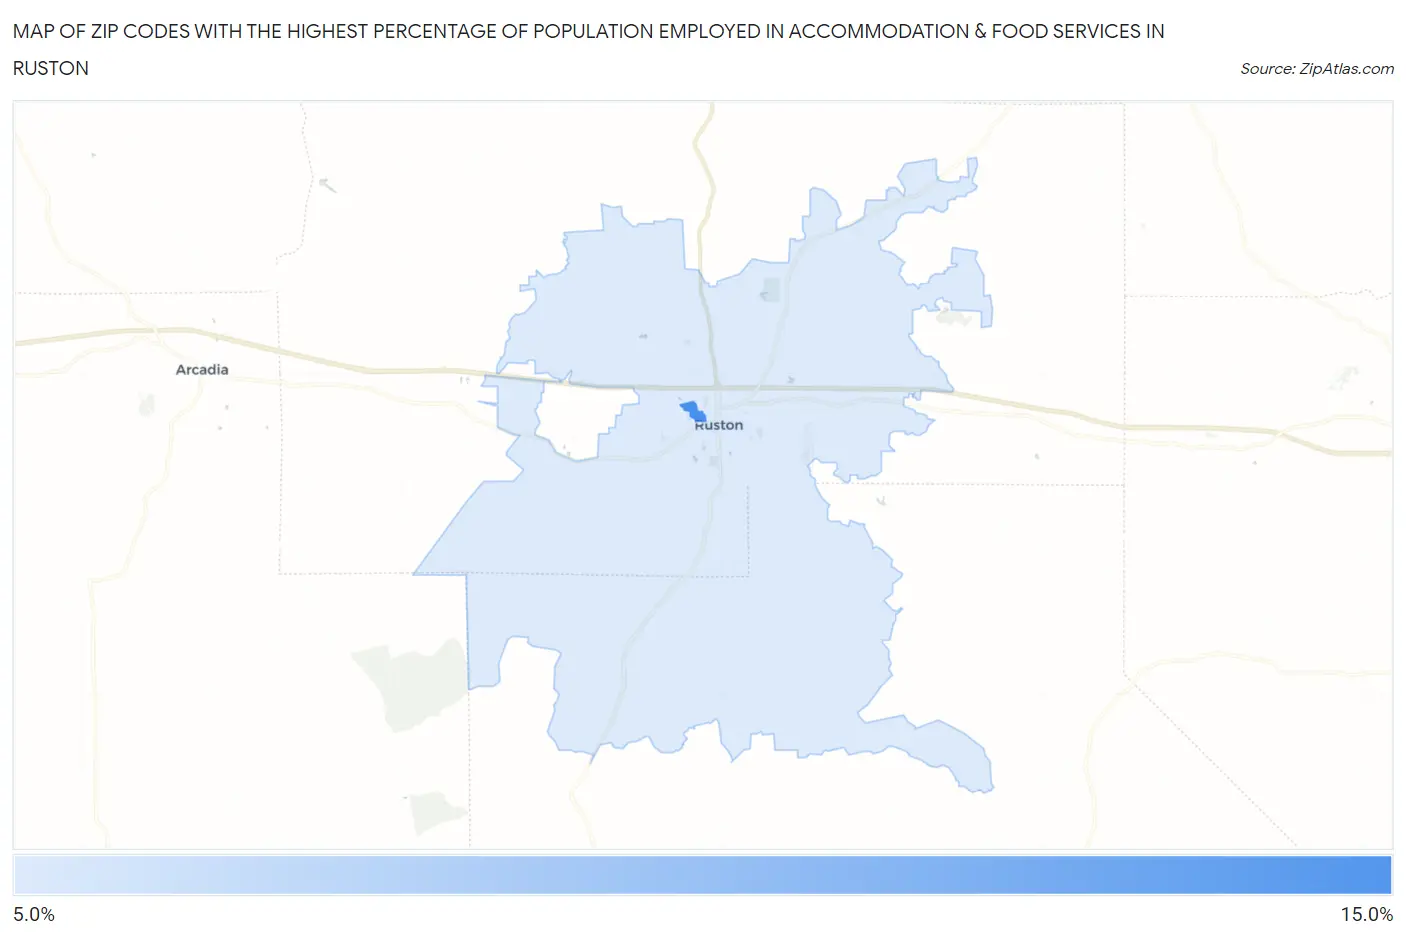
Map of Zip Codes with the Highest Percentage of Population Employed in Accommodation & Food Services in Ruston
10.1%
14.3%
Zip Codes with the Highest Percentage of Population Employed in Accommodation & Food Services in Ruston, LA
| Zip Code | % Employed | vs State | vs National | |
| 1. | 71272 | 14.3% | 7.6%(+6.71)#39 | 6.9%(+7.44)#1,867 |
| 2. | 71270 | 10.1% | 7.6%(+2.49)#89 | 6.9%(+3.22)#4,413 |
1
Common Questions
What are the Top Zip Codes with the Highest Percentage of Population Employed in Accommodation & Food Services in Ruston, LA?
Top Zip Codes with the Highest Percentage of Population Employed in Accommodation & Food Services in Ruston, LA are:
What zip code has the Highest Percentage of Population Employed in Accommodation & Food Services in Ruston, LA?
71272 has the Highest Percentage of Population Employed in Accommodation & Food Services in Ruston, LA with 14.3%.
What is the Percentage of Population Employed in Accommodation & Food Services in Ruston, LA?
Percentage of Population Employed in Accommodation & Food Services in Ruston is 13.0%.
What is the Percentage of Population Employed in Accommodation & Food Services in Louisiana?
Percentage of Population Employed in Accommodation & Food Services in Louisiana is 7.6%.
What is the Percentage of Population Employed in Accommodation & Food Services in the United States?
Percentage of Population Employed in Accommodation & Food Services in the United States is 6.9%.