Zip Codes with the Highest Percentage of Population with a Degree in Bio, Nature & Agricultural in Wisconsin
RELATED REPORTS & OPTIONS
Bio, Nature & Agricultural
Wisconsin
Compare Zip Codes
Map of Zip Codes with the Highest Percentage of Population with a Degree in Bio, Nature & Agricultural in Wisconsin
10.0%
50.0%
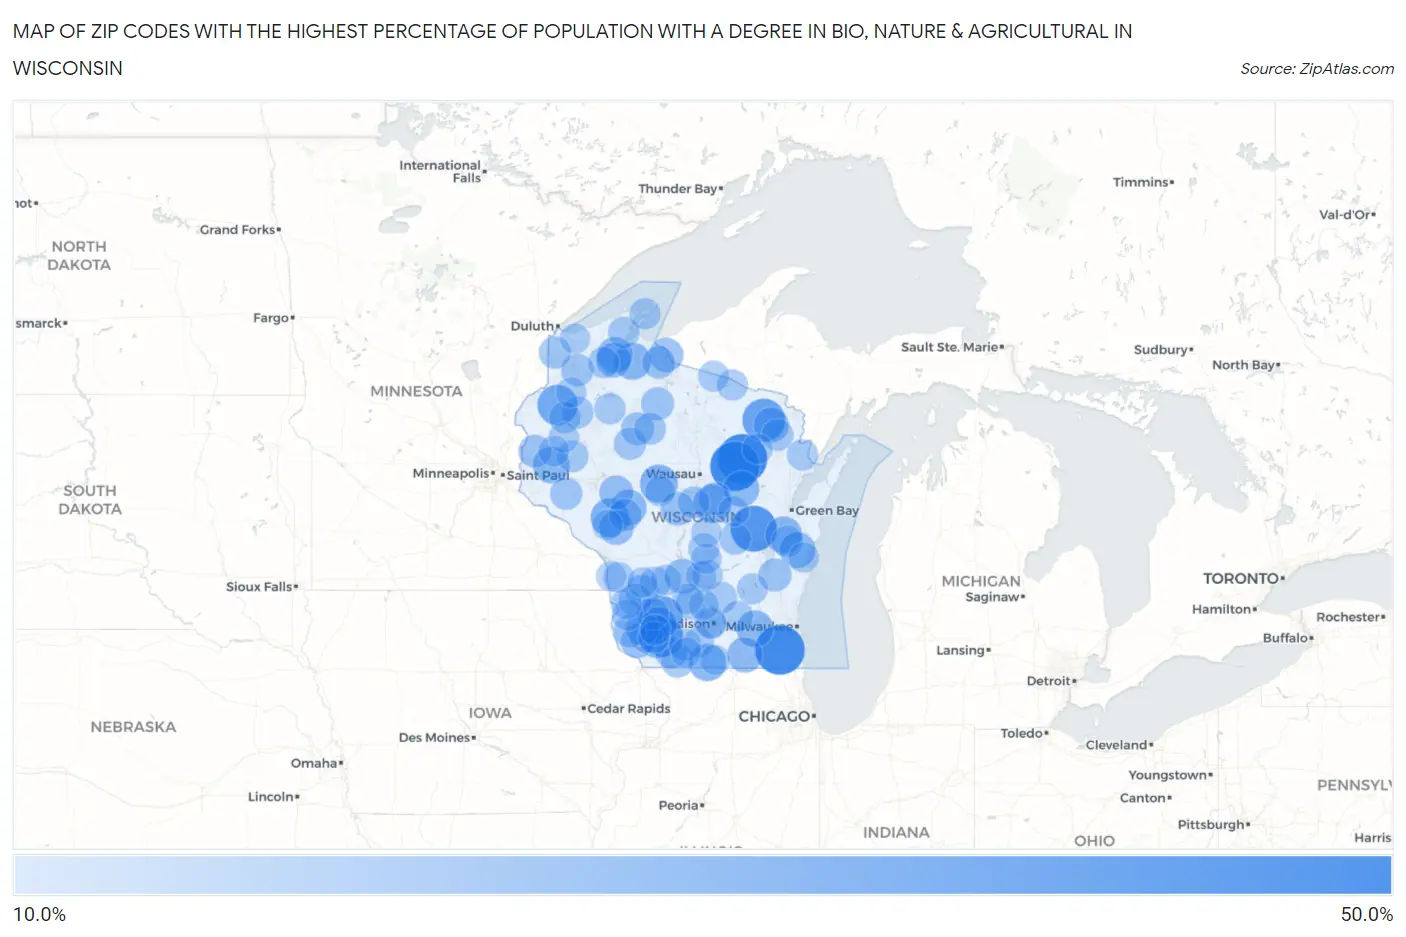
Zip Codes with the Highest Percentage of Population with a Degree in Bio, Nature & Agricultural in Wisconsin
| Zip Code | % Graduates | vs State | vs National | |
| 1. | 53167 | 50.0% | 8.2% (+41.8)#1 | 6.4% (+43.6)#334 |
| 2. | 54430 | 50.0% | 8.2% (+41.8)#2 | 6.4% (+43.6)#354 |
| 3. | 54464 | 50.0% | 8.2% (+41.8)#3 | 6.4% (+43.6)#359 |
| 4. | 54931 | 43.9% | 8.2% (+35.7)#4 | 6.4% (+37.5)#483 |
| 5. | 53506 | 38.4% | 8.2% (+30.2)#5 | 6.4% (+32.0)#629 |
| 6. | 54103 | 37.6% | 8.2% (+29.5)#6 | 6.4% (+31.3)#656 |
| 7. | 53553 | 34.9% | 8.2% (+26.7)#7 | 6.4% (+28.5)#775 |
| 8. | 54845 | 33.3% | 8.2% (+25.2)#8 | 6.4% (+27.0)#878 |
| 9. | 54760 | 30.2% | 8.2% (+22.1)#9 | 6.4% (+23.9)#1,067 |
| 10. | 54423 | 29.7% | 8.2% (+21.5)#10 | 6.4% (+23.3)#1,110 |
| 11. | 54488 | 29.3% | 8.2% (+21.2)#11 | 6.4% (+23.0)#1,135 |
| 12. | 53550 | 28.1% | 8.2% (+20.0)#12 | 6.4% (+21.8)#1,228 |
| 13. | 54855 | 27.6% | 8.2% (+19.5)#13 | 6.4% (+21.3)#1,287 |
| 14. | 54123 | 27.3% | 8.2% (+19.1)#14 | 6.4% (+20.9)#1,325 |
| 15. | 54013 | 26.9% | 8.2% (+18.7)#15 | 6.4% (+20.5)#1,353 |
| 16. | 53137 | 26.8% | 8.2% (+18.7)#16 | 6.4% (+20.5)#1,360 |
| 17. | 53580 | 26.6% | 8.2% (+18.4)#17 | 6.4% (+20.2)#1,395 |
| 18. | 53543 | 26.4% | 8.2% (+18.3)#18 | 6.4% (+20.1)#1,412 |
| 19. | 54948 | 25.8% | 8.2% (+17.7)#19 | 6.4% (+19.5)#1,472 |
| 20. | 54232 | 25.6% | 8.2% (+17.5)#20 | 6.4% (+19.3)#1,498 |
| 21. | 54856 | 25.2% | 8.2% (+17.0)#21 | 6.4% (+18.8)#1,552 |
| 22. | 54746 | 25.0% | 8.2% (+16.8)#22 | 6.4% (+18.6)#1,576 |
| 23. | 53505 | 24.3% | 8.2% (+16.2)#23 | 6.4% (+18.0)#1,682 |
| 24. | 54125 | 24.1% | 8.2% (+15.9)#24 | 6.4% (+17.7)#1,711 |
| 25. | 53944 | 23.9% | 8.2% (+15.8)#25 | 6.4% (+17.6)#1,734 |
| 26. | 54839 | 23.7% | 8.2% (+15.5)#26 | 6.4% (+17.3)#1,766 |
| 27. | 54659 | 23.5% | 8.2% (+15.3)#27 | 6.4% (+17.1)#1,800 |
| 28. | 54525 | 22.5% | 8.2% (+14.4)#28 | 6.4% (+16.2)#1,970 |
| 29. | 54722 | 22.3% | 8.2% (+14.1)#29 | 6.4% (+15.9)#2,014 |
| 30. | 54410 | 21.6% | 8.2% (+13.4)#30 | 6.4% (+15.2)#2,178 |
| 31. | 53813 | 21.4% | 8.2% (+13.2)#31 | 6.4% (+15.0)#2,233 |
| 32. | 54524 | 20.7% | 8.2% (+12.5)#32 | 6.4% (+14.3)#2,364 |
| 33. | 53825 | 20.7% | 8.2% (+12.5)#33 | 6.4% (+14.3)#2,367 |
| 34. | 53019 | 20.6% | 8.2% (+12.5)#34 | 6.4% (+14.3)#2,385 |
| 35. | 53809 | 20.6% | 8.2% (+12.4)#35 | 6.4% (+14.2)#2,395 |
| 36. | 54664 | 20.5% | 8.2% (+12.4)#36 | 6.4% (+14.2)#2,401 |
| 37. | 54026 | 20.4% | 8.2% (+12.3)#37 | 6.4% (+14.1)#2,424 |
| 38. | 54530 | 20.4% | 8.2% (+12.3)#38 | 6.4% (+14.1)#2,427 |
| 39. | 54655 | 20.1% | 8.2% (+11.9)#39 | 6.4% (+13.7)#2,491 |
| 40. | 54473 | 20.0% | 8.2% (+11.9)#40 | 6.4% (+13.7)#2,494 |
| 41. | 53816 | 20.0% | 8.2% (+11.8)#41 | 6.4% (+13.6)#2,513 |
| 42. | 54536 | 20.0% | 8.2% (+11.8)#42 | 6.4% (+13.6)#2,555 |
| 43. | 53573 | 19.6% | 8.2% (+11.5)#43 | 6.4% (+13.3)#2,629 |
| 44. | 53541 | 19.6% | 8.2% (+11.4)#44 | 6.4% (+13.2)#2,648 |
| 45. | 54838 | 19.4% | 8.2% (+11.3)#45 | 6.4% (+13.1)#2,680 |
| 46. | 54611 | 19.3% | 8.2% (+11.2)#46 | 6.4% (+13.0)#2,705 |
| 47. | 53530 | 19.3% | 8.2% (+11.2)#47 | 6.4% (+13.0)#2,709 |
| 48. | 54737 | 19.3% | 8.2% (+11.1)#48 | 6.4% (+12.9)#2,716 |
| 49. | 54836 | 19.0% | 8.2% (+10.9)#49 | 6.4% (+12.7)#2,774 |
| 50. | 54766 | 18.9% | 8.2% (+10.8)#50 | 6.4% (+12.6)#2,795 |
| 51. | 53516 | 18.7% | 8.2% (+10.6)#51 | 6.4% (+12.4)#2,869 |
| 52. | 54443 | 18.7% | 8.2% (+10.5)#52 | 6.4% (+12.3)#2,878 |
| 53. | 54870 | 18.5% | 8.2% (+10.4)#53 | 6.4% (+12.2)#2,923 |
| 54. | 54515 | 18.5% | 8.2% (+10.4)#54 | 6.4% (+12.2)#2,926 |
| 55. | 54965 | 18.4% | 8.2% (+10.3)#55 | 6.4% (+12.1)#2,956 |
| 56. | 53705 | 18.3% | 8.2% (+10.2)#56 | 6.4% (+12.0)#2,976 |
| 57. | 54104 | 18.3% | 8.2% (+10.1)#57 | 6.4% (+11.9)#2,994 |
| 58. | 54763 | 18.2% | 8.2% (+10.1)#58 | 6.4% (+11.9)#3,006 |
| 59. | 54160 | 18.2% | 8.2% (+10.0)#59 | 6.4% (+11.8)#3,034 |
| 60. | 54813 | 18.1% | 8.2% (+9.94)#60 | 6.4% (+11.7)#3,052 |
| 61. | 53554 | 17.7% | 8.2% (+9.59)#61 | 6.4% (+11.4)#3,164 |
| 62. | 54891 | 17.7% | 8.2% (+9.56)#62 | 6.4% (+11.4)#3,177 |
| 63. | 53578 | 17.7% | 8.2% (+9.51)#63 | 6.4% (+11.3)#3,193 |
| 64. | 53960 | 17.6% | 8.2% (+9.43)#64 | 6.4% (+11.2)#3,226 |
| 65. | 54832 | 17.5% | 8.2% (+9.35)#65 | 6.4% (+11.1)#3,260 |
| 66. | 54850 | 17.5% | 8.2% (+9.32)#66 | 6.4% (+11.1)#3,266 |
| 67. | 54634 | 17.4% | 8.2% (+9.29)#67 | 6.4% (+11.1)#3,272 |
| 68. | 54867 | 17.3% | 8.2% (+9.16)#68 | 6.4% (+11.0)#3,319 |
| 69. | 54657 | 17.2% | 8.2% (+9.09)#69 | 6.4% (+10.9)#3,350 |
| 70. | 54159 | 17.2% | 8.2% (+9.02)#70 | 6.4% (+10.8)#3,373 |
| 71. | 53594 | 17.0% | 8.2% (+8.89)#71 | 6.4% (+10.7)#3,421 |
| 72. | 54554 | 17.0% | 8.2% (+8.88)#72 | 6.4% (+10.7)#3,424 |
| 73. | 54930 | 17.0% | 8.2% (+8.81)#73 | 6.4% (+10.6)#3,438 |
| 74. | 53922 | 16.9% | 8.2% (+8.72)#74 | 6.4% (+10.5)#3,471 |
| 75. | 54540 | 16.8% | 8.2% (+8.70)#75 | 6.4% (+10.5)#3,479 |
| 76. | 54645 | 16.7% | 8.2% (+8.52)#76 | 6.4% (+10.3)#3,574 |
| 77. | 53569 | 16.6% | 8.2% (+8.42)#77 | 6.4% (+10.2)#3,599 |
| 78. | 54005 | 16.5% | 8.2% (+8.33)#78 | 6.4% (+10.1)#3,628 |
| 79. | 53930 | 16.5% | 8.2% (+8.32)#79 | 6.4% (+10.1)#3,633 |
| 80. | 54621 | 16.3% | 8.2% (+8.18)#80 | 6.4% (+9.97)#3,685 |
| 81. | 54962 | 16.3% | 8.2% (+8.11)#81 | 6.4% (+9.91)#3,708 |
| 82. | 53920 | 16.2% | 8.2% (+8.07)#82 | 6.4% (+9.86)#3,728 |
| 83. | 53951 | 16.2% | 8.2% (+8.05)#83 | 6.4% (+9.85)#3,733 |
| 84. | 54175 | 16.1% | 8.2% (+7.99)#84 | 6.4% (+9.79)#3,755 |
| 85. | 53574 | 16.1% | 8.2% (+7.93)#85 | 6.4% (+9.73)#3,778 |
| 86. | 53964 | 16.1% | 8.2% (+7.92)#86 | 6.4% (+9.72)#3,782 |
| 87. | 53968 | 16.0% | 8.2% (+7.90)#87 | 6.4% (+9.70)#3,793 |
| 88. | 54639 | 16.0% | 8.2% (+7.89)#88 | 6.4% (+9.69)#3,796 |
| 89. | 53504 | 15.9% | 8.2% (+7.78)#89 | 6.4% (+9.58)#3,833 |
| 90. | 54888 | 15.9% | 8.2% (+7.72)#90 | 6.4% (+9.51)#3,863 |
| 91. | 54805 | 15.8% | 8.2% (+7.68)#91 | 6.4% (+9.47)#3,875 |
| 92. | 53015 | 15.8% | 8.2% (+7.64)#92 | 6.4% (+9.44)#3,883 |
| 93. | 54966 | 15.7% | 8.2% (+7.59)#93 | 6.4% (+9.38)#3,910 |
| 94. | 53520 | 15.7% | 8.2% (+7.57)#94 | 6.4% (+9.36)#3,916 |
| 95. | 54616 | 15.7% | 8.2% (+7.56)#95 | 6.4% (+9.36)#3,918 |
| 96. | 53726 | 15.7% | 8.2% (+7.53)#96 | 6.4% (+9.33)#3,931 |
| 97. | 53555 | 15.7% | 8.2% (+7.50)#97 | 6.4% (+9.30)#3,940 |
| 98. | 54658 | 15.7% | 8.2% (+7.50)#98 | 6.4% (+9.30)#3,942 |
| 99. | 54864 | 15.6% | 8.2% (+7.47)#99 | 6.4% (+9.27)#3,956 |
| 100. | 54479 | 15.6% | 8.2% (+7.45)#100 | 6.4% (+9.25)#3,965 |
Common Questions
What are the Top 10 Zip Codes with the Highest Percentage of Population with a Degree in Bio, Nature & Agricultural in Wisconsin?
Top 10 Zip Codes with the Highest Percentage of Population with a Degree in Bio, Nature & Agricultural in Wisconsin are:
What zip code has the Highest Percentage of Population with a Degree in Bio, Nature & Agricultural in Wisconsin?
53167 has the Highest Percentage of Population with a Degree in Bio, Nature & Agricultural in Wisconsin with 50.0%.
What is the Percentage of Population with a Degree in Bio, Nature & Agricultural in the State of Wisconsin?
Percentage of Population with a Degree in Bio, Nature & Agricultural in Wisconsin is 8.2%.
What is the Percentage of Population with a Degree in Bio, Nature & Agricultural in the United States?
Percentage of Population with a Degree in Bio, Nature & Agricultural in the United States is 6.4%.