Zip Codes with the Highest Percentage of Not-for-profit Organizations in Bloomington, IN

RELATED REPORTS & OPTIONS

Not-for-profit Organizations
Population
Families and Households
Female Fertility
Female Fertility (Unmarried)
Race (Community Size)
Race (Percentage)
Ancestry (Community Size)
AfricanAlbanianAmericanArabArgentineanAssyrian / Chaldean / SyriacAustrianBelgianBhutaneseBlackfeetBritishBurmeseCambodianCanadianCentral AmericanCentral American IndianCherokeeColombianCosta RicanCroatianCubanCzechCzechoslovakianDanishDominicanDutchEastern EuropeanEgyptianEnglishEstonianEthiopianEuropeanFilipinoFinnishFrenchFrench CanadianGermanGhanaianGreekGuatemalanHaitianHonduranHungarianIcelanderIndian (Asian)IndonesianIranianIrishIroquoisIsraeliItalianJamaicanKenyanKoreanLatvianLebaneseLithuanianMacedonianMexicanMexican American IndianMongolianNative HawaiianNavajoNew ZealanderNigerianNorthern EuropeanNorwegianOkinawanPakistaniPanamanianParaguayanPeruvianPolishPortuguesePuerto RicanRomanianRussianSalvadoranScandinavianScotch-IrishScottishSerbianSiouxSlavicSlovakSloveneSouth AmericanSpaniardSpanishSri LankanSubsaharan AfricanSwedishSwissThaiTurkishUkrainianUruguayanVenezuelanWelshYugoslavian
Ancestry (Percentage)
AfricanAlbanianAmericanArabArgentineanAssyrian / Chaldean / SyriacAustrianBelgianBhutaneseBlackfeetBritishBurmeseCambodianCanadianCentral AmericanCentral American IndianCherokeeColombianCosta RicanCroatianCubanCzechCzechoslovakianDanishDominicanDutchEastern EuropeanEgyptianEnglishEstonianEthiopianEuropeanFilipinoFinnishFrenchFrench CanadianGermanGhanaianGreekGuatemalanHaitianHonduranHungarianIcelanderIndian (Asian)IndonesianIranianIrishIroquoisIsraeliItalianJamaicanKenyanKoreanLatvianLebaneseLithuanianMacedonianMexicanMexican American IndianMongolianNative HawaiianNavajoNew ZealanderNigerianNorthern EuropeanNorwegianOkinawanPakistaniPanamanianParaguayanPeruvianPolishPortuguesePuerto RicanRomanianRussianSalvadoranScandinavianScotch-IrishScottishSerbianSiouxSlavicSlovakSloveneSouth AmericanSpaniardSpanishSri LankanSubsaharan AfricanSwedishSwissThaiTurkishUkrainianUruguayanVenezuelanWelshYugoslavian
Immigrant Origin (Total)
Immigrant Origin (Percentage)
Income
Income (Families)
Income (Households)
Poverty
Poverty (Families)
Unemployment
Employment Occupations
Employment Industries
Employer Class
Commute Time
Commute Means
School Enrollment
Education by Degree Field
Occupancy
Finances
Physical Characteristics
Bloomington
Compare Zip Codes
Comparison Subject

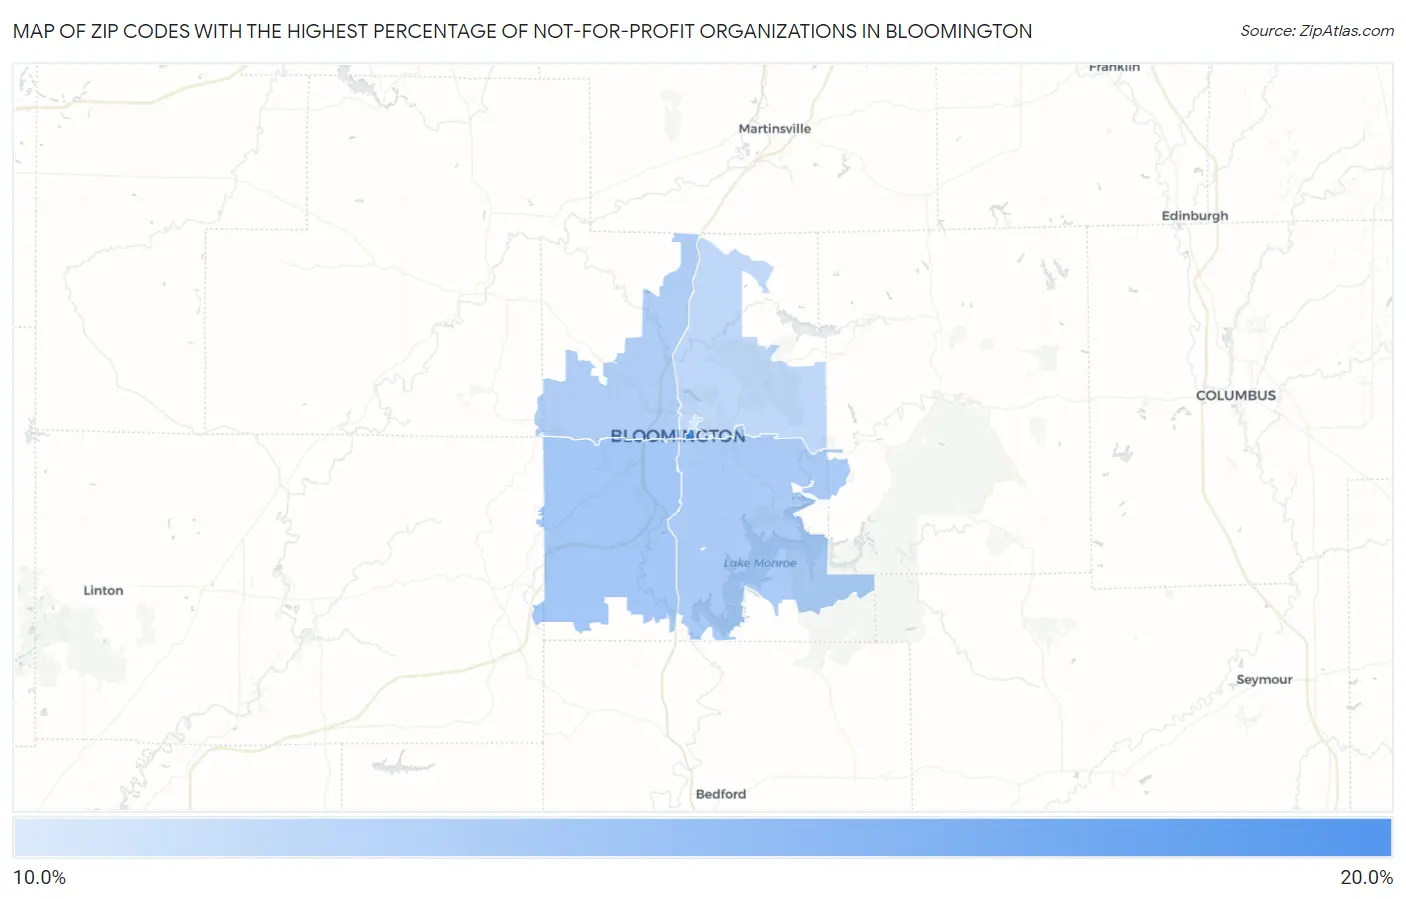
Map of Zip Codes with the Highest Percentage of Not-for-profit Organizations in Bloomington

0.0%
20.0%
Zip Codes with the Highest Percentage of Not-for-profit Organizations in Bloomington Map

Zip Codes with the Highest Percentage of Not-for-profit Organizations in Bloomington, IN

Zip Code % Employed in Not-for-profit vs State vs National
1.4740516.6%9.8%(+6.77)#458.4%(+8.11)#2,203
2.4740312.5%9.8%(+2.68)#1278.4%(+4.02)#5,087
3.4740112.2%9.8%(+2.45)#1338.4%(+3.79)#5,336
4.4740412.0%9.8%(+2.22)#1448.4%(+3.55)#5,648
5.4740811.3%9.8%(+1.53)#1738.4%(+2.87)#6,565
6.4740610.1%9.8%(+0.271)#2588.4%(+1.61)#8,813

Common Questions

What are the Top 5 Zip Codes with the Highest Percentage of Not-for-profit Organizations in Bloomington, IN?
Top 5 Zip Codes with the Highest Percentage of Not-for-profit Organizations in Bloomington, IN are:
#1
16.6%
#2
12.5%
#3
12.2%
#4
12.0%
#5
11.3%
What zip code has the Highest Percentage of Not-for-profit Organizations in Bloomington, IN?
47405 has the Highest Percentage of Not-for-profit Organizations in Bloomington, IN with 16.6%.
What is the Percentage of Not-for-profit Organizations in Bloomington, IN?
Percentage of Not-for-profit Organizations in Bloomington is 12.9%.
What is the Percentage of Not-for-profit Organizations in Indiana?
Percentage of Not-for-profit Organizations in Indiana is 9.8%.
What is the Percentage of Not-for-profit Organizations in the United States?
Percentage of Not-for-profit Organizations in the United States is 8.4%.