Zip Codes with the Highest Percentage of Population Employed in Installation, Maintenance & Repair in Greenwood, IN
RELATED REPORTS & OPTIONS
Installation, Maintenance & Repair
Greenwood
Compare Zip Codes
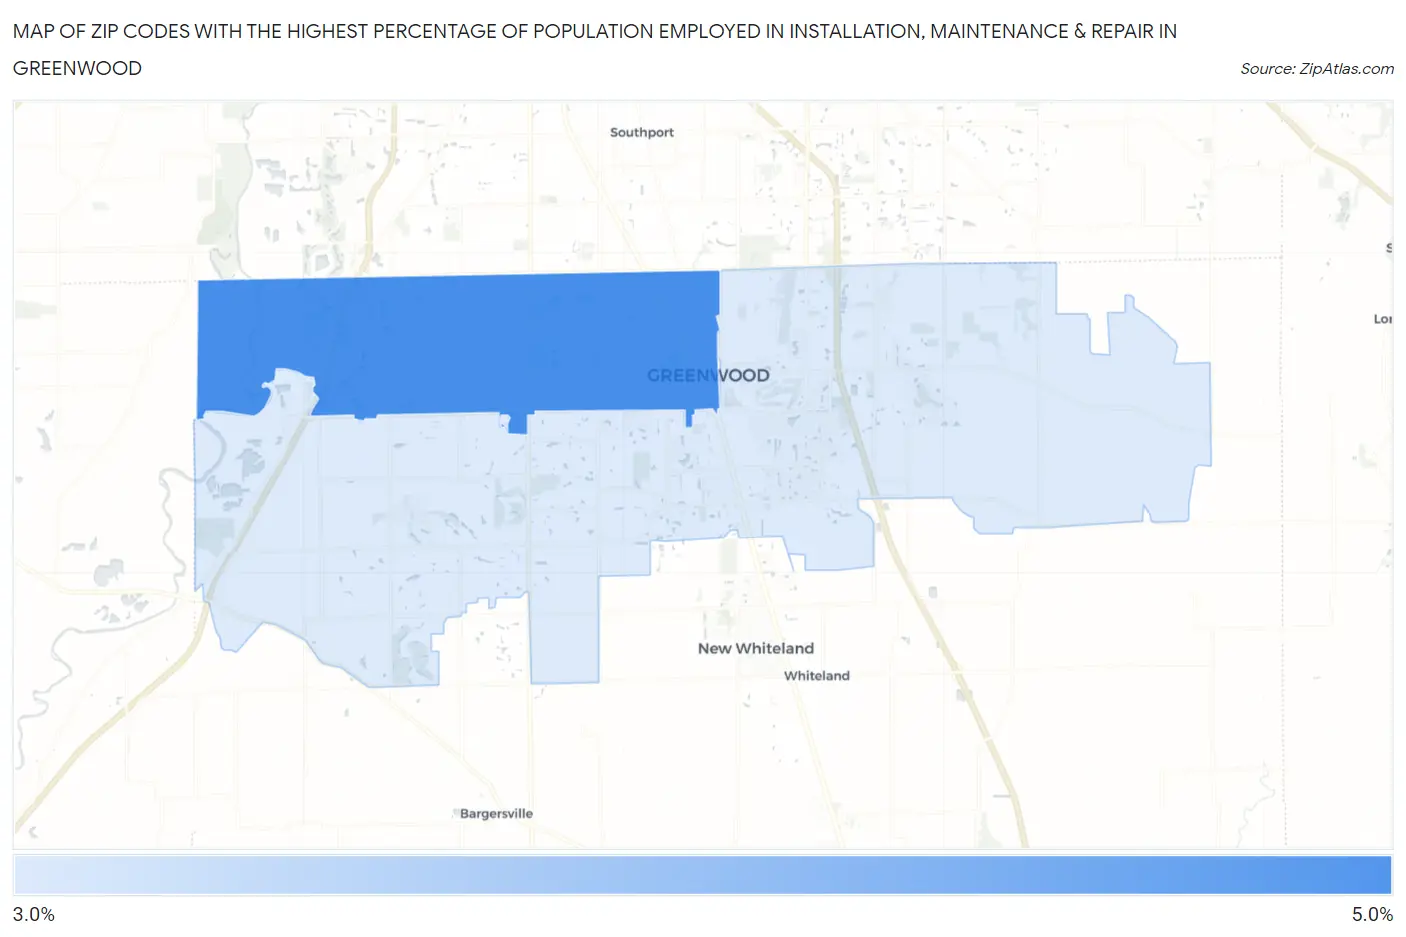
Map of Zip Codes with the Highest Percentage of Population Employed in Installation, Maintenance & Repair in Greenwood
3.1%
4.5%
Zip Codes with the Highest Percentage of Population Employed in Installation, Maintenance & Repair in Greenwood, IN
| Zip Code | % Employed | vs State | vs National | |
| 1. | 46142 | 4.5% | 3.5%(+0.957)#310 | 3.1%(+1.43)#10,420 |
| 2. | 46143 | 3.1% | 3.5%(-0.413)#461 | 3.1%(+0.061)#16,378 |
1
Common Questions
What are the Top Zip Codes with the Highest Percentage of Population Employed in Installation, Maintenance & Repair in Greenwood, IN?
Top Zip Codes with the Highest Percentage of Population Employed in Installation, Maintenance & Repair in Greenwood, IN are:
What zip code has the Highest Percentage of Population Employed in Installation, Maintenance & Repair in Greenwood, IN?
46142 has the Highest Percentage of Population Employed in Installation, Maintenance & Repair in Greenwood, IN with 4.5%.
What is the Percentage of Population Employed in Installation, Maintenance & Repair in Greenwood, IN?
Percentage of Population Employed in Installation, Maintenance & Repair in Greenwood is 4.2%.
What is the Percentage of Population Employed in Installation, Maintenance & Repair in Indiana?
Percentage of Population Employed in Installation, Maintenance & Repair in Indiana is 3.5%.
What is the Percentage of Population Employed in Installation, Maintenance & Repair in the United States?
Percentage of Population Employed in Installation, Maintenance & Repair in the United States is 3.1%.