Zip Codes with the Highest Percentage of Population Employed in Installation, Maintenance & Repair in Mishawaka, IN
RELATED REPORTS & OPTIONS
Installation, Maintenance & Repair
Mishawaka
Compare Zip Codes
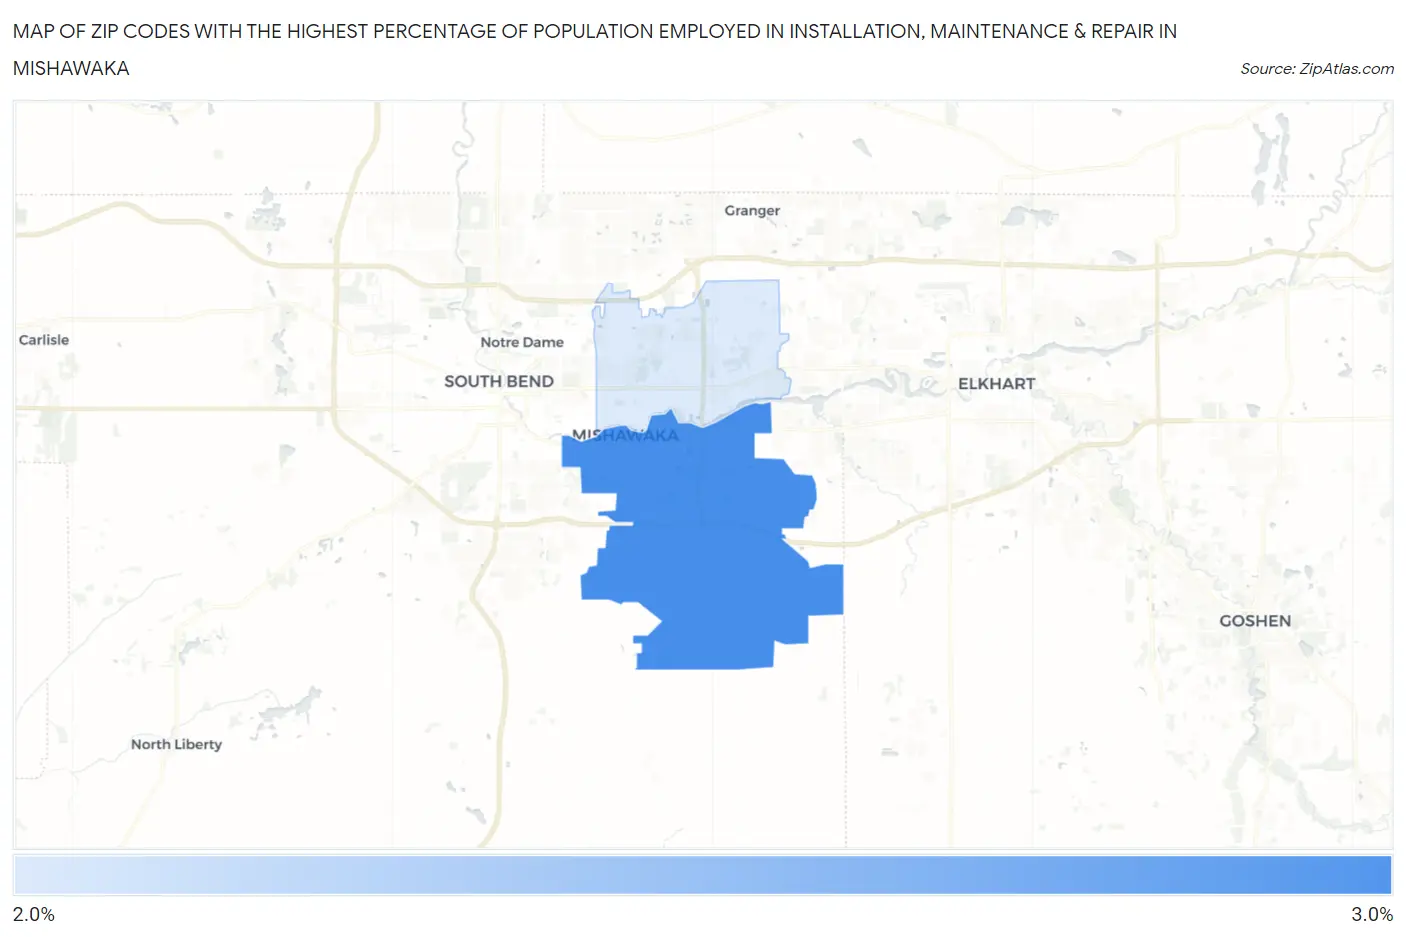
Map of Zip Codes with the Highest Percentage of Population Employed in Installation, Maintenance & Repair in Mishawaka
2.5%
2.7%
Zip Codes with the Highest Percentage of Population Employed in Installation, Maintenance & Repair in Mishawaka, IN
| Zip Code | % Employed | vs State | vs National | |
| 1. | 46544 | 2.7% | 3.5%(-0.860)#525 | 3.1%(-0.385)#18,650 |
| 2. | 46545 | 2.5% | 3.5%(-1.02)#540 | 3.1%(-0.548)#19,450 |
1
Common Questions
What are the Top Zip Codes with the Highest Percentage of Population Employed in Installation, Maintenance & Repair in Mishawaka, IN?
Top Zip Codes with the Highest Percentage of Population Employed in Installation, Maintenance & Repair in Mishawaka, IN are:
What zip code has the Highest Percentage of Population Employed in Installation, Maintenance & Repair in Mishawaka, IN?
46544 has the Highest Percentage of Population Employed in Installation, Maintenance & Repair in Mishawaka, IN with 2.7%.
What is the Percentage of Population Employed in Installation, Maintenance & Repair in Mishawaka, IN?
Percentage of Population Employed in Installation, Maintenance & Repair in Mishawaka is 2.5%.
What is the Percentage of Population Employed in Installation, Maintenance & Repair in Indiana?
Percentage of Population Employed in Installation, Maintenance & Repair in Indiana is 3.5%.
What is the Percentage of Population Employed in Installation, Maintenance & Repair in the United States?
Percentage of Population Employed in Installation, Maintenance & Repair in the United States is 3.1%.