Zip Codes with the Highest Percentage of Population Employed in Installation, Maintenance & Repair in Muncie, IN
RELATED REPORTS & OPTIONS
Installation, Maintenance & Repair
Muncie
Compare Zip Codes
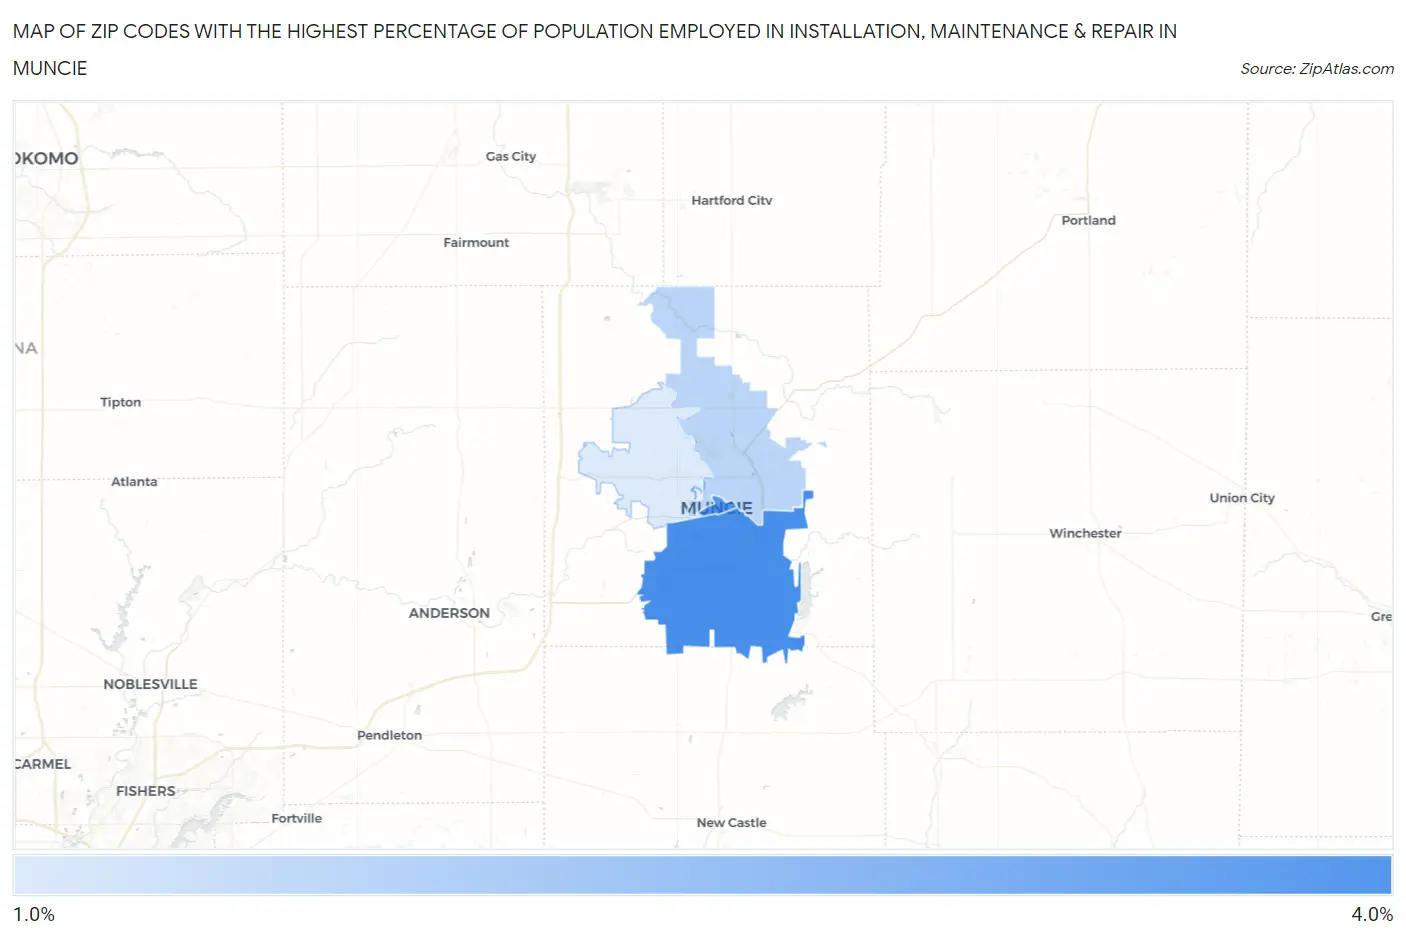
Map of Zip Codes with the Highest Percentage of Population Employed in Installation, Maintenance & Repair in Muncie
1.1%
3.8%
Zip Codes with the Highest Percentage of Population Employed in Installation, Maintenance & Repair in Muncie, IN
| Zip Code | % Employed | vs State | vs National | |
| 1. | 47302 | 3.8% | 3.5%(+0.285)#392 | 3.1%(+0.759)#13,123 |
| 2. | 47305 | 3.6% | 3.5%(+0.076)#417 | 3.1%(+0.551)#14,082 |
| 3. | 47303 | 1.7% | 3.5%(-1.82)#627 | 3.1%(-1.35)#23,266 |
| 4. | 47304 | 1.1% | 3.5%(-2.43)#667 | 3.1%(-1.96)#25,567 |
1
Common Questions
What are the Top 3 Zip Codes with the Highest Percentage of Population Employed in Installation, Maintenance & Repair in Muncie, IN?
Top 3 Zip Codes with the Highest Percentage of Population Employed in Installation, Maintenance & Repair in Muncie, IN are:
What zip code has the Highest Percentage of Population Employed in Installation, Maintenance & Repair in Muncie, IN?
47302 has the Highest Percentage of Population Employed in Installation, Maintenance & Repair in Muncie, IN with 3.8%.
What is the Percentage of Population Employed in Installation, Maintenance & Repair in Muncie, IN?
Percentage of Population Employed in Installation, Maintenance & Repair in Muncie is 1.6%.
What is the Percentage of Population Employed in Installation, Maintenance & Repair in Indiana?
Percentage of Population Employed in Installation, Maintenance & Repair in Indiana is 3.5%.
What is the Percentage of Population Employed in Installation, Maintenance & Repair in the United States?
Percentage of Population Employed in Installation, Maintenance & Repair in the United States is 3.1%.