Zip Codes with the Highest Percentage of Population Employed in Health Diagnosing & Treating in Peoria, IL
RELATED REPORTS & OPTIONS
Health Diagnosing & Treating
Peoria
Compare Zip Codes
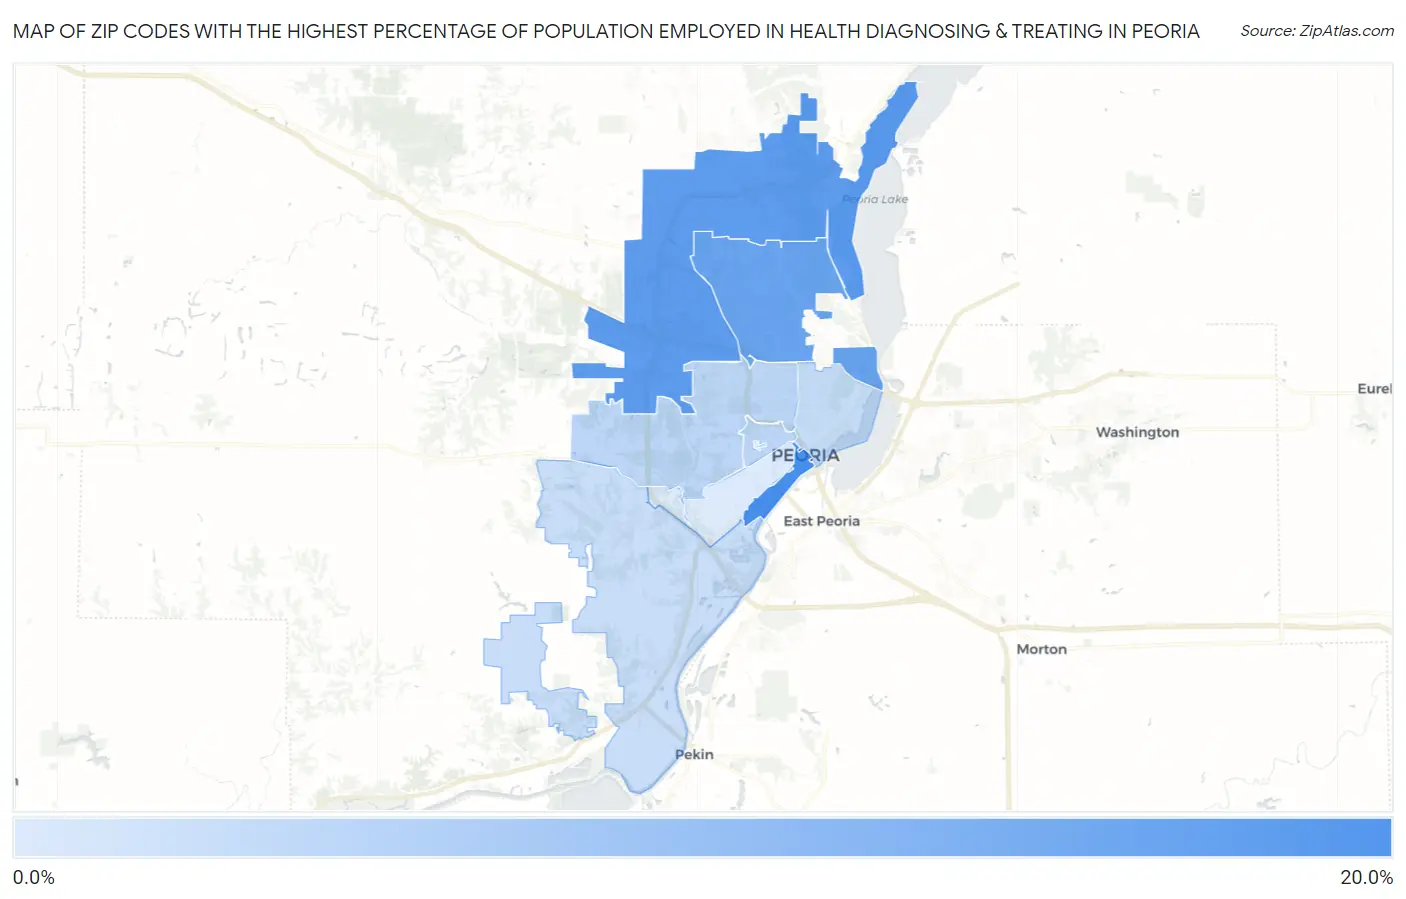
Map of Zip Codes with the Highest Percentage of Population Employed in Health Diagnosing & Treating in Peoria
4.1%
16.5%
Zip Codes with the Highest Percentage of Population Employed in Health Diagnosing & Treating in Peoria, IL
| Zip Code | % Employed | vs State | vs National | |
| 1. | 61602 | 16.5% | 6.2%(+10.2)#39 | 6.2%(+10.2)#887 |
| 2. | 61615 | 14.4% | 6.2%(+8.21)#66 | 6.2%(+8.20)#1,278 |
| 3. | 61614 | 13.4% | 6.2%(+7.16)#84 | 6.2%(+7.15)#1,615 |
| 4. | 61606 | 6.7% | 6.2%(+0.455)#534 | 6.2%(+0.447)#11,332 |
| 5. | 61604 | 6.6% | 6.2%(+0.320)#556 | 6.2%(+0.311)#11,833 |
| 6. | 61603 | 5.8% | 6.2%(-0.395)#673 | 6.2%(-0.404)#14,448 |
| 7. | 61607 | 5.8% | 6.2%(-0.468)#686 | 6.2%(-0.476)#14,729 |
| 8. | 61605 | 4.1% | 6.2%(-2.14)#998 | 6.2%(-2.15)#21,061 |
1
Common Questions
What are the Top 5 Zip Codes with the Highest Percentage of Population Employed in Health Diagnosing & Treating in Peoria, IL?
Top 5 Zip Codes with the Highest Percentage of Population Employed in Health Diagnosing & Treating in Peoria, IL are:
What zip code has the Highest Percentage of Population Employed in Health Diagnosing & Treating in Peoria, IL?
61602 has the Highest Percentage of Population Employed in Health Diagnosing & Treating in Peoria, IL with 16.5%.
What is the Percentage of Population Employed in Health Diagnosing & Treating in Peoria, IL?
Percentage of Population Employed in Health Diagnosing & Treating in Peoria is 9.9%.
What is the Percentage of Population Employed in Health Diagnosing & Treating in Illinois?
Percentage of Population Employed in Health Diagnosing & Treating in Illinois is 6.2%.
What is the Percentage of Population Employed in Health Diagnosing & Treating in the United States?
Percentage of Population Employed in Health Diagnosing & Treating in the United States is 6.2%.