Zip Codes with the Highest Percentage of Population Employed in Legal Services & Support in Peoria, IL
RELATED REPORTS & OPTIONS
Legal Services & Support
Peoria
Compare Zip Codes
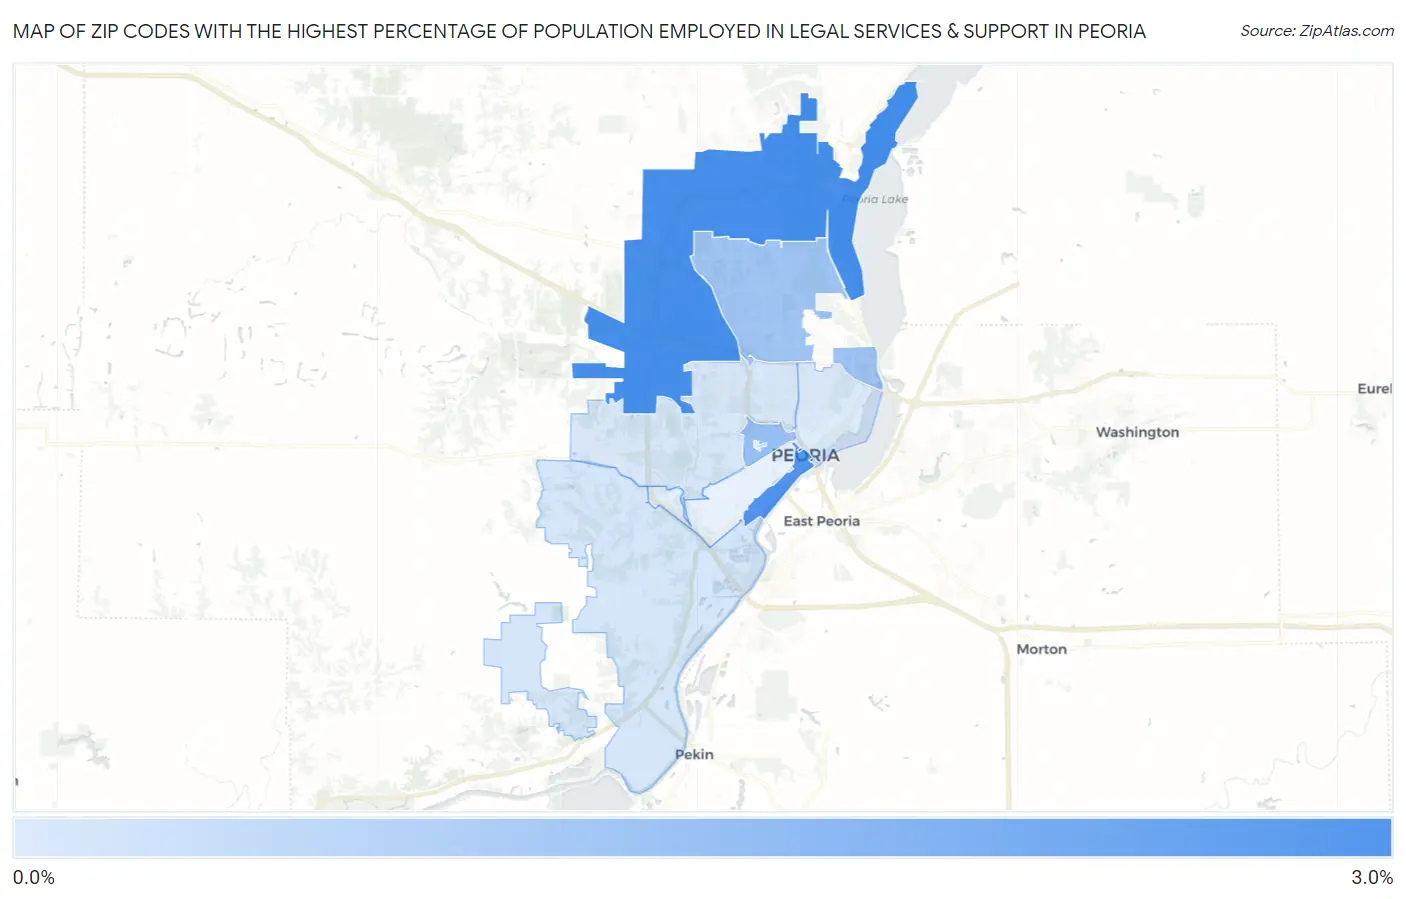
Map of Zip Codes with the Highest Percentage of Population Employed in Legal Services & Support in Peoria
0.35%
2.6%
Zip Codes with the Highest Percentage of Population Employed in Legal Services & Support in Peoria, IL
| Zip Code | % Employed | vs State | vs National | |
| 1. | 61615 | 2.6% | 1.3%(+1.28)#86 | 1.2%(+1.44)#2,308 |
| 2. | 61602 | 2.5% | 1.3%(+1.12)#99 | 1.2%(+1.29)#2,566 |
| 3. | 61606 | 1.4% | 1.3%(+0.054)#200 | 1.2%(+0.219)#5,461 |
| 4. | 61614 | 1.3% | 1.3%(-0.093)#225 | 1.2%(+0.073)#6,167 |
| 5. | 61607 | 0.46% | 1.3%(-0.889)#525 | 1.2%(-0.724)#13,139 |
| 6. | 61604 | 0.41% | 1.3%(-0.936)#547 | 1.2%(-0.770)#13,690 |
| 7. | 61603 | 0.35% | 1.3%(-0.999)#580 | 1.2%(-0.834)#14,459 |
1
Common Questions
What are the Top 5 Zip Codes with the Highest Percentage of Population Employed in Legal Services & Support in Peoria, IL?
Top 5 Zip Codes with the Highest Percentage of Population Employed in Legal Services & Support in Peoria, IL are:
What zip code has the Highest Percentage of Population Employed in Legal Services & Support in Peoria, IL?
61615 has the Highest Percentage of Population Employed in Legal Services & Support in Peoria, IL with 2.6%.
What is the Percentage of Population Employed in Legal Services & Support in Peoria, IL?
Percentage of Population Employed in Legal Services & Support in Peoria is 1.1%.
What is the Percentage of Population Employed in Legal Services & Support in Illinois?
Percentage of Population Employed in Legal Services & Support in Illinois is 1.3%.
What is the Percentage of Population Employed in Legal Services & Support in the United States?
Percentage of Population Employed in Legal Services & Support in the United States is 1.2%.