Turkish vs Belgian Male Disability
COMPARE
Turkish
Belgian
Male Disability
Male Disability Comparison
Turks
Belgians
10.3%
MALE DISABILITY
99.7/ 100
METRIC RATING
45th/ 347
METRIC RANK
12.1%
MALE DISABILITY
0.3/ 100
METRIC RATING
259th/ 347
METRIC RANK
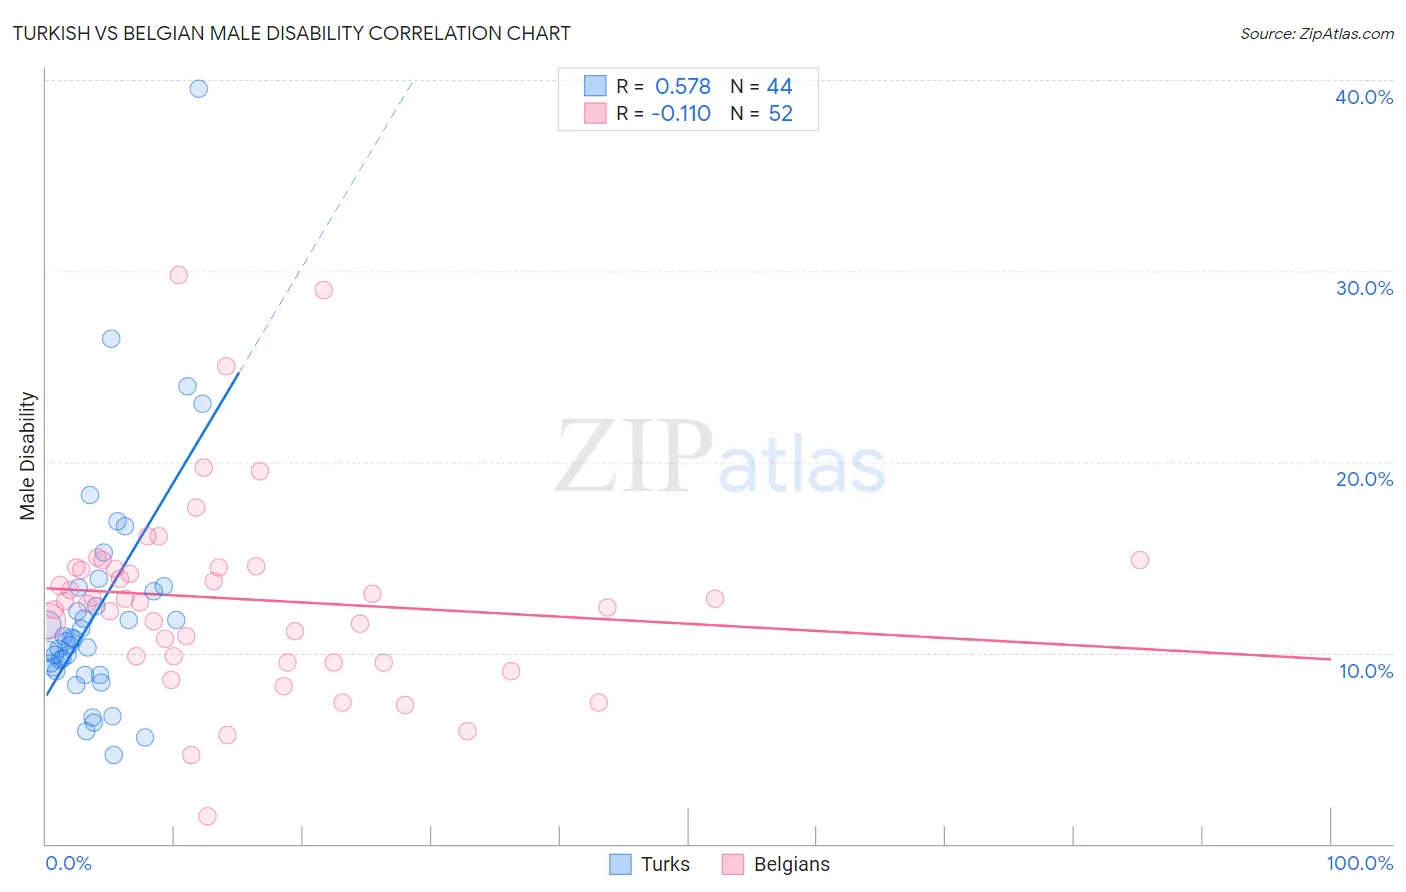
Turkish vs Belgian Male Disability Correlation Chart
The statistical analysis conducted on geographies consisting of 271,851,914 people shows a substantial positive correlation between the proportion of Turks and percentage of males with a disability in the United States with a correlation coefficient (R) of 0.578 and weighted average of 10.3%. Similarly, the statistical analysis conducted on geographies consisting of 355,990,096 people shows a poor negative correlation between the proportion of Belgians and percentage of males with a disability in the United States with a correlation coefficient (R) of -0.110 and weighted average of 12.1%, a difference of 17.6%.
Male Disability Correlation Summary
| Measurement | Turkish | Belgian |
| Minimum | 4.6% | 1.4% |
| Maximum | 39.6% | 29.8% |
| Range | 34.9% | 28.3% |
| Mean | 12.2% | 12.8% |
| Median | 10.7% | 12.7% |
| Interquartile 25% (IQ1) | 9.1% | 9.7% |
| Interquartile 75% (IQ3) | 13.3% | 14.5% |
| Interquartile Range (IQR) | 4.2% | 4.8% |
| Standard Deviation (Sample) | 6.2% | 5.2% |
| Standard Deviation (Population) | 6.2% | 5.1% |
Similar Demographics by Male Disability
Demographics Similar to Turks by Male Disability
In terms of male disability, the demographic groups most similar to Turks are Immigrants from El Salvador (10.3%, a difference of 0.0%), Immigrants from Bangladesh (10.3%, a difference of 0.080%), Cambodian (10.3%, a difference of 0.080%), Mongolian (10.3%, a difference of 0.10%), and Immigrants from Peru (10.3%, a difference of 0.12%).
| Demographics | Rating | Rank | Male Disability |
| Immigrants | Kuwait | 99.8 /100 | #38 | Exceptional 10.2% |
| Afghans | 99.8 /100 | #39 | Exceptional 10.2% |
| Immigrants | Nepal | 99.8 /100 | #40 | Exceptional 10.3% |
| Taiwanese | 99.8 /100 | #41 | Exceptional 10.3% |
| Mongolians | 99.7 /100 | #42 | Exceptional 10.3% |
| Immigrants | Bangladesh | 99.7 /100 | #43 | Exceptional 10.3% |
| Immigrants | El Salvador | 99.7 /100 | #44 | Exceptional 10.3% |
| Turks | 99.7 /100 | #45 | Exceptional 10.3% |
| Cambodians | 99.7 /100 | #46 | Exceptional 10.3% |
| Immigrants | Peru | 99.7 /100 | #47 | Exceptional 10.3% |
| Israelis | 99.7 /100 | #48 | Exceptional 10.3% |
| Immigrants | Spain | 99.7 /100 | #49 | Exceptional 10.3% |
| South Americans | 99.6 /100 | #50 | Exceptional 10.3% |
| Salvadorans | 99.6 /100 | #51 | Exceptional 10.4% |
| Immigrants | Saudi Arabia | 99.6 /100 | #52 | Exceptional 10.4% |
Demographics Similar to Belgians by Male Disability
In terms of male disability, the demographic groups most similar to Belgians are Basque (12.1%, a difference of 0.040%), Swedish (12.1%, a difference of 0.070%), Swiss (12.1%, a difference of 0.24%), European (12.1%, a difference of 0.24%), and Slavic (12.2%, a difference of 0.43%).
| Demographics | Rating | Rank | Male Disability |
| Slovenes | 0.5 /100 | #252 | Tragic 12.0% |
| Guamanians/Chamorros | 0.5 /100 | #253 | Tragic 12.0% |
| British | 0.4 /100 | #254 | Tragic 12.1% |
| Chinese | 0.4 /100 | #255 | Tragic 12.1% |
| Swiss | 0.3 /100 | #256 | Tragic 12.1% |
| Europeans | 0.3 /100 | #257 | Tragic 12.1% |
| Basques | 0.3 /100 | #258 | Tragic 12.1% |
| Belgians | 0.3 /100 | #259 | Tragic 12.1% |
| Swedes | 0.3 /100 | #260 | Tragic 12.1% |
| Slavs | 0.2 /100 | #261 | Tragic 12.2% |
| Norwegians | 0.2 /100 | #262 | Tragic 12.2% |
| Canadians | 0.2 /100 | #263 | Tragic 12.2% |
| Nepalese | 0.2 /100 | #264 | Tragic 12.2% |
| Immigrants | Portugal | 0.1 /100 | #265 | Tragic 12.3% |
| Hawaiians | 0.1 /100 | #266 | Tragic 12.3% |