Turkish vs Native Hawaiian Male Disability
COMPARE
Turkish
Native Hawaiian
Male Disability
Male Disability Comparison
Turks
Native Hawaiians
10.3%
MALE DISABILITY
99.7/ 100
METRIC RATING
45th/ 347
METRIC RANK
12.5%
MALE DISABILITY
0.0/ 100
METRIC RATING
273rd/ 347
METRIC RANK
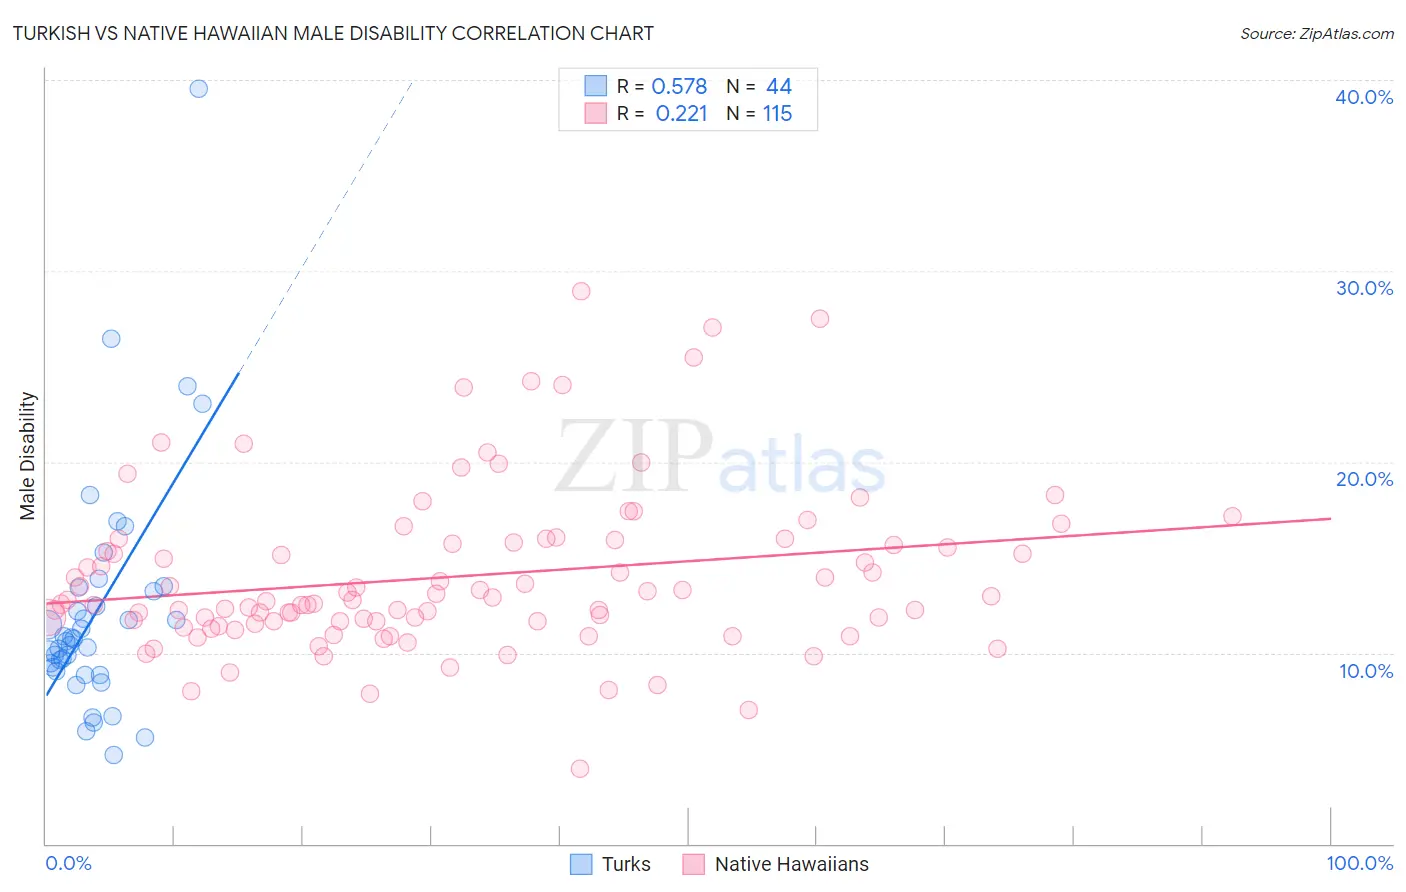
Turkish vs Native Hawaiian Male Disability Correlation Chart
The statistical analysis conducted on geographies consisting of 271,851,914 people shows a substantial positive correlation between the proportion of Turks and percentage of males with a disability in the United States with a correlation coefficient (R) of 0.578 and weighted average of 10.3%. Similarly, the statistical analysis conducted on geographies consisting of 332,022,677 people shows a weak positive correlation between the proportion of Native Hawaiians and percentage of males with a disability in the United States with a correlation coefficient (R) of 0.221 and weighted average of 12.5%, a difference of 21.1%.
Male Disability Correlation Summary
| Measurement | Turkish | Native Hawaiian |
| Minimum | 4.6% | 4.0% |
| Maximum | 39.6% | 28.9% |
| Range | 34.9% | 25.0% |
| Mean | 12.2% | 14.0% |
| Median | 10.7% | 12.8% |
| Interquartile 25% (IQ1) | 9.1% | 11.6% |
| Interquartile 75% (IQ3) | 13.3% | 15.8% |
| Interquartile Range (IQR) | 4.2% | 4.2% |
| Standard Deviation (Sample) | 6.2% | 4.3% |
| Standard Deviation (Population) | 6.2% | 4.3% |
Similar Demographics by Male Disability
Demographics Similar to Turks by Male Disability
In terms of male disability, the demographic groups most similar to Turks are Immigrants from El Salvador (10.3%, a difference of 0.0%), Immigrants from Bangladesh (10.3%, a difference of 0.080%), Cambodian (10.3%, a difference of 0.080%), Mongolian (10.3%, a difference of 0.10%), and Immigrants from Peru (10.3%, a difference of 0.12%).
| Demographics | Rating | Rank | Male Disability |
| Immigrants | Kuwait | 99.8 /100 | #38 | Exceptional 10.2% |
| Afghans | 99.8 /100 | #39 | Exceptional 10.2% |
| Immigrants | Nepal | 99.8 /100 | #40 | Exceptional 10.3% |
| Taiwanese | 99.8 /100 | #41 | Exceptional 10.3% |
| Mongolians | 99.7 /100 | #42 | Exceptional 10.3% |
| Immigrants | Bangladesh | 99.7 /100 | #43 | Exceptional 10.3% |
| Immigrants | El Salvador | 99.7 /100 | #44 | Exceptional 10.3% |
| Turks | 99.7 /100 | #45 | Exceptional 10.3% |
| Cambodians | 99.7 /100 | #46 | Exceptional 10.3% |
| Immigrants | Peru | 99.7 /100 | #47 | Exceptional 10.3% |
| Israelis | 99.7 /100 | #48 | Exceptional 10.3% |
| Immigrants | Spain | 99.7 /100 | #49 | Exceptional 10.3% |
| South Americans | 99.6 /100 | #50 | Exceptional 10.3% |
| Salvadorans | 99.6 /100 | #51 | Exceptional 10.4% |
| Immigrants | Saudi Arabia | 99.6 /100 | #52 | Exceptional 10.4% |
Demographics Similar to Native Hawaiians by Male Disability
In terms of male disability, the demographic groups most similar to Native Hawaiians are Hmong (12.5%, a difference of 0.060%), Hopi (12.5%, a difference of 0.33%), Fijian (12.6%, a difference of 0.68%), African (12.6%, a difference of 0.74%), and Finnish (12.6%, a difference of 1.1%).
| Demographics | Rating | Rank | Male Disability |
| Hawaiians | 0.1 /100 | #266 | Tragic 12.3% |
| Immigrants | Germany | 0.1 /100 | #267 | Tragic 12.3% |
| Portuguese | 0.1 /100 | #268 | Tragic 12.3% |
| Czechoslovakians | 0.1 /100 | #269 | Tragic 12.3% |
| Spaniards | 0.1 /100 | #270 | Tragic 12.3% |
| Scandinavians | 0.1 /100 | #271 | Tragic 12.3% |
| Hmong | 0.0 /100 | #272 | Tragic 12.5% |
| Native Hawaiians | 0.0 /100 | #273 | Tragic 12.5% |
| Hopi | 0.0 /100 | #274 | Tragic 12.5% |
| Fijians | 0.0 /100 | #275 | Tragic 12.6% |
| Africans | 0.0 /100 | #276 | Tragic 12.6% |
| Finns | 0.0 /100 | #277 | Tragic 12.6% |
| Central American Indians | 0.0 /100 | #278 | Tragic 12.7% |
| Slovaks | 0.0 /100 | #279 | Tragic 12.7% |
| Dutch | 0.0 /100 | #280 | Tragic 12.7% |