Turkish vs Somali Male Disability
COMPARE
Turkish
Somali
Male Disability
Male Disability Comparison
Turks
Somalis
10.3%
MALE DISABILITY
99.7/ 100
METRIC RATING
45th/ 347
METRIC RANK
11.4%
MALE DISABILITY
18.2/ 100
METRIC RATING
197th/ 347
METRIC RANK
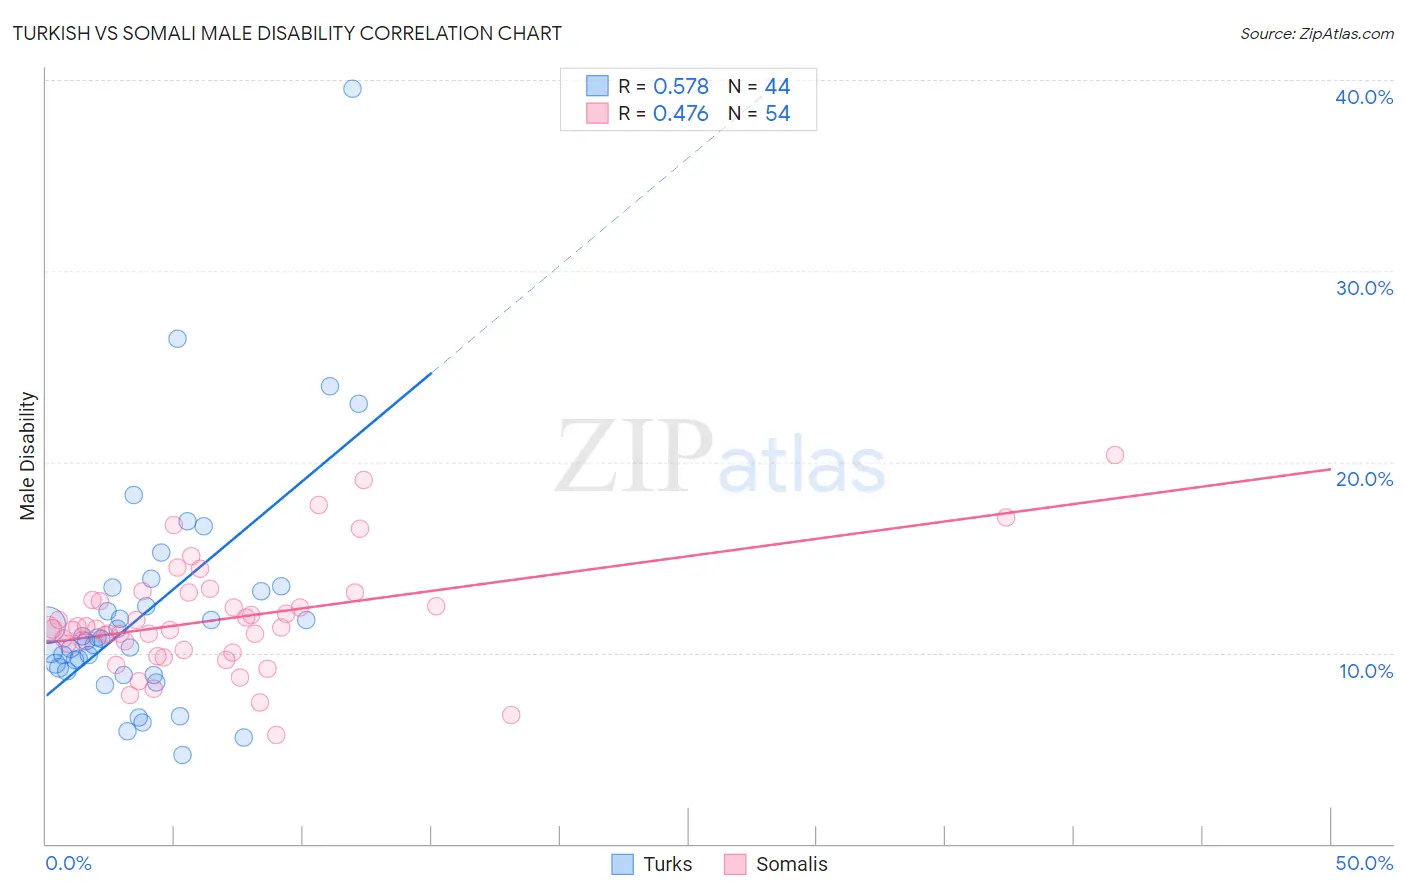
Turkish vs Somali Male Disability Correlation Chart
The statistical analysis conducted on geographies consisting of 271,851,914 people shows a substantial positive correlation between the proportion of Turks and percentage of males with a disability in the United States with a correlation coefficient (R) of 0.578 and weighted average of 10.3%. Similarly, the statistical analysis conducted on geographies consisting of 99,314,989 people shows a moderate positive correlation between the proportion of Somalis and percentage of males with a disability in the United States with a correlation coefficient (R) of 0.476 and weighted average of 11.4%, a difference of 11.1%.
Male Disability Correlation Summary
| Measurement | Turkish | Somali |
| Minimum | 4.6% | 5.7% |
| Maximum | 39.6% | 20.4% |
| Range | 34.9% | 14.6% |
| Mean | 12.2% | 11.8% |
| Median | 10.7% | 11.2% |
| Interquartile 25% (IQ1) | 9.1% | 10.1% |
| Interquartile 75% (IQ3) | 13.3% | 12.7% |
| Interquartile Range (IQR) | 4.2% | 2.6% |
| Standard Deviation (Sample) | 6.2% | 2.9% |
| Standard Deviation (Population) | 6.2% | 2.9% |
Similar Demographics by Male Disability
Demographics Similar to Turks by Male Disability
In terms of male disability, the demographic groups most similar to Turks are Immigrants from El Salvador (10.3%, a difference of 0.0%), Immigrants from Bangladesh (10.3%, a difference of 0.080%), Cambodian (10.3%, a difference of 0.080%), Mongolian (10.3%, a difference of 0.10%), and Immigrants from Peru (10.3%, a difference of 0.12%).
| Demographics | Rating | Rank | Male Disability |
| Immigrants | Kuwait | 99.8 /100 | #38 | Exceptional 10.2% |
| Afghans | 99.8 /100 | #39 | Exceptional 10.2% |
| Immigrants | Nepal | 99.8 /100 | #40 | Exceptional 10.3% |
| Taiwanese | 99.8 /100 | #41 | Exceptional 10.3% |
| Mongolians | 99.7 /100 | #42 | Exceptional 10.3% |
| Immigrants | Bangladesh | 99.7 /100 | #43 | Exceptional 10.3% |
| Immigrants | El Salvador | 99.7 /100 | #44 | Exceptional 10.3% |
| Turks | 99.7 /100 | #45 | Exceptional 10.3% |
| Cambodians | 99.7 /100 | #46 | Exceptional 10.3% |
| Immigrants | Peru | 99.7 /100 | #47 | Exceptional 10.3% |
| Israelis | 99.7 /100 | #48 | Exceptional 10.3% |
| Immigrants | Spain | 99.7 /100 | #49 | Exceptional 10.3% |
| South Americans | 99.6 /100 | #50 | Exceptional 10.3% |
| Salvadorans | 99.6 /100 | #51 | Exceptional 10.4% |
| Immigrants | Saudi Arabia | 99.6 /100 | #52 | Exceptional 10.4% |
Demographics Similar to Somalis by Male Disability
In terms of male disability, the demographic groups most similar to Somalis are West Indian (11.4%, a difference of 0.020%), Immigrants from Jamaica (11.5%, a difference of 0.18%), Immigrants from Oceania (11.4%, a difference of 0.23%), Belizean (11.4%, a difference of 0.26%), and Lebanese (11.5%, a difference of 0.27%).
| Demographics | Rating | Rank | Male Disability |
| Immigrants | Bosnia and Herzegovina | 25.4 /100 | #190 | Fair 11.4% |
| Senegalese | 23.2 /100 | #191 | Fair 11.4% |
| Assyrians/Chaldeans/Syriacs | 23.2 /100 | #192 | Fair 11.4% |
| Greeks | 22.2 /100 | #193 | Fair 11.4% |
| Belizeans | 21.2 /100 | #194 | Fair 11.4% |
| Immigrants | Oceania | 20.9 /100 | #195 | Fair 11.4% |
| West Indians | 18.4 /100 | #196 | Poor 11.4% |
| Somalis | 18.2 /100 | #197 | Poor 11.4% |
| Immigrants | Jamaica | 16.3 /100 | #198 | Poor 11.5% |
| Lebanese | 15.4 /100 | #199 | Poor 11.5% |
| Immigrants | Iraq | 13.0 /100 | #200 | Poor 11.5% |
| Immigrants | Panama | 13.0 /100 | #201 | Poor 11.5% |
| Immigrants | Mexico | 12.6 /100 | #202 | Poor 11.5% |
| Jamaicans | 10.9 /100 | #203 | Poor 11.5% |
| Immigrants | Cambodia | 10.8 /100 | #204 | Poor 11.5% |