Turkish vs Immigrants from Scotland Male Disability
COMPARE
Turkish
Immigrants from Scotland
Male Disability
Male Disability Comparison
Turks
Immigrants from Scotland
10.3%
MALE DISABILITY
99.7/ 100
METRIC RATING
45th/ 347
METRIC RANK
11.6%
MALE DISABILITY
8.2/ 100
METRIC RATING
212th/ 347
METRIC RANK
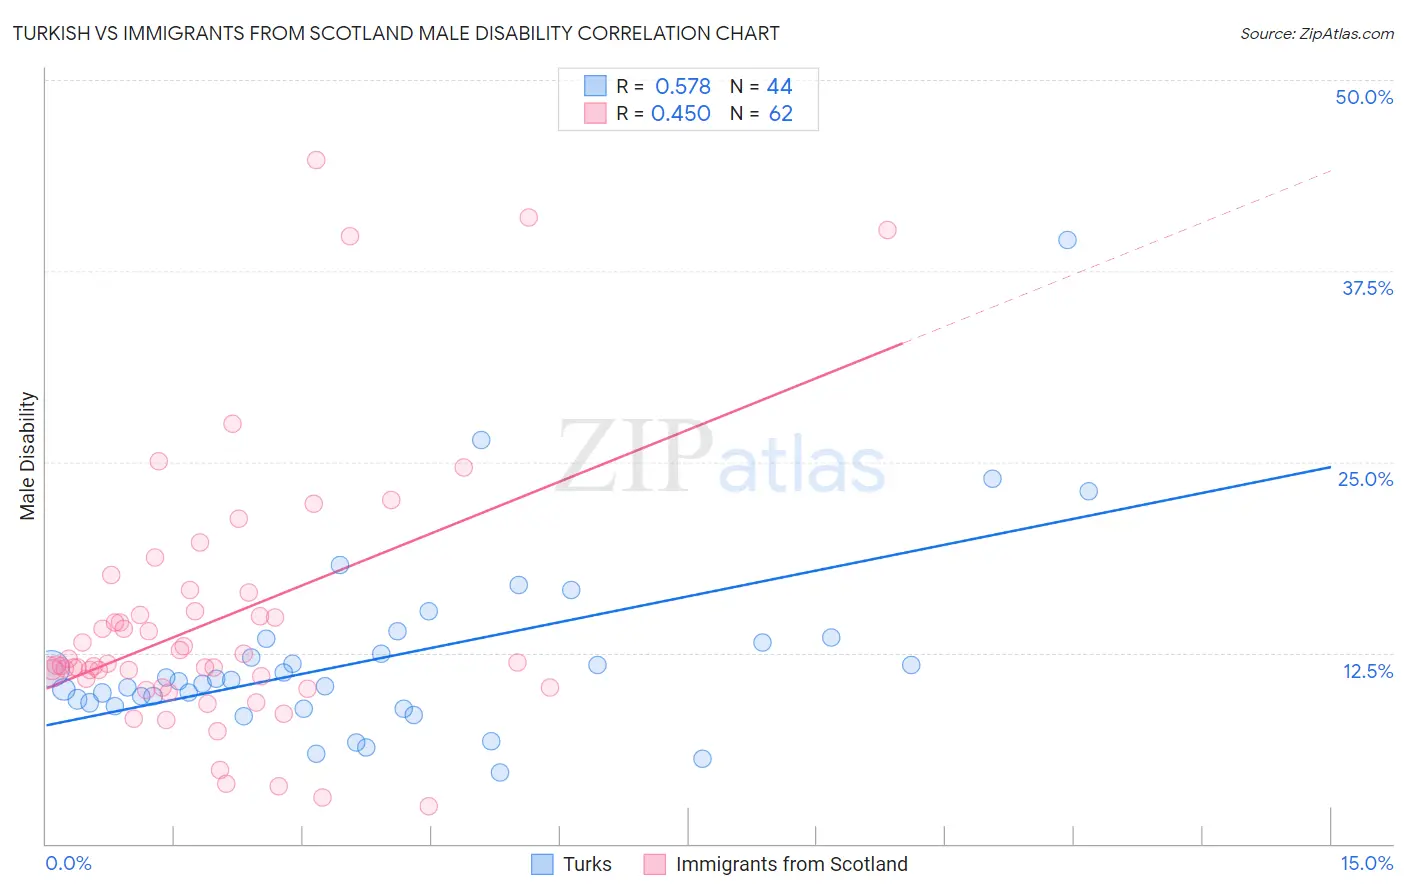
Turkish vs Immigrants from Scotland Male Disability Correlation Chart
The statistical analysis conducted on geographies consisting of 271,851,914 people shows a substantial positive correlation between the proportion of Turks and percentage of males with a disability in the United States with a correlation coefficient (R) of 0.578 and weighted average of 10.3%. Similarly, the statistical analysis conducted on geographies consisting of 196,397,842 people shows a moderate positive correlation between the proportion of Immigrants from Scotland and percentage of males with a disability in the United States with a correlation coefficient (R) of 0.450 and weighted average of 11.6%, a difference of 12.5%.
Male Disability Correlation Summary
| Measurement | Turkish | Immigrants from Scotland |
| Minimum | 4.6% | 2.5% |
| Maximum | 39.6% | 44.8% |
| Range | 34.9% | 42.3% |
| Mean | 12.2% | 14.6% |
| Median | 10.7% | 11.7% |
| Interquartile 25% (IQ1) | 9.1% | 10.3% |
| Interquartile 75% (IQ3) | 13.3% | 15.2% |
| Interquartile Range (IQR) | 4.2% | 5.0% |
| Standard Deviation (Sample) | 6.2% | 8.7% |
| Standard Deviation (Population) | 6.2% | 8.6% |
Similar Demographics by Male Disability
Demographics Similar to Turks by Male Disability
In terms of male disability, the demographic groups most similar to Turks are Immigrants from El Salvador (10.3%, a difference of 0.0%), Immigrants from Bangladesh (10.3%, a difference of 0.080%), Cambodian (10.3%, a difference of 0.080%), Mongolian (10.3%, a difference of 0.10%), and Immigrants from Peru (10.3%, a difference of 0.12%).
| Demographics | Rating | Rank | Male Disability |
| Immigrants | Kuwait | 99.8 /100 | #38 | Exceptional 10.2% |
| Afghans | 99.8 /100 | #39 | Exceptional 10.2% |
| Immigrants | Nepal | 99.8 /100 | #40 | Exceptional 10.3% |
| Taiwanese | 99.8 /100 | #41 | Exceptional 10.3% |
| Mongolians | 99.7 /100 | #42 | Exceptional 10.3% |
| Immigrants | Bangladesh | 99.7 /100 | #43 | Exceptional 10.3% |
| Immigrants | El Salvador | 99.7 /100 | #44 | Exceptional 10.3% |
| Turks | 99.7 /100 | #45 | Exceptional 10.3% |
| Cambodians | 99.7 /100 | #46 | Exceptional 10.3% |
| Immigrants | Peru | 99.7 /100 | #47 | Exceptional 10.3% |
| Israelis | 99.7 /100 | #48 | Exceptional 10.3% |
| Immigrants | Spain | 99.7 /100 | #49 | Exceptional 10.3% |
| South Americans | 99.6 /100 | #50 | Exceptional 10.3% |
| Salvadorans | 99.6 /100 | #51 | Exceptional 10.4% |
| Immigrants | Saudi Arabia | 99.6 /100 | #52 | Exceptional 10.4% |
Demographics Similar to Immigrants from Scotland by Male Disability
In terms of male disability, the demographic groups most similar to Immigrants from Scotland are Immigrants from Thailand (11.6%, a difference of 0.030%), Mexican American Indian (11.6%, a difference of 0.080%), Ute (11.6%, a difference of 0.20%), Spanish American Indian (11.6%, a difference of 0.30%), and Icelander (11.6%, a difference of 0.31%).
| Demographics | Rating | Rank | Male Disability |
| Serbians | 10.7 /100 | #205 | Poor 11.5% |
| Ukrainians | 10.6 /100 | #206 | Poor 11.5% |
| Immigrants | Somalia | 10.4 /100 | #207 | Poor 11.5% |
| Icelanders | 10.1 /100 | #208 | Poor 11.6% |
| Spanish American Indians | 10.1 /100 | #209 | Poor 11.6% |
| Ute | 9.4 /100 | #210 | Tragic 11.6% |
| Immigrants | Thailand | 8.4 /100 | #211 | Tragic 11.6% |
| Immigrants | Scotland | 8.2 /100 | #212 | Tragic 11.6% |
| Mexican American Indians | 7.8 /100 | #213 | Tragic 11.6% |
| Lithuanians | 6.6 /100 | #214 | Tragic 11.6% |
| Indonesians | 5.9 /100 | #215 | Tragic 11.6% |
| Immigrants | Dominican Republic | 4.9 /100 | #216 | Tragic 11.7% |
| Immigrants | Dominica | 4.6 /100 | #217 | Tragic 11.7% |
| Immigrants | England | 4.0 /100 | #218 | Tragic 11.7% |
| Panamanians | 3.8 /100 | #219 | Tragic 11.7% |