Immigrants from Ukraine vs Bahamian Disability
COMPARE
Immigrants from Ukraine
Bahamian
Disability
Disability Comparison
Immigrants from Ukraine
Bahamians
11.5%
DISABILITY
77.6/ 100
METRIC RATING
147th/ 347
METRIC RANK
12.2%
DISABILITY
2.3/ 100
METRIC RATING
233rd/ 347
METRIC RANK
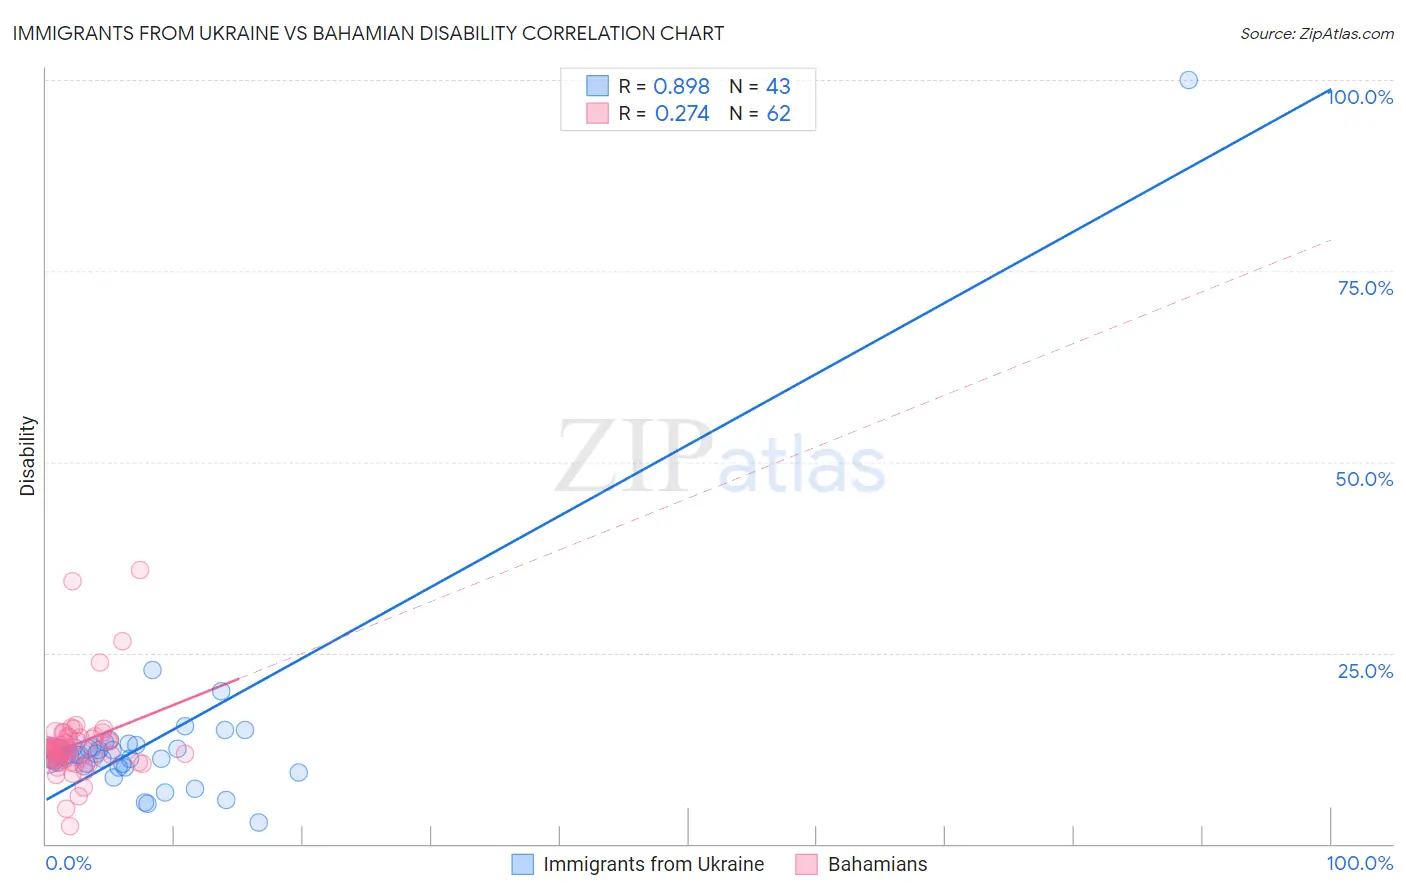
Immigrants from Ukraine vs Bahamian Disability Correlation Chart
The statistical analysis conducted on geographies consisting of 289,688,276 people shows a very strong positive correlation between the proportion of Immigrants from Ukraine and percentage of population with a disability in the United States with a correlation coefficient (R) of 0.898 and weighted average of 11.5%. Similarly, the statistical analysis conducted on geographies consisting of 112,688,060 people shows a weak positive correlation between the proportion of Bahamians and percentage of population with a disability in the United States with a correlation coefficient (R) of 0.274 and weighted average of 12.2%, a difference of 5.6%.
Disability Correlation Summary
| Measurement | Immigrants from Ukraine | Bahamian |
| Minimum | 2.9% | 2.3% |
| Maximum | 100.0% | 35.8% |
| Range | 97.1% | 33.4% |
| Mean | 13.4% | 13.0% |
| Median | 11.7% | 12.4% |
| Interquartile 25% (IQ1) | 10.2% | 11.2% |
| Interquartile 75% (IQ3) | 12.7% | 13.9% |
| Interquartile Range (IQR) | 2.5% | 2.7% |
| Standard Deviation (Sample) | 14.0% | 5.3% |
| Standard Deviation (Population) | 13.8% | 5.2% |
Similar Demographics by Disability
Demographics Similar to Immigrants from Ukraine by Disability
In terms of disability, the demographic groups most similar to Immigrants from Ukraine are Sudanese (11.5%, a difference of 0.030%), Immigrants from Hungary (11.5%, a difference of 0.090%), Nigerian (11.5%, a difference of 0.26%), Immigrants from Norway (11.6%, a difference of 0.27%), and Romanian (11.6%, a difference of 0.30%).
| Demographics | Rating | Rank | Disability |
| Russians | 86.8 /100 | #140 | Excellent 11.5% |
| Immigrants | Grenada | 86.1 /100 | #141 | Excellent 11.5% |
| Immigrants | Sudan | 85.3 /100 | #142 | Excellent 11.5% |
| Moroccans | 83.3 /100 | #143 | Excellent 11.5% |
| Australians | 82.5 /100 | #144 | Excellent 11.5% |
| Nigerians | 81.3 /100 | #145 | Excellent 11.5% |
| Immigrants | Hungary | 79.0 /100 | #146 | Good 11.5% |
| Immigrants | Ukraine | 77.6 /100 | #147 | Good 11.5% |
| Sudanese | 77.1 /100 | #148 | Good 11.5% |
| Immigrants | Norway | 73.2 /100 | #149 | Good 11.6% |
| Romanians | 72.7 /100 | #150 | Good 11.6% |
| Immigrants | Kenya | 72.1 /100 | #151 | Good 11.6% |
| Immigrants | Moldova | 72.0 /100 | #152 | Good 11.6% |
| Immigrants | Ghana | 71.2 /100 | #153 | Good 11.6% |
| Immigrants | Guatemala | 71.1 /100 | #154 | Good 11.6% |
Demographics Similar to Bahamians by Disability
In terms of disability, the demographic groups most similar to Bahamians are Japanese (12.2%, a difference of 0.030%), Yup'ik (12.2%, a difference of 0.070%), Italian (12.2%, a difference of 0.090%), Malaysian (12.2%, a difference of 0.10%), and Samoan (12.2%, a difference of 0.13%).
| Demographics | Rating | Rank | Disability |
| Jamaicans | 3.3 /100 | #226 | Tragic 12.1% |
| Alsatians | 3.3 /100 | #227 | Tragic 12.1% |
| West Indians | 2.9 /100 | #228 | Tragic 12.2% |
| Inupiat | 2.8 /100 | #229 | Tragic 12.2% |
| Samoans | 2.6 /100 | #230 | Tragic 12.2% |
| Malaysians | 2.5 /100 | #231 | Tragic 12.2% |
| Italians | 2.5 /100 | #232 | Tragic 12.2% |
| Bahamians | 2.3 /100 | #233 | Tragic 12.2% |
| Japanese | 2.3 /100 | #234 | Tragic 12.2% |
| Yup'ik | 2.2 /100 | #235 | Tragic 12.2% |
| Chinese | 2.0 /100 | #236 | Tragic 12.2% |
| Immigrants | Congo | 1.9 /100 | #237 | Tragic 12.2% |
| Norwegians | 1.9 /100 | #238 | Tragic 12.2% |
| Swedes | 1.8 /100 | #239 | Tragic 12.2% |
| Hungarians | 1.7 /100 | #240 | Tragic 12.2% |