Barbadian vs Jamaican Disability
COMPARE
Barbadian
Jamaican
Disability
Disability Comparison
Barbadians
Jamaicans
11.9%
DISABILITY
15.8/ 100
METRIC RATING
195th/ 347
METRIC RANK
12.1%
DISABILITY
3.3/ 100
METRIC RATING
226th/ 347
METRIC RANK
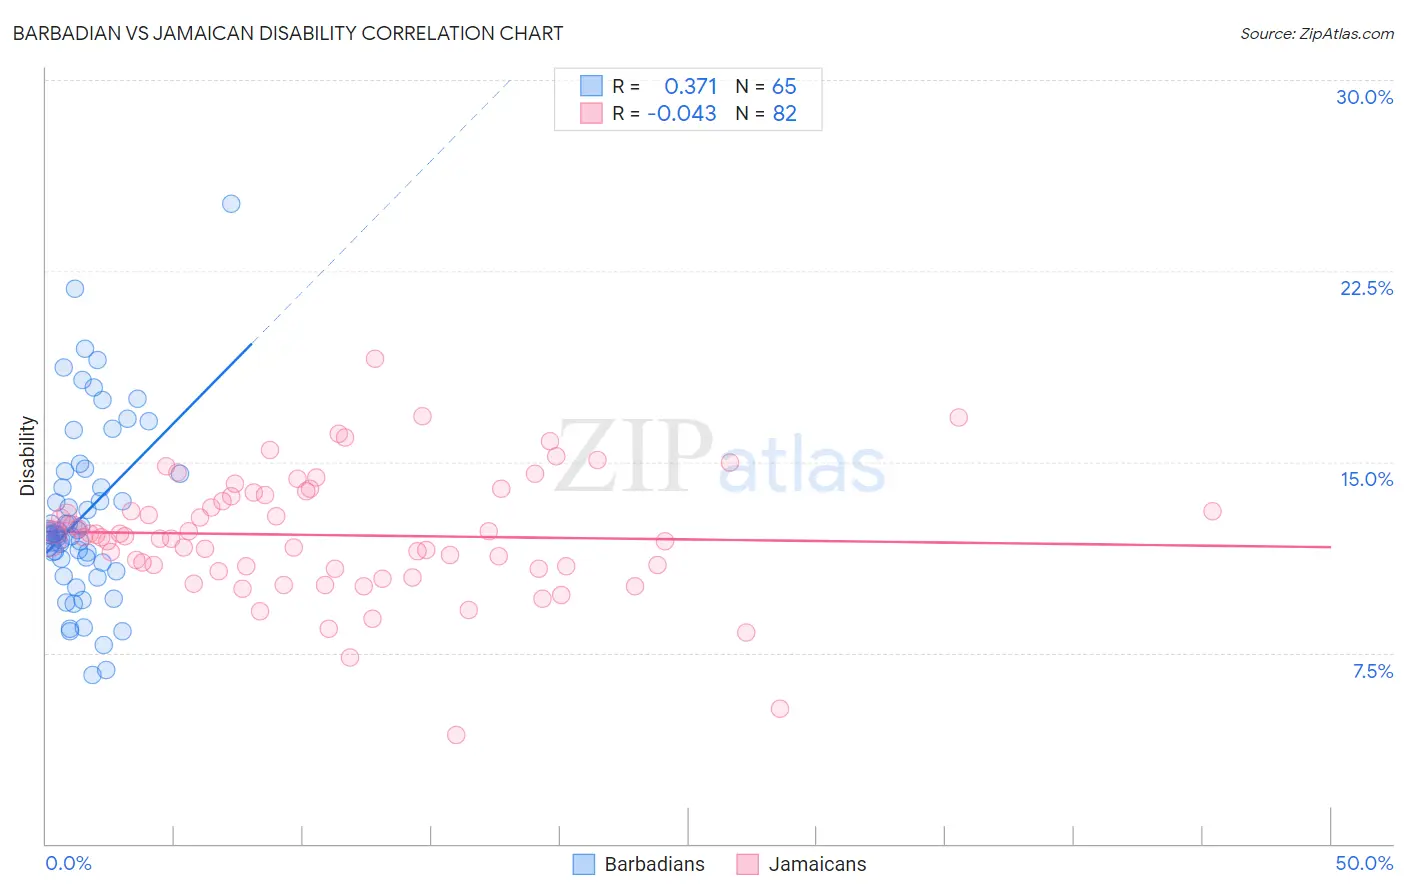
Barbadian vs Jamaican Disability Correlation Chart
The statistical analysis conducted on geographies consisting of 141,302,135 people shows a mild positive correlation between the proportion of Barbadians and percentage of population with a disability in the United States with a correlation coefficient (R) of 0.371 and weighted average of 11.9%. Similarly, the statistical analysis conducted on geographies consisting of 367,991,297 people shows no correlation between the proportion of Jamaicans and percentage of population with a disability in the United States with a correlation coefficient (R) of -0.043 and weighted average of 12.1%, a difference of 1.9%.
Disability Correlation Summary
| Measurement | Barbadian | Jamaican |
| Minimum | 6.6% | 4.3% |
| Maximum | 25.1% | 19.1% |
| Range | 18.5% | 14.8% |
| Mean | 12.9% | 12.1% |
| Median | 12.2% | 12.0% |
| Interquartile 25% (IQ1) | 11.1% | 10.8% |
| Interquartile 75% (IQ3) | 14.6% | 13.7% |
| Interquartile Range (IQR) | 3.4% | 2.9% |
| Standard Deviation (Sample) | 3.5% | 2.4% |
| Standard Deviation (Population) | 3.5% | 2.4% |
Similar Demographics by Disability
Demographics Similar to Barbadians by Disability
In terms of disability, the demographic groups most similar to Barbadians are Serbian (11.9%, a difference of 0.040%), Immigrants from Belize (11.9%, a difference of 0.050%), Ukrainian (11.9%, a difference of 0.10%), Immigrants from Panama (11.9%, a difference of 0.10%), and Somali (11.9%, a difference of 0.11%).
| Demographics | Rating | Rank | Disability |
| Immigrants | Mexico | 23.8 /100 | #188 | Fair 11.9% |
| Immigrants | Zaire | 21.8 /100 | #189 | Fair 11.9% |
| Immigrants | West Indies | 21.1 /100 | #190 | Fair 11.9% |
| Ute | 19.5 /100 | #191 | Poor 11.9% |
| Lithuanians | 18.8 /100 | #192 | Poor 11.9% |
| Immigrants | Bosnia and Herzegovina | 18.0 /100 | #193 | Poor 11.9% |
| Somalis | 17.3 /100 | #194 | Poor 11.9% |
| Barbadians | 15.8 /100 | #195 | Poor 11.9% |
| Serbians | 15.4 /100 | #196 | Poor 11.9% |
| Immigrants | Belize | 15.2 /100 | #197 | Poor 11.9% |
| Ukrainians | 14.7 /100 | #198 | Poor 11.9% |
| Immigrants | Panama | 14.6 /100 | #199 | Poor 11.9% |
| Belizeans | 12.8 /100 | #200 | Poor 11.9% |
| Assyrians/Chaldeans/Syriacs | 12.6 /100 | #201 | Poor 11.9% |
| Immigrants | England | 12.0 /100 | #202 | Poor 12.0% |
Demographics Similar to Jamaicans by Disability
In terms of disability, the demographic groups most similar to Jamaicans are Alsatian (12.1%, a difference of 0.010%), Senegalese (12.1%, a difference of 0.050%), Mexican (12.1%, a difference of 0.13%), West Indian (12.2%, a difference of 0.15%), and Inupiat (12.2%, a difference of 0.17%).
| Demographics | Rating | Rank | Disability |
| Croatians | 4.9 /100 | #219 | Tragic 12.1% |
| Immigrants | Bahamas | 4.7 /100 | #220 | Tragic 12.1% |
| Northern Europeans | 4.2 /100 | #221 | Tragic 12.1% |
| Spanish American Indians | 4.1 /100 | #222 | Tragic 12.1% |
| Hispanics or Latinos | 3.9 /100 | #223 | Tragic 12.1% |
| Mexicans | 3.7 /100 | #224 | Tragic 12.1% |
| Senegalese | 3.5 /100 | #225 | Tragic 12.1% |
| Jamaicans | 3.3 /100 | #226 | Tragic 12.1% |
| Alsatians | 3.3 /100 | #227 | Tragic 12.1% |
| West Indians | 2.9 /100 | #228 | Tragic 12.2% |
| Inupiat | 2.8 /100 | #229 | Tragic 12.2% |
| Samoans | 2.6 /100 | #230 | Tragic 12.2% |
| Malaysians | 2.5 /100 | #231 | Tragic 12.2% |
| Italians | 2.5 /100 | #232 | Tragic 12.2% |
| Bahamians | 2.3 /100 | #233 | Tragic 12.2% |