Barbadian vs Immigrants from Costa Rica Disability
COMPARE
Barbadian
Immigrants from Costa Rica
Disability
Disability Comparison
Barbadians
Immigrants from Costa Rica
11.9%
DISABILITY
15.8/ 100
METRIC RATING
195th/ 347
METRIC RANK
11.4%
DISABILITY
93.4/ 100
METRIC RATING
121st/ 347
METRIC RANK
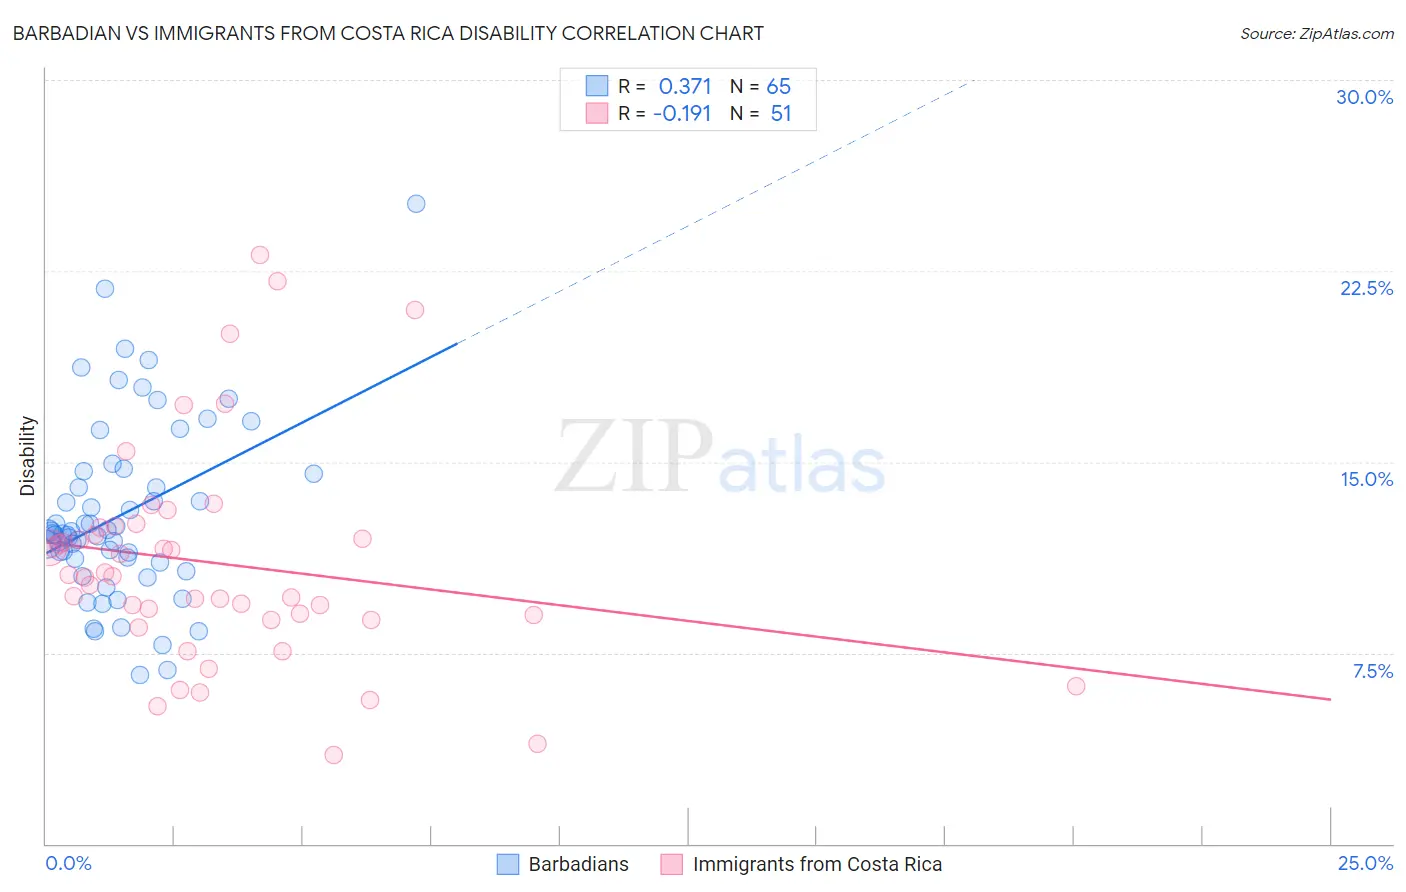
Barbadian vs Immigrants from Costa Rica Disability Correlation Chart
The statistical analysis conducted on geographies consisting of 141,302,135 people shows a mild positive correlation between the proportion of Barbadians and percentage of population with a disability in the United States with a correlation coefficient (R) of 0.371 and weighted average of 11.9%. Similarly, the statistical analysis conducted on geographies consisting of 204,275,653 people shows a poor negative correlation between the proportion of Immigrants from Costa Rica and percentage of population with a disability in the United States with a correlation coefficient (R) of -0.191 and weighted average of 11.4%, a difference of 4.9%.
Disability Correlation Summary
| Measurement | Barbadian | Immigrants from Costa Rica |
| Minimum | 6.6% | 3.5% |
| Maximum | 25.1% | 23.1% |
| Range | 18.5% | 19.6% |
| Mean | 12.9% | 11.0% |
| Median | 12.2% | 10.5% |
| Interquartile 25% (IQ1) | 11.1% | 8.8% |
| Interquartile 75% (IQ3) | 14.6% | 12.4% |
| Interquartile Range (IQR) | 3.4% | 3.6% |
| Standard Deviation (Sample) | 3.5% | 4.2% |
| Standard Deviation (Population) | 3.5% | 4.2% |
Similar Demographics by Disability
Demographics Similar to Barbadians by Disability
In terms of disability, the demographic groups most similar to Barbadians are Serbian (11.9%, a difference of 0.040%), Immigrants from Belize (11.9%, a difference of 0.050%), Ukrainian (11.9%, a difference of 0.10%), Immigrants from Panama (11.9%, a difference of 0.10%), and Somali (11.9%, a difference of 0.11%).
| Demographics | Rating | Rank | Disability |
| Immigrants | Mexico | 23.8 /100 | #188 | Fair 11.9% |
| Immigrants | Zaire | 21.8 /100 | #189 | Fair 11.9% |
| Immigrants | West Indies | 21.1 /100 | #190 | Fair 11.9% |
| Ute | 19.5 /100 | #191 | Poor 11.9% |
| Lithuanians | 18.8 /100 | #192 | Poor 11.9% |
| Immigrants | Bosnia and Herzegovina | 18.0 /100 | #193 | Poor 11.9% |
| Somalis | 17.3 /100 | #194 | Poor 11.9% |
| Barbadians | 15.8 /100 | #195 | Poor 11.9% |
| Serbians | 15.4 /100 | #196 | Poor 11.9% |
| Immigrants | Belize | 15.2 /100 | #197 | Poor 11.9% |
| Ukrainians | 14.7 /100 | #198 | Poor 11.9% |
| Immigrants | Panama | 14.6 /100 | #199 | Poor 11.9% |
| Belizeans | 12.8 /100 | #200 | Poor 11.9% |
| Assyrians/Chaldeans/Syriacs | 12.6 /100 | #201 | Poor 11.9% |
| Immigrants | England | 12.0 /100 | #202 | Poor 12.0% |
Demographics Similar to Immigrants from Costa Rica by Disability
In terms of disability, the demographic groups most similar to Immigrants from Costa Rica are Central American (11.4%, a difference of 0.010%), Immigrants from North Macedonia (11.4%, a difference of 0.010%), Brazilian (11.4%, a difference of 0.020%), Korean (11.3%, a difference of 0.070%), and Luxembourger (11.3%, a difference of 0.080%).
| Demographics | Rating | Rank | Disability |
| Immigrants | Syria | 94.7 /100 | #114 | Exceptional 11.3% |
| Immigrants | Philippines | 94.6 /100 | #115 | Exceptional 11.3% |
| Immigrants | Northern Europe | 94.1 /100 | #116 | Exceptional 11.3% |
| Luxembourgers | 93.9 /100 | #117 | Exceptional 11.3% |
| Koreans | 93.8 /100 | #118 | Exceptional 11.3% |
| Central Americans | 93.5 /100 | #119 | Exceptional 11.4% |
| Immigrants | North Macedonia | 93.5 /100 | #120 | Exceptional 11.4% |
| Immigrants | Costa Rica | 93.4 /100 | #121 | Exceptional 11.4% |
| Brazilians | 93.3 /100 | #122 | Exceptional 11.4% |
| South Africans | 92.3 /100 | #123 | Exceptional 11.4% |
| South American Indians | 92.2 /100 | #124 | Exceptional 11.4% |
| Costa Ricans | 91.9 /100 | #125 | Exceptional 11.4% |
| Immigrants | Latvia | 90.9 /100 | #126 | Exceptional 11.4% |
| Immigrants | Italy | 90.4 /100 | #127 | Exceptional 11.4% |
| Immigrants | Europe | 90.4 /100 | #128 | Exceptional 11.4% |