Barbadian vs Comanche Disability
COMPARE
Barbadian
Comanche
Disability
Disability Comparison
Barbadians
Comanche
11.9%
DISABILITY
15.8/ 100
METRIC RATING
195th/ 347
METRIC RANK
14.1%
DISABILITY
0.0/ 100
METRIC RATING
323rd/ 347
METRIC RANK
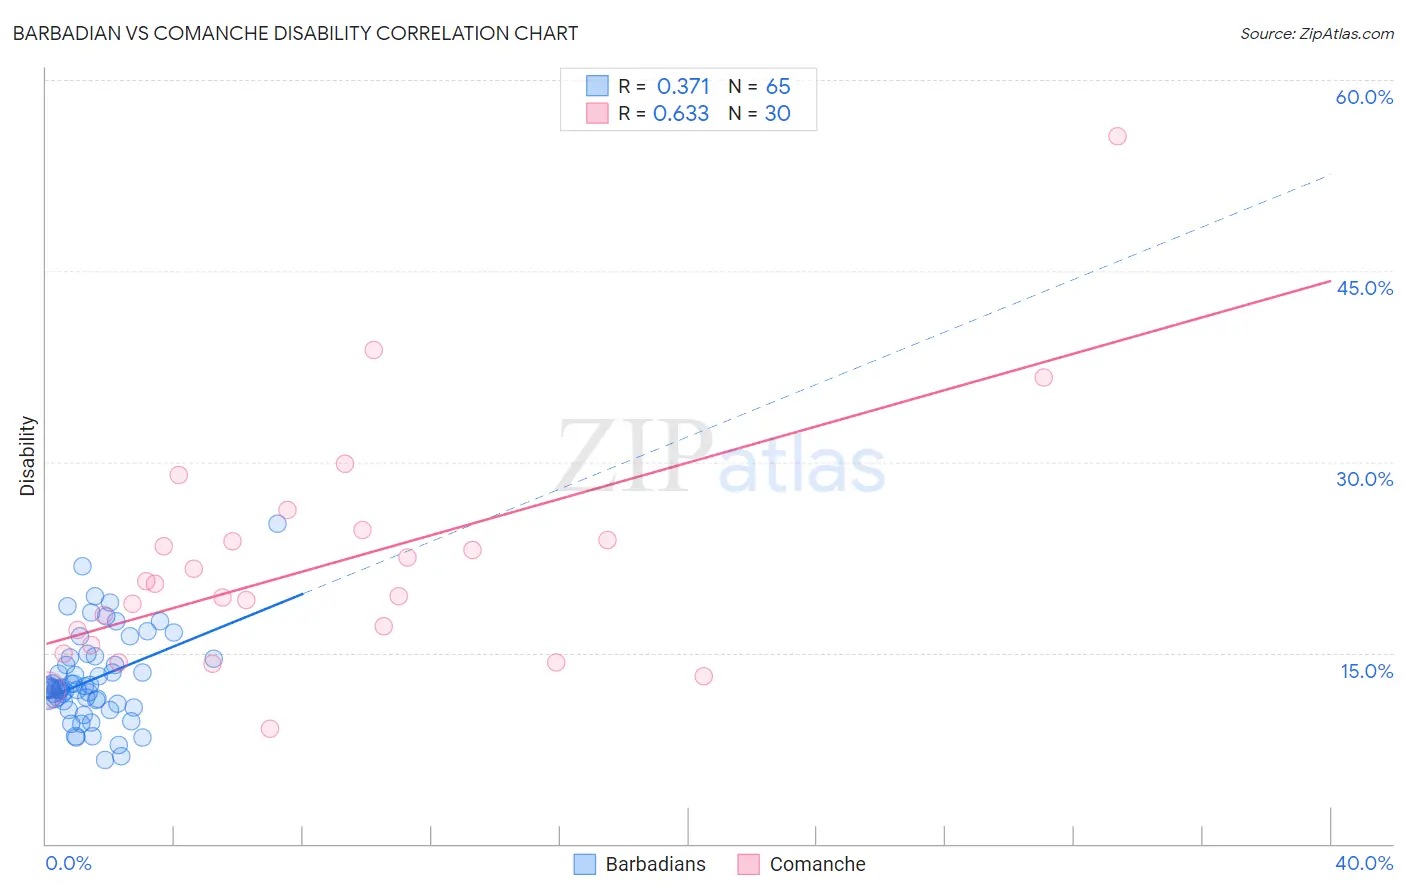
Barbadian vs Comanche Disability Correlation Chart
The statistical analysis conducted on geographies consisting of 141,302,135 people shows a mild positive correlation between the proportion of Barbadians and percentage of population with a disability in the United States with a correlation coefficient (R) of 0.371 and weighted average of 11.9%. Similarly, the statistical analysis conducted on geographies consisting of 109,776,757 people shows a significant positive correlation between the proportion of Comanche and percentage of population with a disability in the United States with a correlation coefficient (R) of 0.633 and weighted average of 14.1%, a difference of 18.5%.
Disability Correlation Summary
| Measurement | Barbadian | Comanche |
| Minimum | 6.6% | 9.0% |
| Maximum | 25.1% | 55.6% |
| Range | 18.5% | 46.5% |
| Mean | 12.9% | 21.9% |
| Median | 12.2% | 19.9% |
| Interquartile 25% (IQ1) | 11.1% | 15.6% |
| Interquartile 75% (IQ3) | 14.6% | 23.8% |
| Interquartile Range (IQR) | 3.4% | 8.3% |
| Standard Deviation (Sample) | 3.5% | 9.3% |
| Standard Deviation (Population) | 3.5% | 9.1% |
Similar Demographics by Disability
Demographics Similar to Barbadians by Disability
In terms of disability, the demographic groups most similar to Barbadians are Serbian (11.9%, a difference of 0.040%), Immigrants from Belize (11.9%, a difference of 0.050%), Ukrainian (11.9%, a difference of 0.10%), Immigrants from Panama (11.9%, a difference of 0.10%), and Somali (11.9%, a difference of 0.11%).
| Demographics | Rating | Rank | Disability |
| Immigrants | Mexico | 23.8 /100 | #188 | Fair 11.9% |
| Immigrants | Zaire | 21.8 /100 | #189 | Fair 11.9% |
| Immigrants | West Indies | 21.1 /100 | #190 | Fair 11.9% |
| Ute | 19.5 /100 | #191 | Poor 11.9% |
| Lithuanians | 18.8 /100 | #192 | Poor 11.9% |
| Immigrants | Bosnia and Herzegovina | 18.0 /100 | #193 | Poor 11.9% |
| Somalis | 17.3 /100 | #194 | Poor 11.9% |
| Barbadians | 15.8 /100 | #195 | Poor 11.9% |
| Serbians | 15.4 /100 | #196 | Poor 11.9% |
| Immigrants | Belize | 15.2 /100 | #197 | Poor 11.9% |
| Ukrainians | 14.7 /100 | #198 | Poor 11.9% |
| Immigrants | Panama | 14.6 /100 | #199 | Poor 11.9% |
| Belizeans | 12.8 /100 | #200 | Poor 11.9% |
| Assyrians/Chaldeans/Syriacs | 12.6 /100 | #201 | Poor 11.9% |
| Immigrants | England | 12.0 /100 | #202 | Poor 12.0% |
Demographics Similar to Comanche by Disability
In terms of disability, the demographic groups most similar to Comanche are Chippewa (14.1%, a difference of 0.20%), Native/Alaskan (14.2%, a difference of 0.25%), Osage (14.2%, a difference of 0.28%), Ottawa (14.2%, a difference of 0.30%), and Immigrants from the Azores (14.2%, a difference of 0.30%).
| Demographics | Rating | Rank | Disability |
| Pima | 0.0 /100 | #316 | Tragic 13.7% |
| Immigrants | Cabo Verde | 0.0 /100 | #317 | Tragic 13.7% |
| Menominee | 0.0 /100 | #318 | Tragic 13.8% |
| Iroquois | 0.0 /100 | #319 | Tragic 13.8% |
| Apache | 0.0 /100 | #320 | Tragic 13.9% |
| Paiute | 0.0 /100 | #321 | Tragic 13.9% |
| Americans | 0.0 /100 | #322 | Tragic 13.9% |
| Comanche | 0.0 /100 | #323 | Tragic 14.1% |
| Chippewa | 0.0 /100 | #324 | Tragic 14.1% |
| Natives/Alaskans | 0.0 /100 | #325 | Tragic 14.2% |
| Osage | 0.0 /100 | #326 | Tragic 14.2% |
| Ottawa | 0.0 /100 | #327 | Tragic 14.2% |
| Immigrants | Azores | 0.0 /100 | #328 | Tragic 14.2% |
| Potawatomi | 0.0 /100 | #329 | Tragic 14.2% |
| Navajo | 0.0 /100 | #330 | Tragic 14.3% |