Nepalese vs Subsaharan African Hearing Disability
COMPARE
Nepalese
Subsaharan African
Hearing Disability
Hearing Disability Comparison
Nepalese
Sub-Saharan Africans
3.3%
HEARING DISABILITY
1.2/ 100
METRIC RATING
239th/ 347
METRIC RANK
2.9%
HEARING DISABILITY
83.3/ 100
METRIC RATING
141st/ 347
METRIC RANK
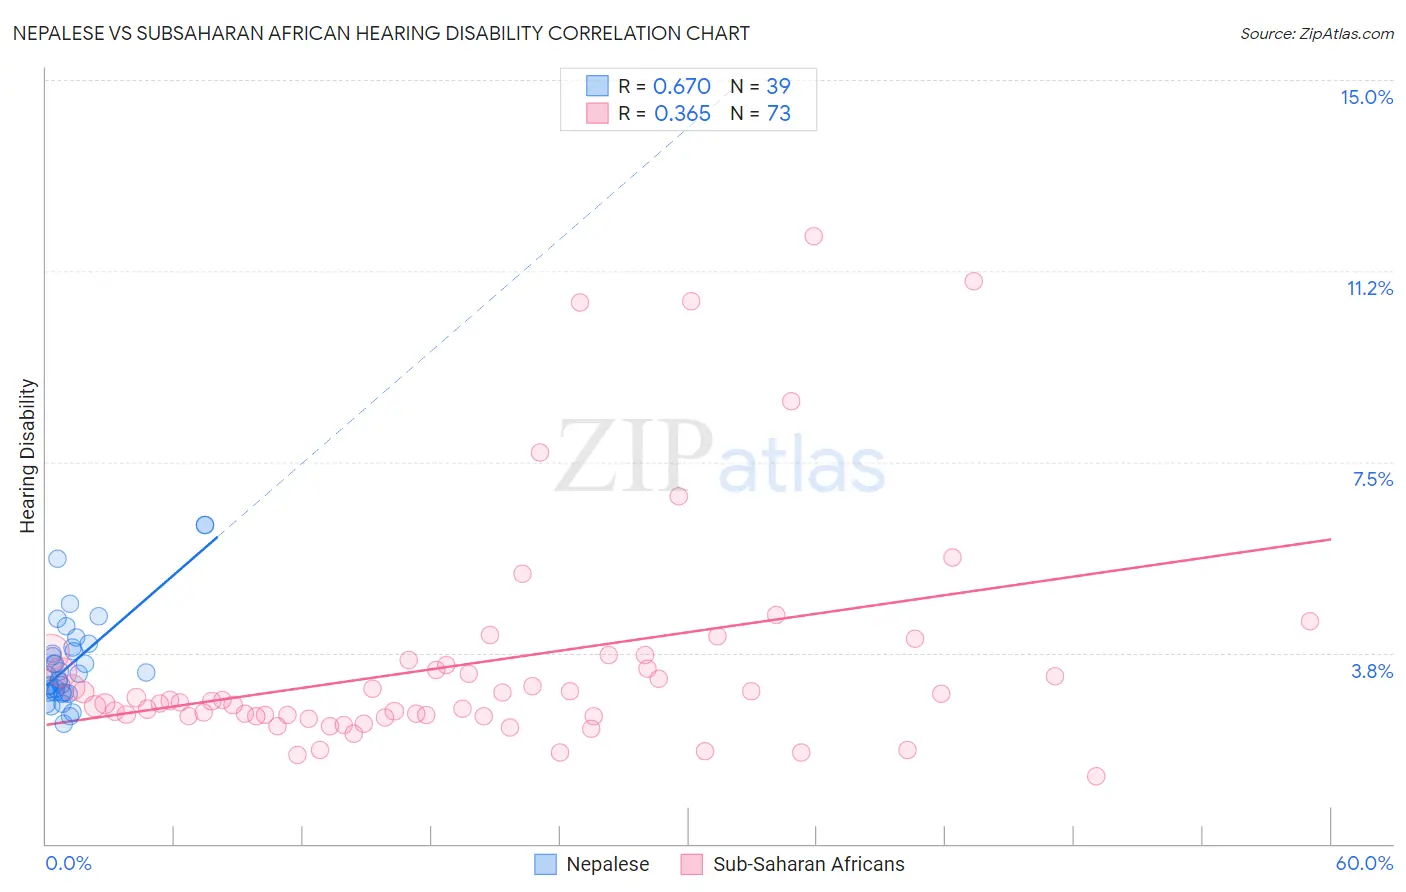
Nepalese vs Subsaharan African Hearing Disability Correlation Chart
The statistical analysis conducted on geographies consisting of 24,517,800 people shows a significant positive correlation between the proportion of Nepalese and percentage of population with hearing disability in the United States with a correlation coefficient (R) of 0.670 and weighted average of 3.3%. Similarly, the statistical analysis conducted on geographies consisting of 507,755,219 people shows a mild positive correlation between the proportion of Sub-Saharan Africans and percentage of population with hearing disability in the United States with a correlation coefficient (R) of 0.365 and weighted average of 2.9%, a difference of 14.6%.
Hearing Disability Correlation Summary
| Measurement | Nepalese | Subsaharan African |
| Minimum | 2.4% | 1.3% |
| Maximum | 6.3% | 11.9% |
| Range | 3.9% | 10.6% |
| Mean | 3.5% | 3.5% |
| Median | 3.3% | 2.8% |
| Interquartile 25% (IQ1) | 3.0% | 2.5% |
| Interquartile 75% (IQ3) | 3.9% | 3.6% |
| Interquartile Range (IQR) | 0.90% | 1.0% |
| Standard Deviation (Sample) | 0.92% | 2.2% |
| Standard Deviation (Population) | 0.91% | 2.2% |
Similar Demographics by Hearing Disability
Demographics Similar to Nepalese by Hearing Disability
In terms of hearing disability, the demographic groups most similar to Nepalese are Immigrants from Netherlands (3.3%, a difference of 0.18%), Samoan (3.3%, a difference of 0.25%), Yugoslavian (3.3%, a difference of 0.36%), Immigrants from Western Europe (3.3%, a difference of 0.53%), and Assyrian/Chaldean/Syriac (3.3%, a difference of 0.60%).
| Demographics | Rating | Rank | Hearing Disability |
| Ukrainians | 2.9 /100 | #232 | Tragic 3.2% |
| Estonians | 2.4 /100 | #233 | Tragic 3.3% |
| Central American Indians | 2.3 /100 | #234 | Tragic 3.3% |
| Guamanians/Chamorros | 2.2 /100 | #235 | Tragic 3.3% |
| Serbians | 2.2 /100 | #236 | Tragic 3.3% |
| Immigrants | Austria | 1.8 /100 | #237 | Tragic 3.3% |
| German Russians | 1.8 /100 | #238 | Tragic 3.3% |
| Nepalese | 1.2 /100 | #239 | Tragic 3.3% |
| Immigrants | Netherlands | 1.1 /100 | #240 | Tragic 3.3% |
| Samoans | 1.1 /100 | #241 | Tragic 3.3% |
| Yugoslavians | 1.0 /100 | #242 | Tragic 3.3% |
| Immigrants | Western Europe | 1.0 /100 | #243 | Tragic 3.3% |
| Assyrians/Chaldeans/Syriacs | 0.9 /100 | #244 | Tragic 3.3% |
| Immigrants | Scotland | 0.8 /100 | #245 | Tragic 3.3% |
| Immigrants | England | 0.7 /100 | #246 | Tragic 3.3% |
Demographics Similar to Sub-Saharan Africans by Hearing Disability
In terms of hearing disability, the demographic groups most similar to Sub-Saharan Africans are Immigrants from Jordan (2.9%, a difference of 0.070%), Bermudan (2.9%, a difference of 0.090%), Immigrants from Costa Rica (2.9%, a difference of 0.13%), Sri Lankan (2.9%, a difference of 0.14%), and Immigrants from Brazil (2.9%, a difference of 0.24%).
| Demographics | Rating | Rank | Hearing Disability |
| Ugandans | 85.5 /100 | #134 | Excellent 2.9% |
| Soviet Union | 84.8 /100 | #135 | Excellent 2.9% |
| Immigrants | Brazil | 84.6 /100 | #136 | Excellent 2.9% |
| Sri Lankans | 84.1 /100 | #137 | Excellent 2.9% |
| Immigrants | Costa Rica | 84.0 /100 | #138 | Excellent 2.9% |
| Bermudans | 83.8 /100 | #139 | Excellent 2.9% |
| Immigrants | Jordan | 83.7 /100 | #140 | Excellent 2.9% |
| Sub-Saharan Africans | 83.3 /100 | #141 | Excellent 2.9% |
| Laotians | 81.1 /100 | #142 | Excellent 2.9% |
| Immigrants | Bahamas | 80.9 /100 | #143 | Excellent 2.9% |
| Immigrants | Bulgaria | 79.2 /100 | #144 | Good 2.9% |
| Immigrants | Congo | 78.9 /100 | #145 | Good 2.9% |
| Brazilians | 78.7 /100 | #146 | Good 2.9% |
| Tongans | 78.6 /100 | #147 | Good 2.9% |
| Immigrants | Russia | 77.7 /100 | #148 | Good 2.9% |