Nepalese vs Canadian Hearing Disability
COMPARE
Nepalese
Canadian
Hearing Disability
Hearing Disability Comparison
Nepalese
Canadians
3.3%
HEARING DISABILITY
1.2/ 100
METRIC RATING
239th/ 347
METRIC RANK
3.5%
HEARING DISABILITY
0.1/ 100
METRIC RATING
267th/ 347
METRIC RANK
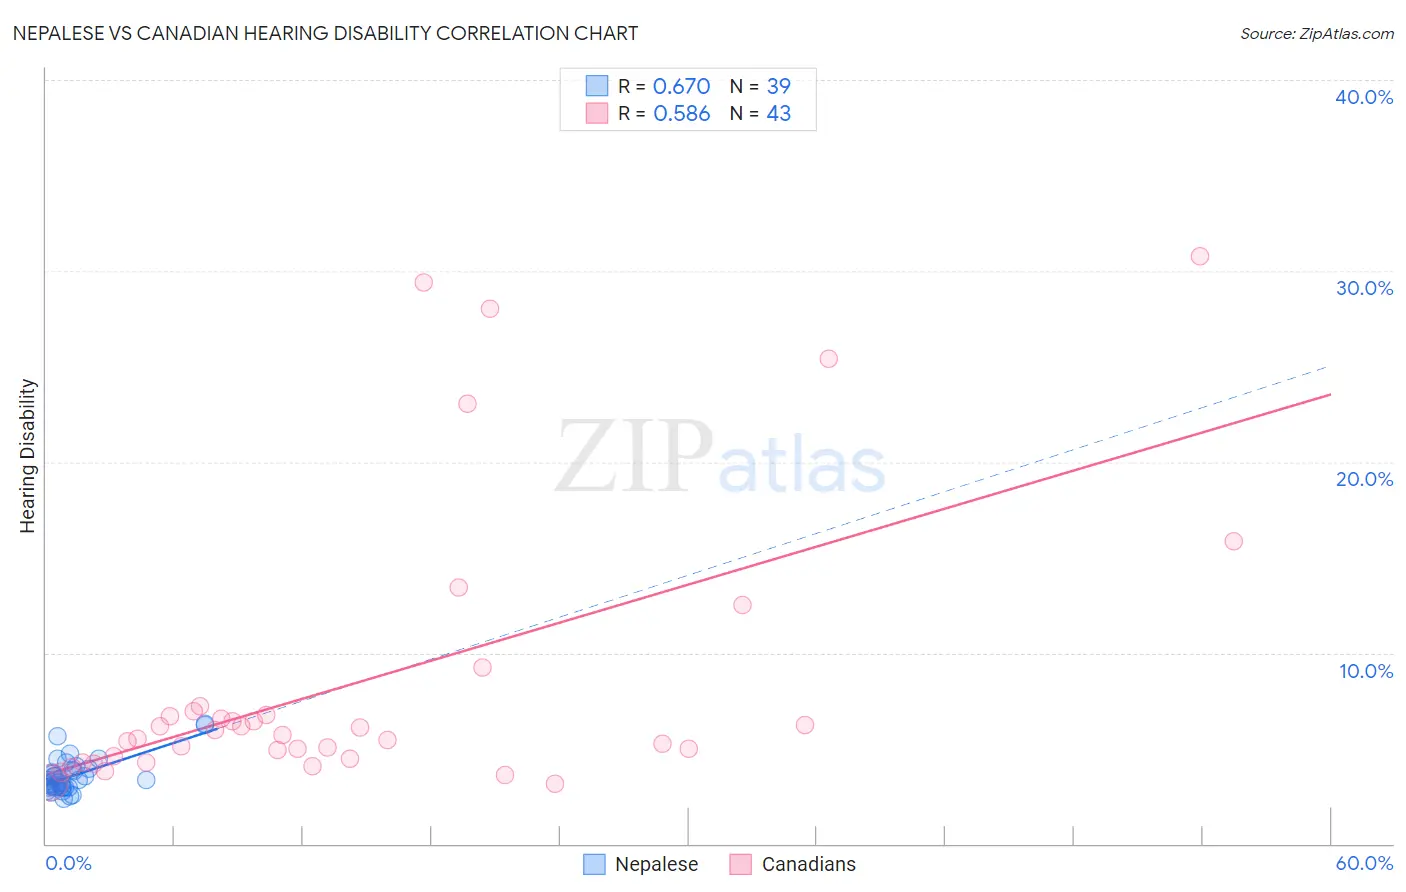
Nepalese vs Canadian Hearing Disability Correlation Chart
The statistical analysis conducted on geographies consisting of 24,517,800 people shows a significant positive correlation between the proportion of Nepalese and percentage of population with hearing disability in the United States with a correlation coefficient (R) of 0.670 and weighted average of 3.3%. Similarly, the statistical analysis conducted on geographies consisting of 437,359,383 people shows a substantial positive correlation between the proportion of Canadians and percentage of population with hearing disability in the United States with a correlation coefficient (R) of 0.586 and weighted average of 3.5%, a difference of 5.6%.
Hearing Disability Correlation Summary
| Measurement | Nepalese | Canadian |
| Minimum | 2.4% | 3.1% |
| Maximum | 6.3% | 30.8% |
| Range | 3.9% | 27.6% |
| Mean | 3.5% | 8.5% |
| Median | 3.3% | 5.7% |
| Interquartile 25% (IQ1) | 3.0% | 4.4% |
| Interquartile 75% (IQ3) | 3.9% | 6.9% |
| Interquartile Range (IQR) | 0.90% | 2.5% |
| Standard Deviation (Sample) | 0.92% | 7.4% |
| Standard Deviation (Population) | 0.91% | 7.3% |
Similar Demographics by Hearing Disability
Demographics Similar to Nepalese by Hearing Disability
In terms of hearing disability, the demographic groups most similar to Nepalese are Immigrants from Netherlands (3.3%, a difference of 0.18%), Samoan (3.3%, a difference of 0.25%), Yugoslavian (3.3%, a difference of 0.36%), Immigrants from Western Europe (3.3%, a difference of 0.53%), and Assyrian/Chaldean/Syriac (3.3%, a difference of 0.60%).
| Demographics | Rating | Rank | Hearing Disability |
| Ukrainians | 2.9 /100 | #232 | Tragic 3.2% |
| Estonians | 2.4 /100 | #233 | Tragic 3.3% |
| Central American Indians | 2.3 /100 | #234 | Tragic 3.3% |
| Guamanians/Chamorros | 2.2 /100 | #235 | Tragic 3.3% |
| Serbians | 2.2 /100 | #236 | Tragic 3.3% |
| Immigrants | Austria | 1.8 /100 | #237 | Tragic 3.3% |
| German Russians | 1.8 /100 | #238 | Tragic 3.3% |
| Nepalese | 1.2 /100 | #239 | Tragic 3.3% |
| Immigrants | Netherlands | 1.1 /100 | #240 | Tragic 3.3% |
| Samoans | 1.1 /100 | #241 | Tragic 3.3% |
| Yugoslavians | 1.0 /100 | #242 | Tragic 3.3% |
| Immigrants | Western Europe | 1.0 /100 | #243 | Tragic 3.3% |
| Assyrians/Chaldeans/Syriacs | 0.9 /100 | #244 | Tragic 3.3% |
| Immigrants | Scotland | 0.8 /100 | #245 | Tragic 3.3% |
| Immigrants | England | 0.7 /100 | #246 | Tragic 3.3% |
Demographics Similar to Canadians by Hearing Disability
In terms of hearing disability, the demographic groups most similar to Canadians are Spaniard (3.5%, a difference of 0.020%), Belgian (3.5%, a difference of 0.22%), Ute (3.5%, a difference of 0.32%), British (3.5%, a difference of 0.40%), and Immigrants from Germany (3.5%, a difference of 0.42%).
| Demographics | Rating | Rank | Hearing Disability |
| Portuguese | 0.1 /100 | #260 | Tragic 3.5% |
| Hawaiians | 0.1 /100 | #261 | Tragic 3.5% |
| Immigrants | North America | 0.1 /100 | #262 | Tragic 3.5% |
| Immigrants | Canada | 0.1 /100 | #263 | Tragic 3.5% |
| Immigrants | Germany | 0.1 /100 | #264 | Tragic 3.5% |
| British | 0.1 /100 | #265 | Tragic 3.5% |
| Belgians | 0.1 /100 | #266 | Tragic 3.5% |
| Canadians | 0.1 /100 | #267 | Tragic 3.5% |
| Spaniards | 0.1 /100 | #268 | Tragic 3.5% |
| Ute | 0.1 /100 | #269 | Tragic 3.5% |
| Europeans | 0.1 /100 | #270 | Tragic 3.5% |
| Czechs | 0.1 /100 | #271 | Tragic 3.5% |
| Fijians | 0.0 /100 | #272 | Tragic 3.5% |
| Puerto Ricans | 0.0 /100 | #273 | Tragic 3.5% |
| Swiss | 0.0 /100 | #274 | Tragic 3.5% |