Nepalese vs Subsaharan African Family Households
COMPARE
Nepalese
Subsaharan African
Family Households
Family Households Comparison
Nepalese
Sub-Saharan Africans
67.2%
FAMILY HOUSEHOLDS
100.0/ 100
METRIC RATING
32nd/ 347
METRIC RANK
62.1%
FAMILY HOUSEHOLDS
0.0/ 100
METRIC RATING
309th/ 347
METRIC RANK
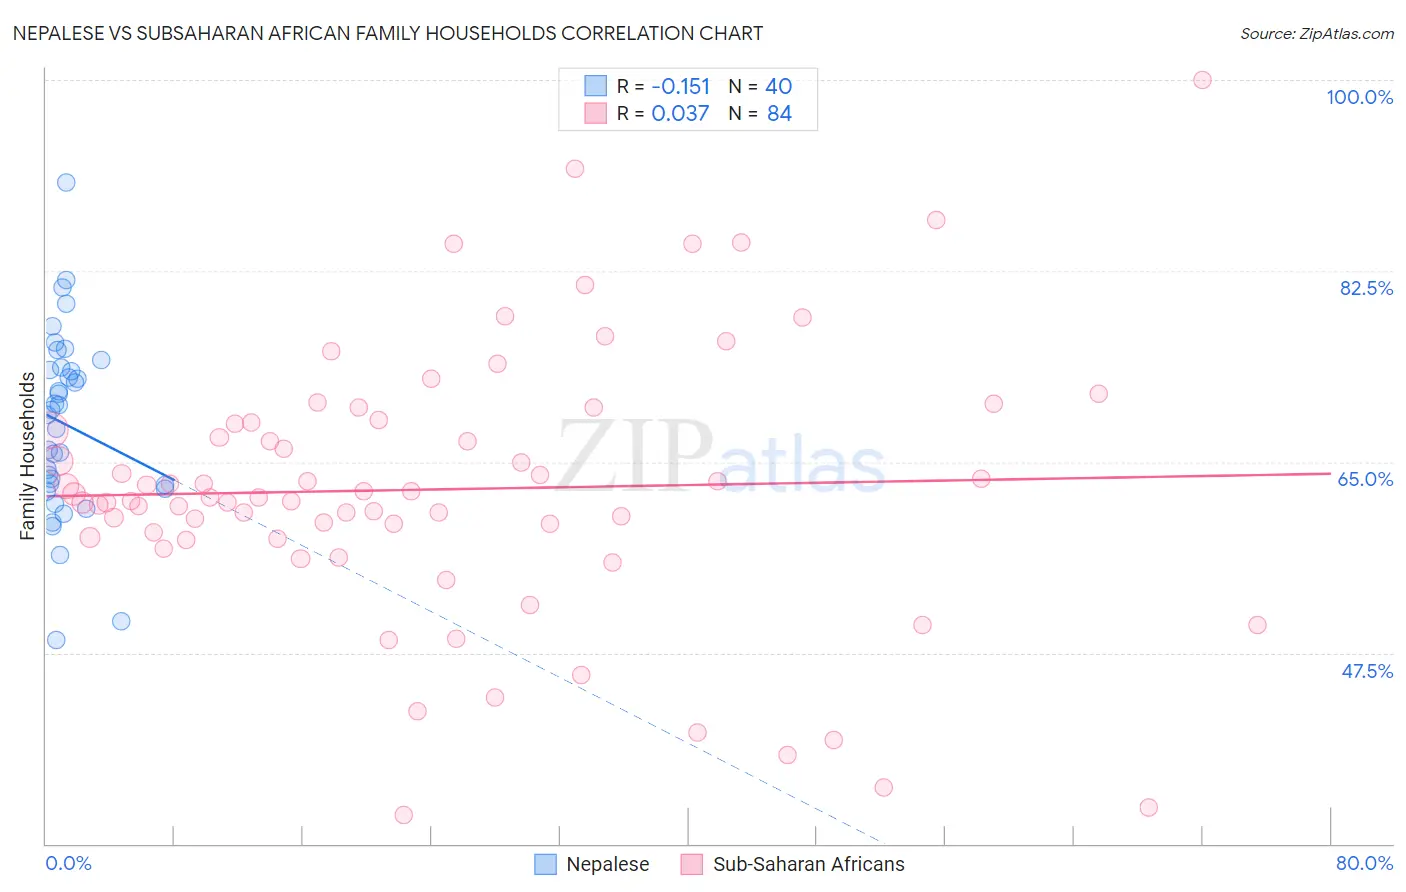
Nepalese vs Subsaharan African Family Households Correlation Chart
The statistical analysis conducted on geographies consisting of 24,521,755 people shows a poor negative correlation between the proportion of Nepalese and percentage of family households in the United States with a correlation coefficient (R) of -0.151 and weighted average of 67.2%. Similarly, the statistical analysis conducted on geographies consisting of 507,604,715 people shows no correlation between the proportion of Sub-Saharan Africans and percentage of family households in the United States with a correlation coefficient (R) of 0.037 and weighted average of 62.1%, a difference of 8.3%.
Family Households Correlation Summary
| Measurement | Nepalese | Subsaharan African |
| Minimum | 48.7% | 32.6% |
| Maximum | 90.6% | 100.0% |
| Range | 41.9% | 67.4% |
| Mean | 68.4% | 62.5% |
| Median | 69.5% | 61.7% |
| Interquartile 25% (IQ1) | 62.7% | 58.0% |
| Interquartile 75% (IQ3) | 73.5% | 68.6% |
| Interquartile Range (IQR) | 10.9% | 10.5% |
| Standard Deviation (Sample) | 8.5% | 12.5% |
| Standard Deviation (Population) | 8.4% | 12.4% |
Similar Demographics by Family Households
Demographics Similar to Nepalese by Family Households
In terms of family households, the demographic groups most similar to Nepalese are Salvadoran (67.2%, a difference of 0.040%), Thai (67.2%, a difference of 0.040%), Immigrants from Latin America (67.2%, a difference of 0.060%), Immigrants from Peru (67.2%, a difference of 0.070%), and Tohono O'odham (67.1%, a difference of 0.090%).
| Demographics | Rating | Rank | Family Households |
| Immigrants | Nicaragua | 100.0 /100 | #25 | Exceptional 67.5% |
| Immigrants | India | 100.0 /100 | #26 | Exceptional 67.4% |
| Hispanics or Latinos | 100.0 /100 | #27 | Exceptional 67.4% |
| Hawaiians | 100.0 /100 | #28 | Exceptional 67.4% |
| Nicaraguans | 100.0 /100 | #29 | Exceptional 67.4% |
| Immigrants | Peru | 100.0 /100 | #30 | Exceptional 67.2% |
| Immigrants | Latin America | 100.0 /100 | #31 | Exceptional 67.2% |
| Nepalese | 100.0 /100 | #32 | Exceptional 67.2% |
| Salvadorans | 100.0 /100 | #33 | Exceptional 67.2% |
| Thais | 100.0 /100 | #34 | Exceptional 67.2% |
| Tohono O'odham | 100.0 /100 | #35 | Exceptional 67.1% |
| Peruvians | 100.0 /100 | #36 | Exceptional 67.1% |
| Tsimshian | 100.0 /100 | #37 | Exceptional 67.1% |
| Mexican American Indians | 100.0 /100 | #38 | Exceptional 67.0% |
| Immigrants | El Salvador | 100.0 /100 | #39 | Exceptional 67.0% |
Demographics Similar to Sub-Saharan Africans by Family Households
In terms of family households, the demographic groups most similar to Sub-Saharan Africans are Immigrants from Liberia (62.0%, a difference of 0.040%), Immigrants from Norway (62.1%, a difference of 0.050%), Chippewa (62.1%, a difference of 0.050%), Immigrants from Morocco (62.0%, a difference of 0.070%), and Immigrants from Latvia (62.0%, a difference of 0.12%).
| Demographics | Rating | Rank | Family Households |
| Immigrants | Kenya | 0.0 /100 | #302 | Tragic 62.3% |
| Cree | 0.0 /100 | #303 | Tragic 62.3% |
| Iroquois | 0.0 /100 | #304 | Tragic 62.2% |
| Bermudans | 0.0 /100 | #305 | Tragic 62.2% |
| Africans | 0.0 /100 | #306 | Tragic 62.1% |
| Immigrants | Norway | 0.0 /100 | #307 | Tragic 62.1% |
| Chippewa | 0.0 /100 | #308 | Tragic 62.1% |
| Sub-Saharan Africans | 0.0 /100 | #309 | Tragic 62.1% |
| Immigrants | Liberia | 0.0 /100 | #310 | Tragic 62.0% |
| Immigrants | Morocco | 0.0 /100 | #311 | Tragic 62.0% |
| Immigrants | Latvia | 0.0 /100 | #312 | Tragic 62.0% |
| Liberians | 0.0 /100 | #313 | Tragic 62.0% |
| Immigrants | Cabo Verde | 0.0 /100 | #314 | Tragic 61.9% |
| Moroccans | 0.0 /100 | #315 | Tragic 61.9% |
| Immigrants | Middle Africa | 0.0 /100 | #316 | Tragic 61.9% |