Nepalese vs Bulgarian Hearing Disability
COMPARE
Nepalese
Bulgarian
Hearing Disability
Hearing Disability Comparison
Nepalese
Bulgarians
3.3%
HEARING DISABILITY
1.2/ 100
METRIC RATING
239th/ 347
METRIC RANK
3.0%
HEARING DISABILITY
39.7/ 100
METRIC RATING
183rd/ 347
METRIC RANK
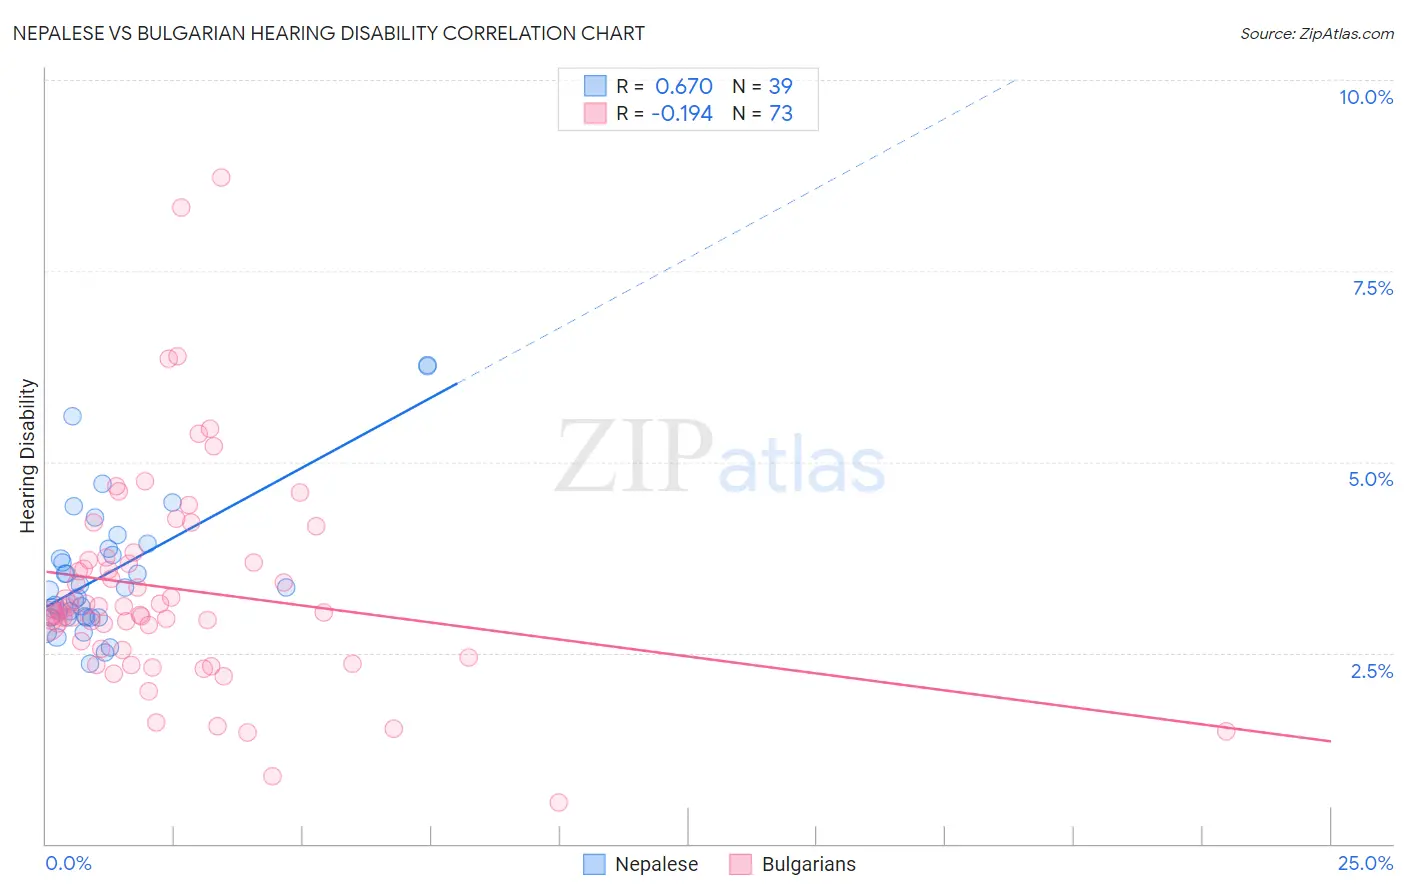
Nepalese vs Bulgarian Hearing Disability Correlation Chart
The statistical analysis conducted on geographies consisting of 24,517,800 people shows a significant positive correlation between the proportion of Nepalese and percentage of population with hearing disability in the United States with a correlation coefficient (R) of 0.670 and weighted average of 3.3%. Similarly, the statistical analysis conducted on geographies consisting of 205,610,417 people shows a poor negative correlation between the proportion of Bulgarians and percentage of population with hearing disability in the United States with a correlation coefficient (R) of -0.194 and weighted average of 3.0%, a difference of 9.2%.
Hearing Disability Correlation Summary
| Measurement | Nepalese | Bulgarian |
| Minimum | 2.4% | 0.54% |
| Maximum | 6.3% | 8.7% |
| Range | 3.9% | 8.2% |
| Mean | 3.5% | 3.3% |
| Median | 3.3% | 3.1% |
| Interquartile 25% (IQ1) | 3.0% | 2.5% |
| Interquartile 75% (IQ3) | 3.9% | 3.7% |
| Interquartile Range (IQR) | 0.90% | 1.2% |
| Standard Deviation (Sample) | 0.92% | 1.4% |
| Standard Deviation (Population) | 0.91% | 1.4% |
Similar Demographics by Hearing Disability
Demographics Similar to Nepalese by Hearing Disability
In terms of hearing disability, the demographic groups most similar to Nepalese are Immigrants from Netherlands (3.3%, a difference of 0.18%), Samoan (3.3%, a difference of 0.25%), Yugoslavian (3.3%, a difference of 0.36%), Immigrants from Western Europe (3.3%, a difference of 0.53%), and Assyrian/Chaldean/Syriac (3.3%, a difference of 0.60%).
| Demographics | Rating | Rank | Hearing Disability |
| Ukrainians | 2.9 /100 | #232 | Tragic 3.2% |
| Estonians | 2.4 /100 | #233 | Tragic 3.3% |
| Central American Indians | 2.3 /100 | #234 | Tragic 3.3% |
| Guamanians/Chamorros | 2.2 /100 | #235 | Tragic 3.3% |
| Serbians | 2.2 /100 | #236 | Tragic 3.3% |
| Immigrants | Austria | 1.8 /100 | #237 | Tragic 3.3% |
| German Russians | 1.8 /100 | #238 | Tragic 3.3% |
| Nepalese | 1.2 /100 | #239 | Tragic 3.3% |
| Immigrants | Netherlands | 1.1 /100 | #240 | Tragic 3.3% |
| Samoans | 1.1 /100 | #241 | Tragic 3.3% |
| Yugoslavians | 1.0 /100 | #242 | Tragic 3.3% |
| Immigrants | Western Europe | 1.0 /100 | #243 | Tragic 3.3% |
| Assyrians/Chaldeans/Syriacs | 0.9 /100 | #244 | Tragic 3.3% |
| Immigrants | Scotland | 0.8 /100 | #245 | Tragic 3.3% |
| Immigrants | England | 0.7 /100 | #246 | Tragic 3.3% |
Demographics Similar to Bulgarians by Hearing Disability
In terms of hearing disability, the demographic groups most similar to Bulgarians are Immigrants from Italy (3.0%, a difference of 0.14%), Immigrants from Belgium (3.0%, a difference of 0.17%), Immigrants from Ireland (3.0%, a difference of 0.23%), Immigrants from Sweden (3.0%, a difference of 0.26%), and Immigrants from Moldova (3.0%, a difference of 0.32%).
| Demographics | Rating | Rank | Hearing Disability |
| Panamanians | 47.0 /100 | #176 | Average 3.0% |
| Immigrants | Philippines | 46.4 /100 | #177 | Average 3.0% |
| Japanese | 46.0 /100 | #178 | Average 3.0% |
| Immigrants | Moldova | 43.1 /100 | #179 | Average 3.0% |
| Immigrants | Sweden | 42.4 /100 | #180 | Average 3.0% |
| Immigrants | Belgium | 41.5 /100 | #181 | Average 3.0% |
| Immigrants | Italy | 41.1 /100 | #182 | Average 3.0% |
| Bulgarians | 39.7 /100 | #183 | Fair 3.0% |
| Immigrants | Ireland | 37.4 /100 | #184 | Fair 3.0% |
| Immigrants | Southern Europe | 35.3 /100 | #185 | Fair 3.0% |
| Immigrants | Mexico | 34.9 /100 | #186 | Fair 3.0% |
| Blacks/African Americans | 34.7 /100 | #187 | Fair 3.0% |
| Mexican American Indians | 34.7 /100 | #188 | Fair 3.0% |
| Africans | 32.9 /100 | #189 | Fair 3.0% |
| Immigrants | South Africa | 31.1 /100 | #190 | Fair 3.1% |