Nepalese vs South American Indian Hearing Disability
COMPARE
Nepalese
South American Indian
Hearing Disability
Hearing Disability Comparison
Nepalese
South American Indians
3.3%
HEARING DISABILITY
1.2/ 100
METRIC RATING
239th/ 347
METRIC RANK
2.9%
HEARING DISABILITY
86.9/ 100
METRIC RATING
127th/ 347
METRIC RANK
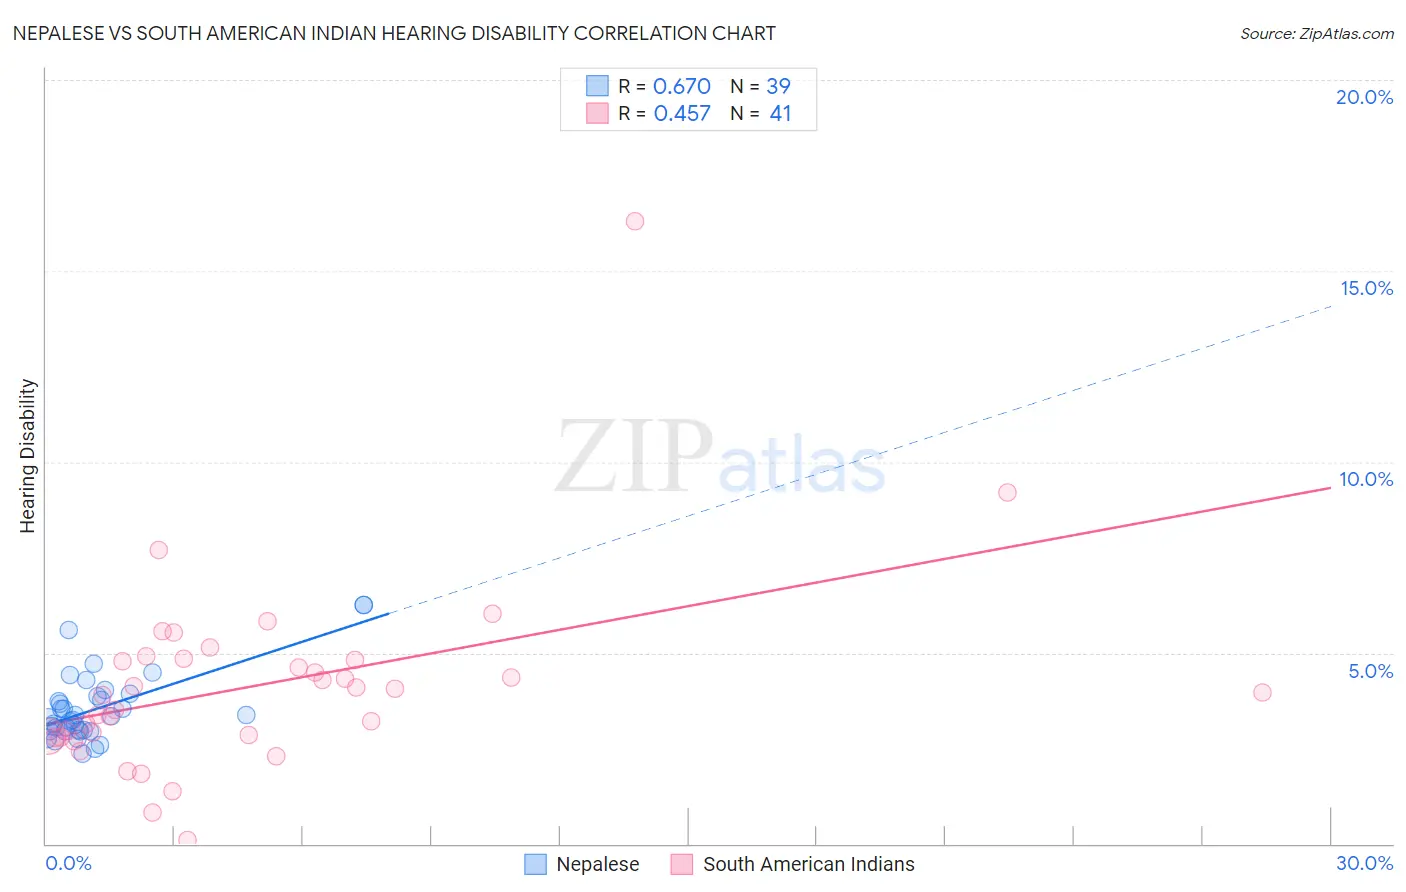
Nepalese vs South American Indian Hearing Disability Correlation Chart
The statistical analysis conducted on geographies consisting of 24,517,800 people shows a significant positive correlation between the proportion of Nepalese and percentage of population with hearing disability in the United States with a correlation coefficient (R) of 0.670 and weighted average of 3.3%. Similarly, the statistical analysis conducted on geographies consisting of 164,558,216 people shows a moderate positive correlation between the proportion of South American Indians and percentage of population with hearing disability in the United States with a correlation coefficient (R) of 0.457 and weighted average of 2.9%, a difference of 15.4%.
Hearing Disability Correlation Summary
| Measurement | Nepalese | South American Indian |
| Minimum | 2.4% | 0.098% |
| Maximum | 6.3% | 16.3% |
| Range | 3.9% | 16.2% |
| Mean | 3.5% | 4.1% |
| Median | 3.3% | 4.0% |
| Interquartile 25% (IQ1) | 3.0% | 2.8% |
| Interquartile 75% (IQ3) | 3.9% | 4.8% |
| Interquartile Range (IQR) | 0.90% | 2.0% |
| Standard Deviation (Sample) | 0.92% | 2.6% |
| Standard Deviation (Population) | 0.91% | 2.6% |
Similar Demographics by Hearing Disability
Demographics Similar to Nepalese by Hearing Disability
In terms of hearing disability, the demographic groups most similar to Nepalese are Immigrants from Netherlands (3.3%, a difference of 0.18%), Samoan (3.3%, a difference of 0.25%), Yugoslavian (3.3%, a difference of 0.36%), Immigrants from Western Europe (3.3%, a difference of 0.53%), and Assyrian/Chaldean/Syriac (3.3%, a difference of 0.60%).
| Demographics | Rating | Rank | Hearing Disability |
| Ukrainians | 2.9 /100 | #232 | Tragic 3.2% |
| Estonians | 2.4 /100 | #233 | Tragic 3.3% |
| Central American Indians | 2.3 /100 | #234 | Tragic 3.3% |
| Guamanians/Chamorros | 2.2 /100 | #235 | Tragic 3.3% |
| Serbians | 2.2 /100 | #236 | Tragic 3.3% |
| Immigrants | Austria | 1.8 /100 | #237 | Tragic 3.3% |
| German Russians | 1.8 /100 | #238 | Tragic 3.3% |
| Nepalese | 1.2 /100 | #239 | Tragic 3.3% |
| Immigrants | Netherlands | 1.1 /100 | #240 | Tragic 3.3% |
| Samoans | 1.1 /100 | #241 | Tragic 3.3% |
| Yugoslavians | 1.0 /100 | #242 | Tragic 3.3% |
| Immigrants | Western Europe | 1.0 /100 | #243 | Tragic 3.3% |
| Assyrians/Chaldeans/Syriacs | 0.9 /100 | #244 | Tragic 3.3% |
| Immigrants | Scotland | 0.8 /100 | #245 | Tragic 3.3% |
| Immigrants | England | 0.7 /100 | #246 | Tragic 3.3% |
Demographics Similar to South American Indians by Hearing Disability
In terms of hearing disability, the demographic groups most similar to South American Indians are Immigrants from Western Asia (2.9%, a difference of 0.0%), Immigrants from Uganda (2.9%, a difference of 0.050%), Immigrants from Vietnam (2.9%, a difference of 0.070%), Immigrants from Kenya (2.9%, a difference of 0.16%), and Chilean (2.9%, a difference of 0.21%).
| Demographics | Rating | Rank | Hearing Disability |
| Jordanians | 89.5 /100 | #120 | Excellent 2.8% |
| Cubans | 89.4 /100 | #121 | Excellent 2.8% |
| Liberians | 89.0 /100 | #122 | Excellent 2.8% |
| Immigrants | Zaire | 88.6 /100 | #123 | Excellent 2.9% |
| Bahamians | 88.6 /100 | #124 | Excellent 2.9% |
| Immigrants | Albania | 88.5 /100 | #125 | Excellent 2.9% |
| Immigrants | Sudan | 87.8 /100 | #126 | Excellent 2.9% |
| South American Indians | 86.9 /100 | #127 | Excellent 2.9% |
| Immigrants | Western Asia | 86.9 /100 | #128 | Excellent 2.9% |
| Immigrants | Uganda | 86.6 /100 | #129 | Excellent 2.9% |
| Immigrants | Vietnam | 86.5 /100 | #130 | Excellent 2.9% |
| Immigrants | Kenya | 86.1 /100 | #131 | Excellent 2.9% |
| Chileans | 85.8 /100 | #132 | Excellent 2.9% |
| Immigrants | Syria | 85.8 /100 | #133 | Excellent 2.9% |
| Ugandans | 85.5 /100 | #134 | Excellent 2.9% |