Nepalese vs Subsaharan African 3rd Grade
COMPARE
Nepalese
Subsaharan African
3rd Grade
3rd Grade Comparison
Nepalese
Sub-Saharan Africans
95.9%
3RD GRADE
0.0/ 100
METRIC RATING
340th/ 347
METRIC RANK
97.5%
3RD GRADE
3.2/ 100
METRIC RATING
228th/ 347
METRIC RANK
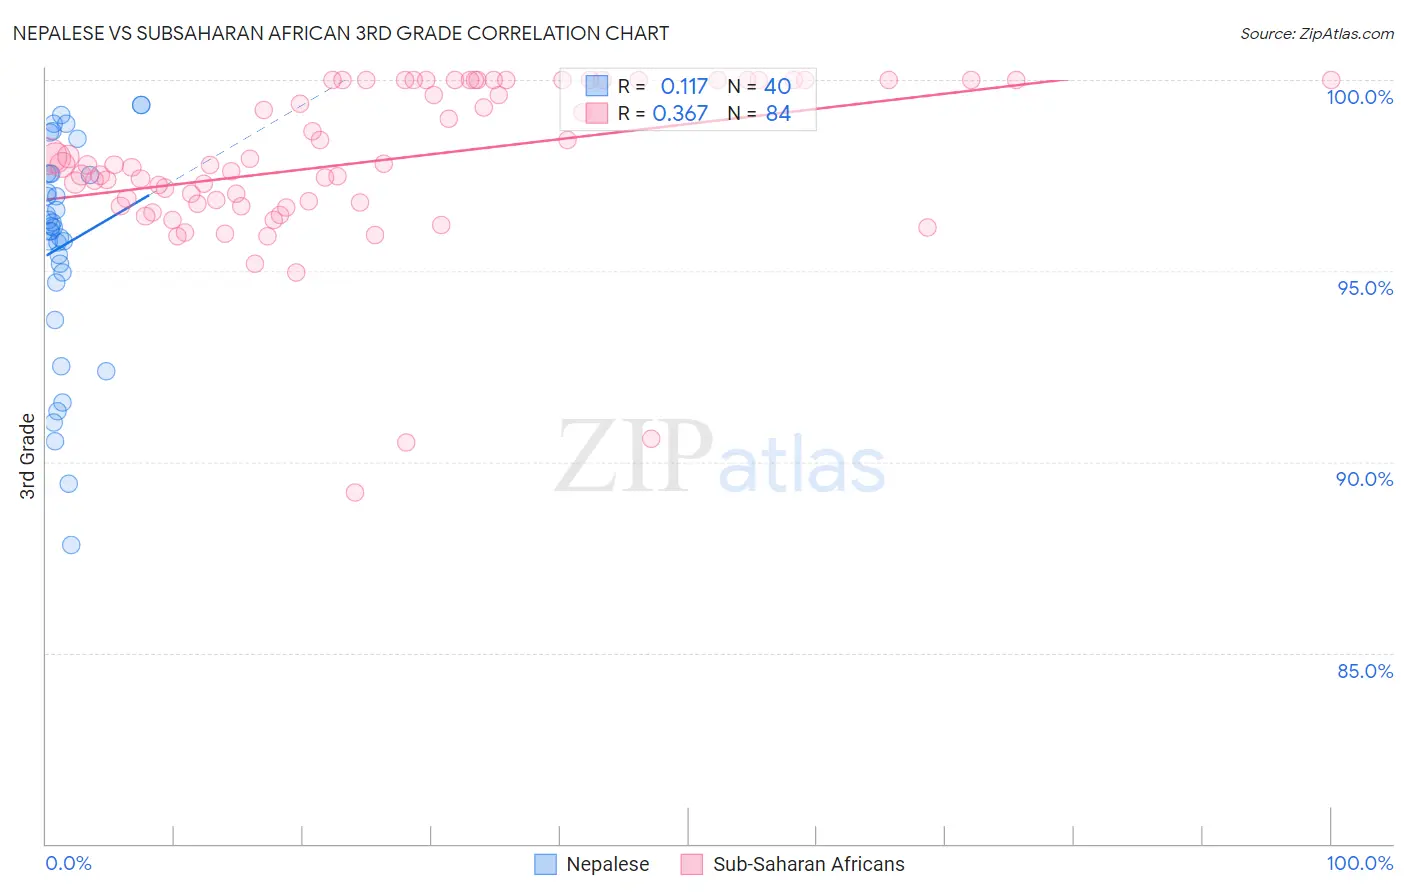
Nepalese vs Subsaharan African 3rd Grade Correlation Chart
The statistical analysis conducted on geographies consisting of 24,521,755 people shows a poor positive correlation between the proportion of Nepalese and percentage of population with at least 3rd grade education in the United States with a correlation coefficient (R) of 0.117 and weighted average of 95.9%. Similarly, the statistical analysis conducted on geographies consisting of 508,209,936 people shows a mild positive correlation between the proportion of Sub-Saharan Africans and percentage of population with at least 3rd grade education in the United States with a correlation coefficient (R) of 0.367 and weighted average of 97.5%, a difference of 1.7%.
3rd Grade Correlation Summary
| Measurement | Nepalese | Subsaharan African |
| Minimum | 87.8% | 89.2% |
| Maximum | 99.3% | 100.0% |
| Range | 11.5% | 10.8% |
| Mean | 95.7% | 97.9% |
| Median | 96.2% | 97.8% |
| Interquartile 25% (IQ1) | 94.8% | 96.8% |
| Interquartile 75% (IQ3) | 97.5% | 100.0% |
| Interquartile Range (IQR) | 2.7% | 3.2% |
| Standard Deviation (Sample) | 2.9% | 2.1% |
| Standard Deviation (Population) | 2.8% | 2.1% |
Similar Demographics by 3rd Grade
Demographics Similar to Nepalese by 3rd Grade
In terms of 3rd grade, the demographic groups most similar to Nepalese are Immigrants from Central America (95.8%, a difference of 0.060%), Immigrants from Guatemala (95.8%, a difference of 0.060%), Yakama (95.9%, a difference of 0.080%), Immigrants from Mexico (95.8%, a difference of 0.090%), and Guatemalan (96.0%, a difference of 0.11%).
| Demographics | Rating | Rank | 3rd Grade |
| Immigrants | Fiji | 0.0 /100 | #333 | Tragic 96.2% |
| Immigrants | Cambodia | 0.0 /100 | #334 | Tragic 96.2% |
| Immigrants | Dominican Republic | 0.0 /100 | #335 | Tragic 96.2% |
| Immigrants | Cabo Verde | 0.0 /100 | #336 | Tragic 96.2% |
| Central Americans | 0.0 /100 | #337 | Tragic 96.1% |
| Guatemalans | 0.0 /100 | #338 | Tragic 96.0% |
| Yakama | 0.0 /100 | #339 | Tragic 95.9% |
| Nepalese | 0.0 /100 | #340 | Tragic 95.9% |
| Immigrants | Central America | 0.0 /100 | #341 | Tragic 95.8% |
| Immigrants | Guatemala | 0.0 /100 | #342 | Tragic 95.8% |
| Immigrants | Mexico | 0.0 /100 | #343 | Tragic 95.8% |
| Salvadorans | 0.0 /100 | #344 | Tragic 95.7% |
| Immigrants | Yemen | 0.0 /100 | #345 | Tragic 95.6% |
| Immigrants | El Salvador | 0.0 /100 | #346 | Tragic 95.5% |
| Spanish American Indians | 0.0 /100 | #347 | Tragic 95.3% |
Demographics Similar to Sub-Saharan Africans by 3rd Grade
In terms of 3rd grade, the demographic groups most similar to Sub-Saharan Africans are Immigrants from Sudan (97.5%, a difference of 0.010%), Senegalese (97.5%, a difference of 0.010%), Immigrants from Pakistan (97.5%, a difference of 0.010%), Immigrants from Costa Rica (97.5%, a difference of 0.010%), and Sudanese (97.5%, a difference of 0.020%).
| Demographics | Rating | Rank | 3rd Grade |
| Uruguayans | 5.0 /100 | #221 | Tragic 97.5% |
| Sierra Leoneans | 4.6 /100 | #222 | Tragic 97.5% |
| Immigrants | Syria | 4.4 /100 | #223 | Tragic 97.5% |
| Bahamians | 4.4 /100 | #224 | Tragic 97.5% |
| Tongans | 4.3 /100 | #225 | Tragic 97.5% |
| Sudanese | 4.1 /100 | #226 | Tragic 97.5% |
| Immigrants | Sudan | 3.4 /100 | #227 | Tragic 97.5% |
| Sub-Saharan Africans | 3.2 /100 | #228 | Tragic 97.5% |
| Senegalese | 3.0 /100 | #229 | Tragic 97.5% |
| Immigrants | Pakistan | 2.7 /100 | #230 | Tragic 97.5% |
| Immigrants | Costa Rica | 2.7 /100 | #231 | Tragic 97.5% |
| Immigrants | Western Asia | 2.6 /100 | #232 | Tragic 97.5% |
| Immigrants | Malaysia | 2.4 /100 | #233 | Tragic 97.5% |
| Immigrants | Eastern Asia | 1.9 /100 | #234 | Tragic 97.4% |
| Immigrants | Iraq | 1.8 /100 | #235 | Tragic 97.4% |