Immigrants from South Eastern Asia vs Subsaharan African Hearing Disability
COMPARE
Immigrants from South Eastern Asia
Subsaharan African
Hearing Disability
Hearing Disability Comparison
Immigrants from South Eastern Asia
Sub-Saharan Africans
3.0%
HEARING DISABILITY
62.9/ 100
METRIC RATING
166th/ 347
METRIC RANK
2.9%
HEARING DISABILITY
83.3/ 100
METRIC RATING
141st/ 347
METRIC RANK
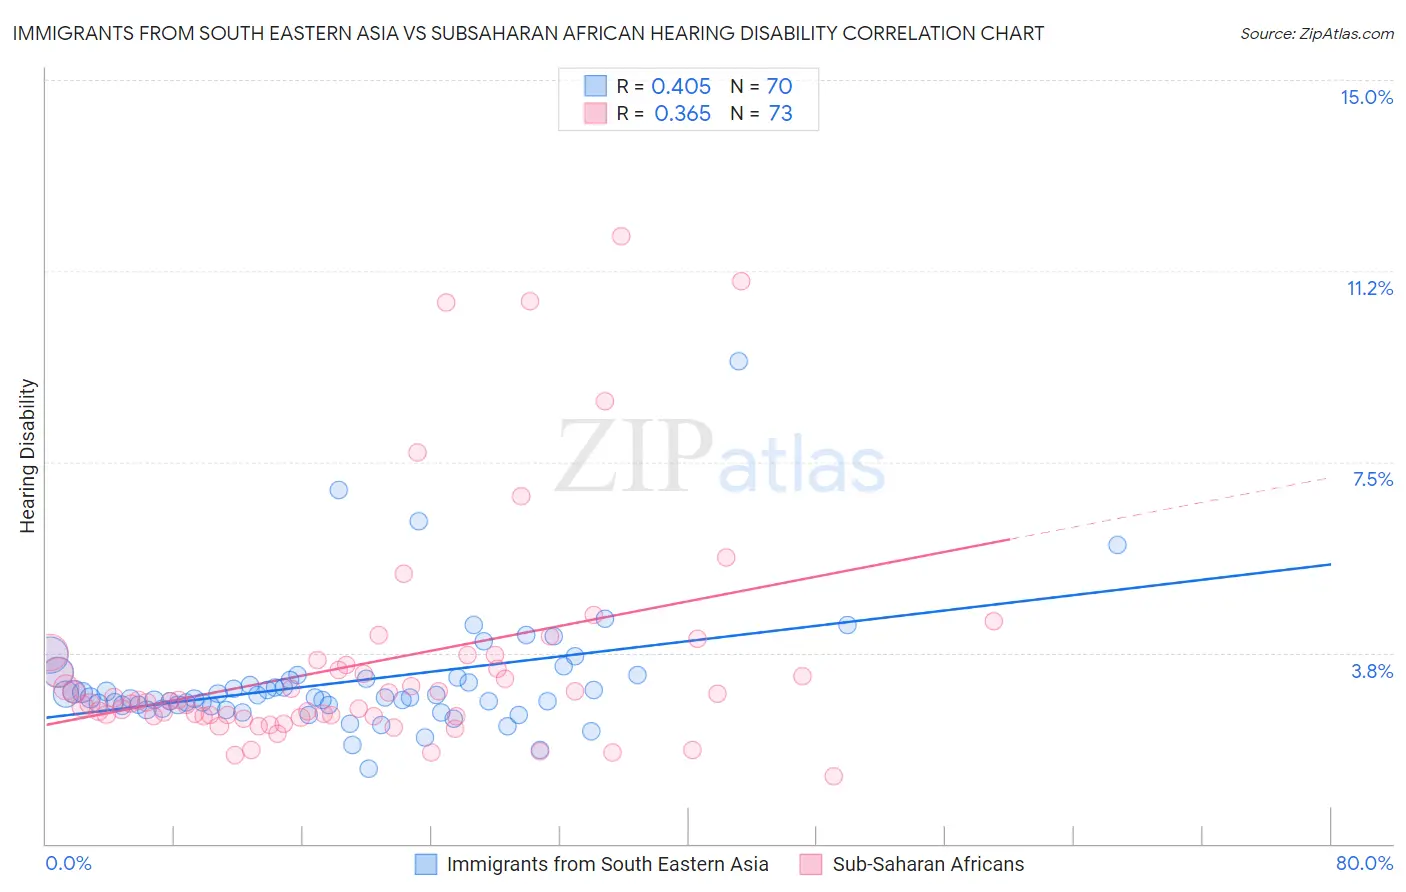
Immigrants from South Eastern Asia vs Subsaharan African Hearing Disability Correlation Chart
The statistical analysis conducted on geographies consisting of 512,290,375 people shows a moderate positive correlation between the proportion of Immigrants from South Eastern Asia and percentage of population with hearing disability in the United States with a correlation coefficient (R) of 0.405 and weighted average of 3.0%. Similarly, the statistical analysis conducted on geographies consisting of 507,755,219 people shows a mild positive correlation between the proportion of Sub-Saharan Africans and percentage of population with hearing disability in the United States with a correlation coefficient (R) of 0.365 and weighted average of 2.9%, a difference of 2.6%.
Hearing Disability Correlation Summary
| Measurement | Immigrants from South Eastern Asia | Subsaharan African |
| Minimum | 1.5% | 1.3% |
| Maximum | 9.5% | 11.9% |
| Range | 8.0% | 10.6% |
| Mean | 3.2% | 3.5% |
| Median | 2.9% | 2.8% |
| Interquartile 25% (IQ1) | 2.7% | 2.5% |
| Interquartile 75% (IQ3) | 3.2% | 3.6% |
| Interquartile Range (IQR) | 0.53% | 1.0% |
| Standard Deviation (Sample) | 1.2% | 2.2% |
| Standard Deviation (Population) | 1.2% | 2.2% |
Similar Demographics by Hearing Disability
Demographics Similar to Immigrants from South Eastern Asia by Hearing Disability
In terms of hearing disability, the demographic groups most similar to Immigrants from South Eastern Asia are Immigrants from Zimbabwe (3.0%, a difference of 0.14%), Immigrants from Cambodia (3.0%, a difference of 0.20%), Immigrants from Central America (3.0%, a difference of 0.21%), Immigrants from Japan (2.9%, a difference of 0.36%), and Albanian (2.9%, a difference of 0.39%).
| Demographics | Rating | Rank | Hearing Disability |
| Immigrants | Australia | 67.4 /100 | #159 | Good 2.9% |
| Immigrants | Fiji | 67.1 /100 | #160 | Good 2.9% |
| Albanians | 66.6 /100 | #161 | Good 2.9% |
| Immigrants | Japan | 66.3 /100 | #162 | Good 2.9% |
| Immigrants | Central America | 64.9 /100 | #163 | Good 3.0% |
| Immigrants | Cambodia | 64.8 /100 | #164 | Good 3.0% |
| Immigrants | Zimbabwe | 64.2 /100 | #165 | Good 3.0% |
| Immigrants | South Eastern Asia | 62.9 /100 | #166 | Good 3.0% |
| Immigrants | Eastern Europe | 58.1 /100 | #167 | Average 3.0% |
| Immigrants | Greece | 57.9 /100 | #168 | Average 3.0% |
| Arabs | 57.6 /100 | #169 | Average 3.0% |
| Immigrants | Cabo Verde | 56.9 /100 | #170 | Average 3.0% |
| Immigrants | Ukraine | 56.6 /100 | #171 | Average 3.0% |
| Armenians | 56.0 /100 | #172 | Average 3.0% |
| Immigrants | Serbia | 51.1 /100 | #173 | Average 3.0% |
Demographics Similar to Sub-Saharan Africans by Hearing Disability
In terms of hearing disability, the demographic groups most similar to Sub-Saharan Africans are Immigrants from Jordan (2.9%, a difference of 0.070%), Bermudan (2.9%, a difference of 0.090%), Immigrants from Costa Rica (2.9%, a difference of 0.13%), Sri Lankan (2.9%, a difference of 0.14%), and Immigrants from Brazil (2.9%, a difference of 0.24%).
| Demographics | Rating | Rank | Hearing Disability |
| Ugandans | 85.5 /100 | #134 | Excellent 2.9% |
| Soviet Union | 84.8 /100 | #135 | Excellent 2.9% |
| Immigrants | Brazil | 84.6 /100 | #136 | Excellent 2.9% |
| Sri Lankans | 84.1 /100 | #137 | Excellent 2.9% |
| Immigrants | Costa Rica | 84.0 /100 | #138 | Excellent 2.9% |
| Bermudans | 83.8 /100 | #139 | Excellent 2.9% |
| Immigrants | Jordan | 83.7 /100 | #140 | Excellent 2.9% |
| Sub-Saharan Africans | 83.3 /100 | #141 | Excellent 2.9% |
| Laotians | 81.1 /100 | #142 | Excellent 2.9% |
| Immigrants | Bahamas | 80.9 /100 | #143 | Excellent 2.9% |
| Immigrants | Bulgaria | 79.2 /100 | #144 | Good 2.9% |
| Immigrants | Congo | 78.9 /100 | #145 | Good 2.9% |
| Brazilians | 78.7 /100 | #146 | Good 2.9% |
| Tongans | 78.6 /100 | #147 | Good 2.9% |
| Immigrants | Russia | 77.7 /100 | #148 | Good 2.9% |