Immigrants from Colombia vs Subsaharan African Hearing Disability
COMPARE
Immigrants from Colombia
Subsaharan African
Hearing Disability
Hearing Disability Comparison
Immigrants from Colombia
Sub-Saharan Africans
2.7%
HEARING DISABILITY
98.4/ 100
METRIC RATING
62nd/ 347
METRIC RANK
2.9%
HEARING DISABILITY
83.3/ 100
METRIC RATING
141st/ 347
METRIC RANK
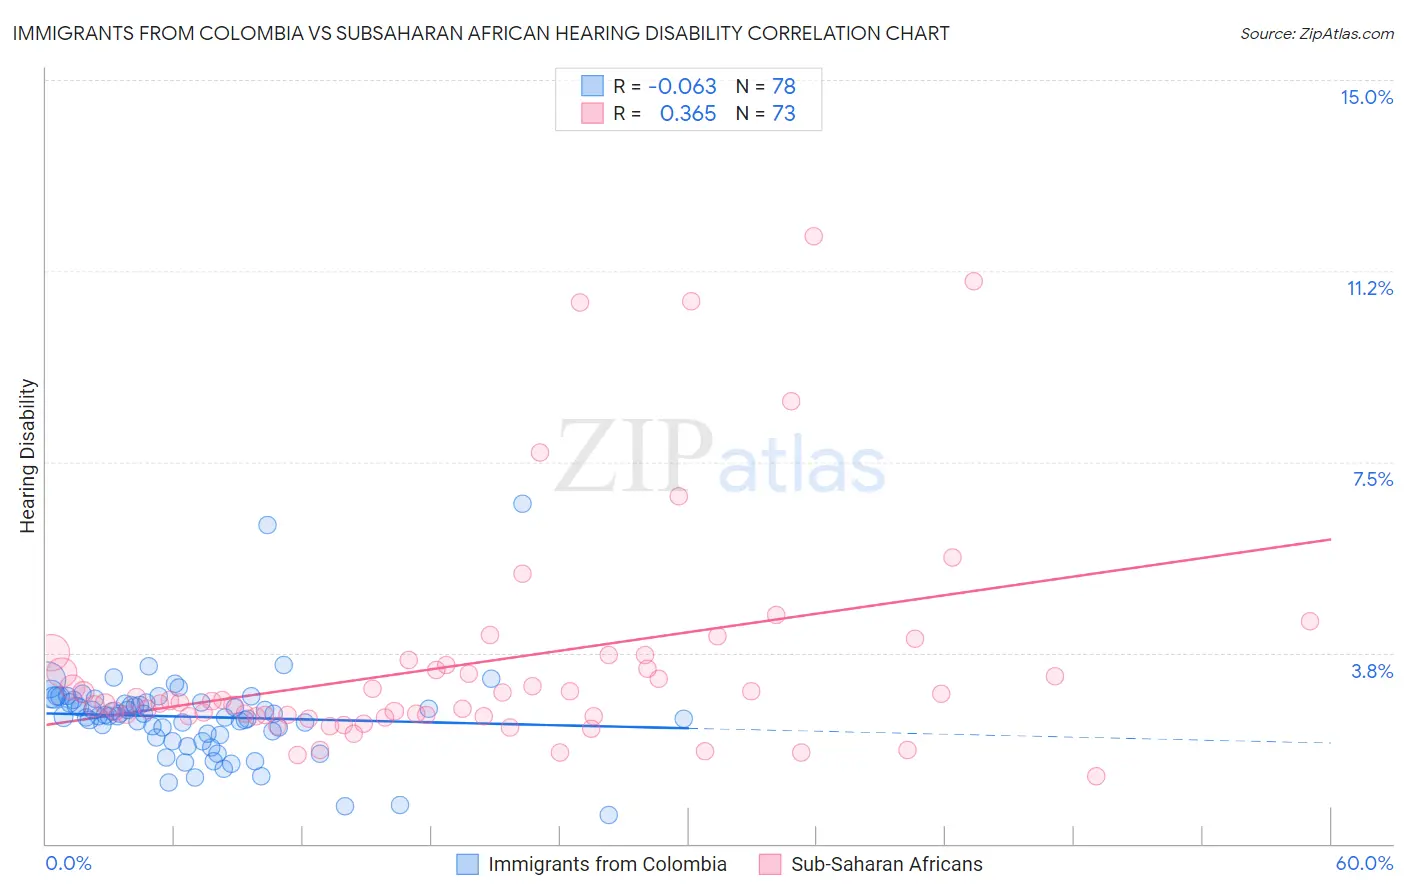
Immigrants from Colombia vs Subsaharan African Hearing Disability Correlation Chart
The statistical analysis conducted on geographies consisting of 378,548,694 people shows a slight negative correlation between the proportion of Immigrants from Colombia and percentage of population with hearing disability in the United States with a correlation coefficient (R) of -0.063 and weighted average of 2.7%. Similarly, the statistical analysis conducted on geographies consisting of 507,755,219 people shows a mild positive correlation between the proportion of Sub-Saharan Africans and percentage of population with hearing disability in the United States with a correlation coefficient (R) of 0.365 and weighted average of 2.9%, a difference of 6.6%.
Hearing Disability Correlation Summary
| Measurement | Immigrants from Colombia | Subsaharan African |
| Minimum | 0.57% | 1.3% |
| Maximum | 6.7% | 11.9% |
| Range | 6.1% | 10.6% |
| Mean | 2.5% | 3.5% |
| Median | 2.5% | 2.8% |
| Interquartile 25% (IQ1) | 2.1% | 2.5% |
| Interquartile 75% (IQ3) | 2.8% | 3.6% |
| Interquartile Range (IQR) | 0.62% | 1.0% |
| Standard Deviation (Sample) | 0.89% | 2.2% |
| Standard Deviation (Population) | 0.88% | 2.2% |
Similar Demographics by Hearing Disability
Demographics Similar to Immigrants from Colombia by Hearing Disability
In terms of hearing disability, the demographic groups most similar to Immigrants from Colombia are Immigrants from Uzbekistan (2.7%, a difference of 0.0%), Indian (Asian) (2.7%, a difference of 0.050%), Immigrants from Sri Lanka (2.7%, a difference of 0.11%), Immigrants from Egypt (2.7%, a difference of 0.14%), and Immigrants from Nepal (2.7%, a difference of 0.19%).
| Demographics | Rating | Rank | Hearing Disability |
| Immigrants | Ethiopia | 99.0 /100 | #55 | Exceptional 2.7% |
| Immigrants | Nicaragua | 99.0 /100 | #56 | Exceptional 2.7% |
| South Americans | 99.0 /100 | #57 | Exceptional 2.7% |
| Immigrants | Peru | 98.6 /100 | #58 | Exceptional 2.7% |
| Immigrants | Eritrea | 98.5 /100 | #59 | Exceptional 2.7% |
| Immigrants | Egypt | 98.5 /100 | #60 | Exceptional 2.7% |
| Immigrants | Uzbekistan | 98.4 /100 | #61 | Exceptional 2.7% |
| Immigrants | Colombia | 98.4 /100 | #62 | Exceptional 2.7% |
| Indians (Asian) | 98.4 /100 | #63 | Exceptional 2.7% |
| Immigrants | Sri Lanka | 98.4 /100 | #64 | Exceptional 2.7% |
| Immigrants | Nepal | 98.3 /100 | #65 | Exceptional 2.7% |
| Immigrants | Belize | 98.2 /100 | #66 | Exceptional 2.7% |
| Egyptians | 98.1 /100 | #67 | Exceptional 2.7% |
| Immigrants | Africa | 98.0 /100 | #68 | Exceptional 2.7% |
| Nicaraguans | 97.9 /100 | #69 | Exceptional 2.7% |
Demographics Similar to Sub-Saharan Africans by Hearing Disability
In terms of hearing disability, the demographic groups most similar to Sub-Saharan Africans are Immigrants from Jordan (2.9%, a difference of 0.070%), Bermudan (2.9%, a difference of 0.090%), Immigrants from Costa Rica (2.9%, a difference of 0.13%), Sri Lankan (2.9%, a difference of 0.14%), and Immigrants from Brazil (2.9%, a difference of 0.24%).
| Demographics | Rating | Rank | Hearing Disability |
| Ugandans | 85.5 /100 | #134 | Excellent 2.9% |
| Soviet Union | 84.8 /100 | #135 | Excellent 2.9% |
| Immigrants | Brazil | 84.6 /100 | #136 | Excellent 2.9% |
| Sri Lankans | 84.1 /100 | #137 | Excellent 2.9% |
| Immigrants | Costa Rica | 84.0 /100 | #138 | Excellent 2.9% |
| Bermudans | 83.8 /100 | #139 | Excellent 2.9% |
| Immigrants | Jordan | 83.7 /100 | #140 | Excellent 2.9% |
| Sub-Saharan Africans | 83.3 /100 | #141 | Excellent 2.9% |
| Laotians | 81.1 /100 | #142 | Excellent 2.9% |
| Immigrants | Bahamas | 80.9 /100 | #143 | Excellent 2.9% |
| Immigrants | Bulgaria | 79.2 /100 | #144 | Good 2.9% |
| Immigrants | Congo | 78.9 /100 | #145 | Good 2.9% |
| Brazilians | 78.7 /100 | #146 | Good 2.9% |
| Tongans | 78.6 /100 | #147 | Good 2.9% |
| Immigrants | Russia | 77.7 /100 | #148 | Good 2.9% |