Nepalese vs Immigrants from Peru Hearing Disability
COMPARE
Nepalese
Immigrants from Peru
Hearing Disability
Hearing Disability Comparison
Nepalese
Immigrants from Peru
3.3%
HEARING DISABILITY
1.2/ 100
METRIC RATING
239th/ 347
METRIC RANK
2.7%
HEARING DISABILITY
98.6/ 100
METRIC RATING
58th/ 347
METRIC RANK
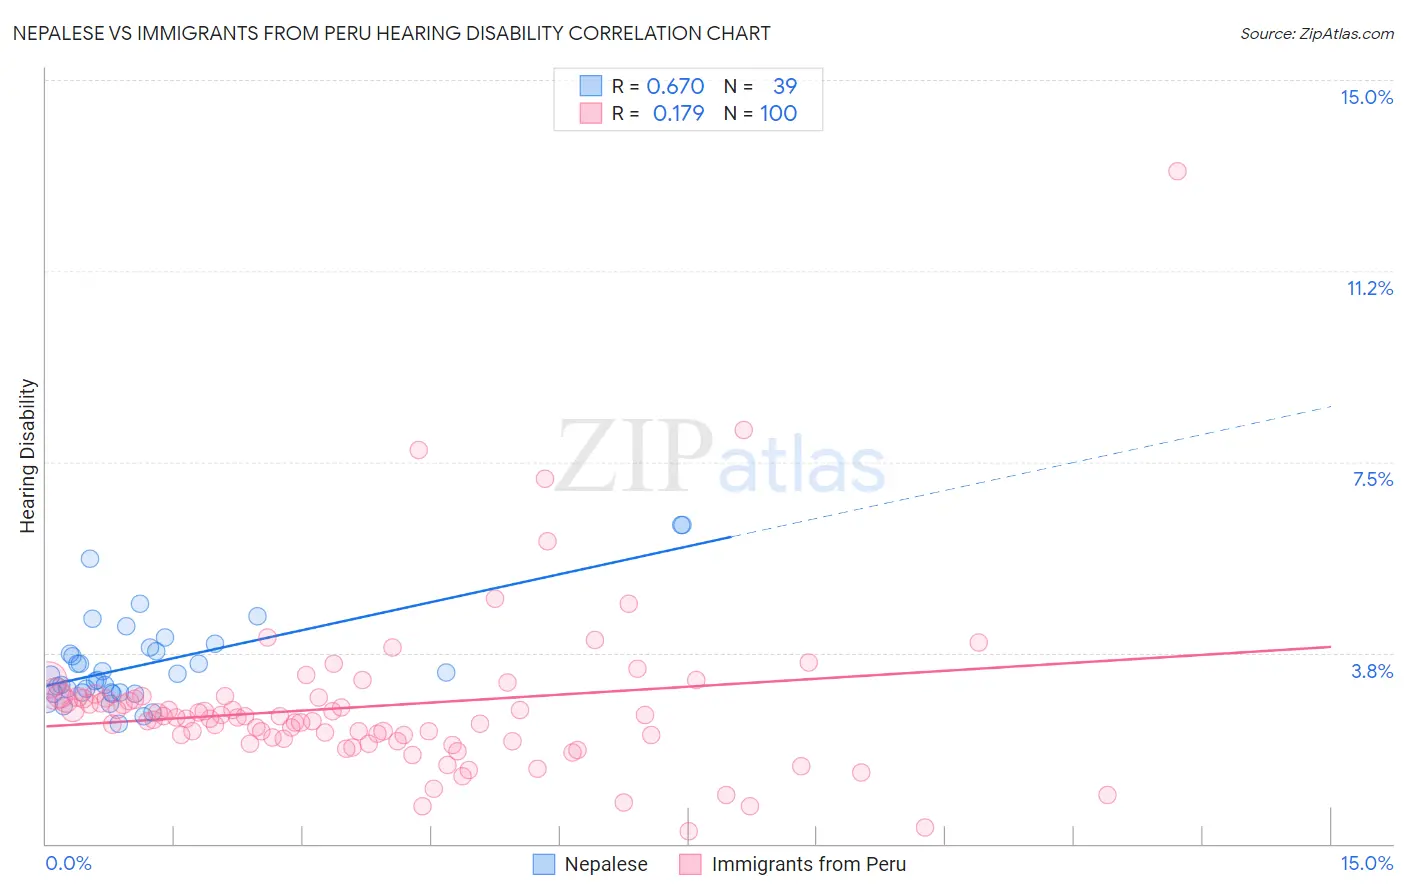
Nepalese vs Immigrants from Peru Hearing Disability Correlation Chart
The statistical analysis conducted on geographies consisting of 24,517,800 people shows a significant positive correlation between the proportion of Nepalese and percentage of population with hearing disability in the United States with a correlation coefficient (R) of 0.670 and weighted average of 3.3%. Similarly, the statistical analysis conducted on geographies consisting of 328,787,058 people shows a poor positive correlation between the proportion of Immigrants from Peru and percentage of population with hearing disability in the United States with a correlation coefficient (R) of 0.179 and weighted average of 2.7%, a difference of 22.6%.
Hearing Disability Correlation Summary
| Measurement | Nepalese | Immigrants from Peru |
| Minimum | 2.4% | 0.24% |
| Maximum | 6.3% | 13.2% |
| Range | 3.9% | 13.0% |
| Mean | 3.5% | 2.7% |
| Median | 3.3% | 2.5% |
| Interquartile 25% (IQ1) | 3.0% | 2.0% |
| Interquartile 75% (IQ3) | 3.9% | 2.9% |
| Interquartile Range (IQR) | 0.90% | 0.85% |
| Standard Deviation (Sample) | 0.92% | 1.6% |
| Standard Deviation (Population) | 0.91% | 1.6% |
Similar Demographics by Hearing Disability
Demographics Similar to Nepalese by Hearing Disability
In terms of hearing disability, the demographic groups most similar to Nepalese are Immigrants from Netherlands (3.3%, a difference of 0.18%), Samoan (3.3%, a difference of 0.25%), Yugoslavian (3.3%, a difference of 0.36%), Immigrants from Western Europe (3.3%, a difference of 0.53%), and Assyrian/Chaldean/Syriac (3.3%, a difference of 0.60%).
| Demographics | Rating | Rank | Hearing Disability |
| Ukrainians | 2.9 /100 | #232 | Tragic 3.2% |
| Estonians | 2.4 /100 | #233 | Tragic 3.3% |
| Central American Indians | 2.3 /100 | #234 | Tragic 3.3% |
| Guamanians/Chamorros | 2.2 /100 | #235 | Tragic 3.3% |
| Serbians | 2.2 /100 | #236 | Tragic 3.3% |
| Immigrants | Austria | 1.8 /100 | #237 | Tragic 3.3% |
| German Russians | 1.8 /100 | #238 | Tragic 3.3% |
| Nepalese | 1.2 /100 | #239 | Tragic 3.3% |
| Immigrants | Netherlands | 1.1 /100 | #240 | Tragic 3.3% |
| Samoans | 1.1 /100 | #241 | Tragic 3.3% |
| Yugoslavians | 1.0 /100 | #242 | Tragic 3.3% |
| Immigrants | Western Europe | 1.0 /100 | #243 | Tragic 3.3% |
| Assyrians/Chaldeans/Syriacs | 0.9 /100 | #244 | Tragic 3.3% |
| Immigrants | Scotland | 0.8 /100 | #245 | Tragic 3.3% |
| Immigrants | England | 0.7 /100 | #246 | Tragic 3.3% |
Demographics Similar to Immigrants from Peru by Hearing Disability
In terms of hearing disability, the demographic groups most similar to Immigrants from Peru are Immigrants from Eritrea (2.7%, a difference of 0.11%), Immigrants from Egypt (2.7%, a difference of 0.18%), Immigrants from Uzbekistan (2.7%, a difference of 0.31%), Immigrants from Colombia (2.7%, a difference of 0.32%), and Indian (Asian) (2.7%, a difference of 0.37%).
| Demographics | Rating | Rank | Hearing Disability |
| Immigrants | Hong Kong | 99.2 /100 | #51 | Exceptional 2.7% |
| Jamaicans | 99.0 /100 | #52 | Exceptional 2.7% |
| Immigrants | Eastern Asia | 99.0 /100 | #53 | Exceptional 2.7% |
| Ethiopians | 99.0 /100 | #54 | Exceptional 2.7% |
| Immigrants | Ethiopia | 99.0 /100 | #55 | Exceptional 2.7% |
| Immigrants | Nicaragua | 99.0 /100 | #56 | Exceptional 2.7% |
| South Americans | 99.0 /100 | #57 | Exceptional 2.7% |
| Immigrants | Peru | 98.6 /100 | #58 | Exceptional 2.7% |
| Immigrants | Eritrea | 98.5 /100 | #59 | Exceptional 2.7% |
| Immigrants | Egypt | 98.5 /100 | #60 | Exceptional 2.7% |
| Immigrants | Uzbekistan | 98.4 /100 | #61 | Exceptional 2.7% |
| Immigrants | Colombia | 98.4 /100 | #62 | Exceptional 2.7% |
| Indians (Asian) | 98.4 /100 | #63 | Exceptional 2.7% |
| Immigrants | Sri Lanka | 98.4 /100 | #64 | Exceptional 2.7% |
| Immigrants | Nepal | 98.3 /100 | #65 | Exceptional 2.7% |