Zip Codes with the Highest Percentage of Population Employed in Arts, Media & Entertainment in Danbury, CT
RELATED REPORTS & OPTIONS
Arts, Media & Entertainment
Danbury
Compare Zip Codes
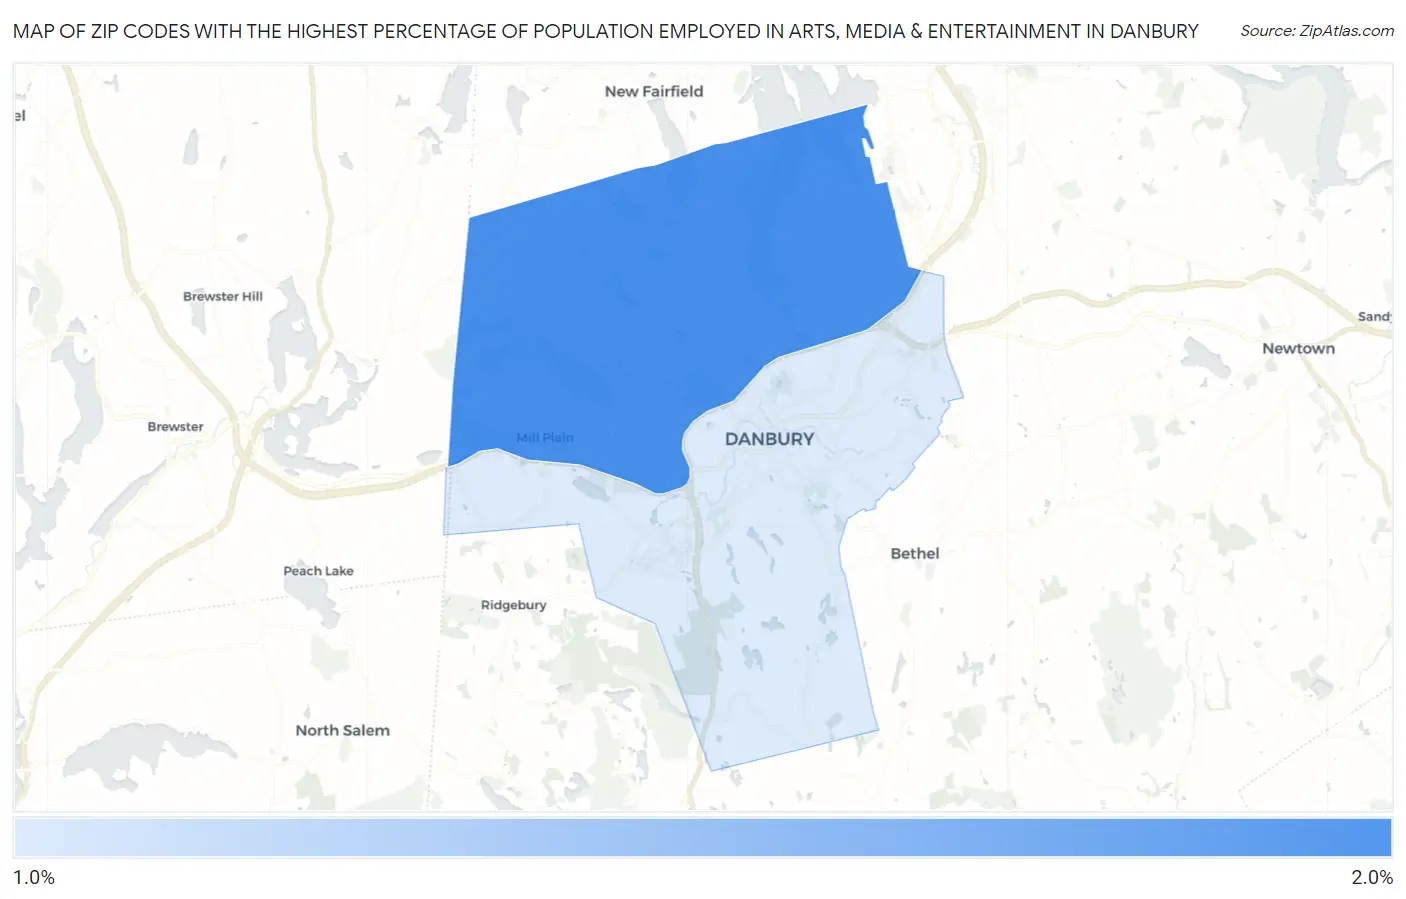
Map of Zip Codes with the Highest Percentage of Population Employed in Arts, Media & Entertainment in Danbury
1.6%
1.9%
Zip Codes with the Highest Percentage of Population Employed in Arts, Media & Entertainment in Danbury, CT
| Zip Code | % Employed | vs State | vs National | |
| 1. | 06811 | 1.9% | 2.2%(-0.287)#141 | 2.1%(-0.173)#8,454 |
| 2. | 06810 | 1.6% | 2.2%(-0.571)#168 | 2.1%(-0.457)#10,314 |
1
Common Questions
What are the Top Zip Codes with the Highest Percentage of Population Employed in Arts, Media & Entertainment in Danbury, CT?
Top Zip Codes with the Highest Percentage of Population Employed in Arts, Media & Entertainment in Danbury, CT are:
What zip code has the Highest Percentage of Population Employed in Arts, Media & Entertainment in Danbury, CT?
06811 has the Highest Percentage of Population Employed in Arts, Media & Entertainment in Danbury, CT with 1.9%.
What is the Percentage of Population Employed in Arts, Media & Entertainment in Danbury, CT?
Percentage of Population Employed in Arts, Media & Entertainment in Danbury is 1.7%.
What is the Percentage of Population Employed in Arts, Media & Entertainment in Connecticut?
Percentage of Population Employed in Arts, Media & Entertainment in Connecticut is 2.2%.
What is the Percentage of Population Employed in Arts, Media & Entertainment in the United States?
Percentage of Population Employed in Arts, Media & Entertainment in the United States is 2.1%.