Zip Codes with the Highest Percentage of Self-Employed / Not Incorporated in Surprise, AZ

RELATED REPORTS & OPTIONS

Self-Employed / Not Incorporated
Population
Families and Households
Female Fertility
Female Fertility (Unmarried)
Race (Community Size)
Race (Percentage)
Ancestry (Community Size)
AfricanAmericanApacheArabArgentineanArmenianAssyrian / Chaldean / SyriacAustralianAustrianBelgianBhutaneseBrazilianBritishBulgarianBurmeseCajunCanadianCelticCentral AmericanCherokeeChickasawChileanColombianCosta RicanCroatianCubanCzechCzechoslovakianDanishDominicanDutchEastern EuropeanEnglishEuropeanFilipinoFinnishFrenchFrench CanadianGermanGreekGuamanian / ChamorroGuatemalanHopiHungarianIndian (Asian)IraqiIrishItalianJamaicanJapaneseKoreanLaotianLatvianLebaneseLithuanianMalaysianMexicanMexican American IndianNative HawaiianNavajoNigerianNorthern EuropeanNorwegianPakistaniPanamanianPennsylvania GermanPeruvianPimaPolishPortuguesePuebloPuerto RicanRomanianRussianSalvadoranSamoanScandinavianScotch-IrishScottishSerbianSiouxSlavicSlovakSloveneSouth AmericanSpaniardSpanishSri LankanSubsaharan AfricanSwedishSwissThaiTlingit-HaidaTrinidadian and TobagonianTurkishUkrainianWelshWest Indian
Ancestry (Percentage)
AfricanAmericanApacheArabArgentineanArmenianAssyrian / Chaldean / SyriacAustralianAustrianBelgianBhutaneseBrazilianBritishBulgarianBurmeseCajunCanadianCelticCentral AmericanCherokeeChickasawChileanColombianCosta RicanCroatianCubanCzechCzechoslovakianDanishDominicanDutchEastern EuropeanEnglishEuropeanFilipinoFinnishFrenchFrench CanadianGermanGreekGuamanian / ChamorroGuatemalanHopiHungarianIndian (Asian)IraqiIrishItalianJamaicanJapaneseKoreanLaotianLatvianLebaneseLithuanianMalaysianMexicanMexican American IndianNative HawaiianNavajoNigerianNorthern EuropeanNorwegianPakistaniPanamanianPennsylvania GermanPeruvianPimaPolishPortuguesePuebloPuerto RicanRomanianRussianSalvadoranSamoanScandinavianScotch-IrishScottishSerbianSiouxSlavicSlovakSloveneSouth AmericanSpaniardSpanishSri LankanSubsaharan AfricanSwedishSwissThaiTlingit-HaidaTrinidadian and TobagonianTurkishUkrainianWelshWest Indian
Immigrant Origin (Total)
Immigrant Origin (Percentage)
Income
Income (Families)
Income (Households)
Poverty
Poverty (Families)
Unemployment
Employment Occupations
Employment Industries
Employer Class
Commute Time
Commute Means
School Enrollment
Education by Degree Field
Occupancy
Finances
Physical Characteristics
Surprise
Compare Zip Codes
Comparison Subject

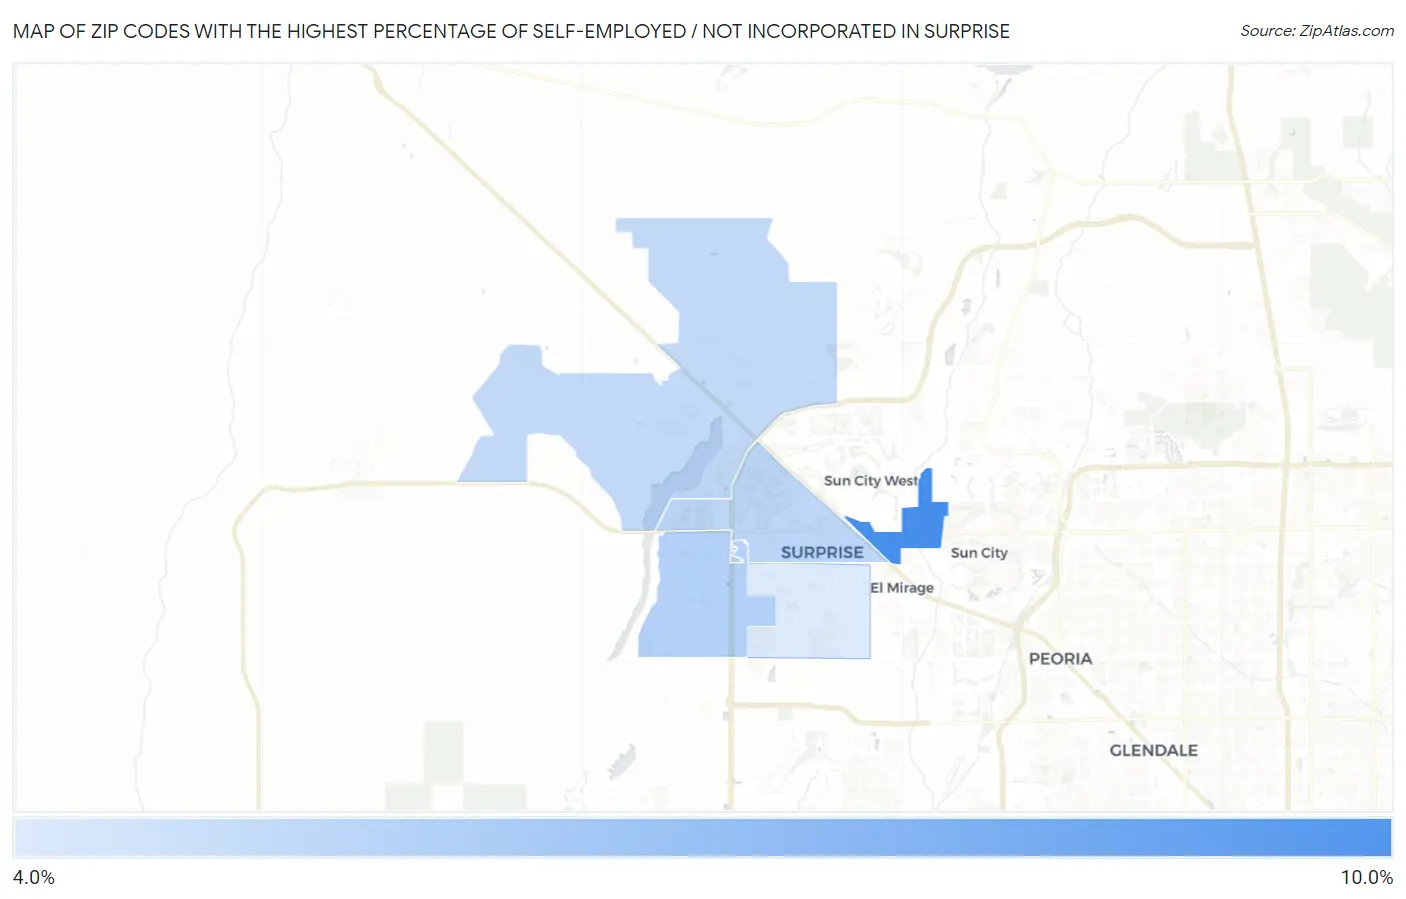
Map of Zip Codes with the Highest Percentage of Self-Employed / Not Incorporated in Surprise

0.0%
10.0%
Zip Codes with the Highest Percentage of Self-Employed / Not Incorporated in Surprise Map

Zip Codes with the Highest Percentage of Self-Employed / Not Incorporated in Surprise, AZ

Zip Code % Self-Employed / Not Incorporated vs State vs National
1.853788.8%5.9%(+2.94)#735.8%(+2.98)#9,145
2.853885.5%5.9%(-0.351)#2095.8%(-0.307)#17,746
3.853745.2%5.9%(-0.673)#2275.8%(-0.629)#18,980
4.853875.1%5.9%(-0.808)#2355.8%(-0.764)#19,469
5.853794.2%5.9%(-1.61)#2705.8%(-1.57)#22,505

Common Questions

What are the Top 3 Zip Codes with the Highest Percentage of Self-Employed / Not Incorporated in Surprise, AZ?
Top 3 Zip Codes with the Highest Percentage of Self-Employed / Not Incorporated in Surprise, AZ are:
#1
8.8%
#2
5.5%
#3
5.2%
What zip code has the Highest Percentage of Self-Employed / Not Incorporated in Surprise, AZ?
85378 has the Highest Percentage of Self-Employed / Not Incorporated in Surprise, AZ with 8.8%.
What is the Percentage of Self-Employed / Not Incorporated in Surprise, AZ?
Percentage of Self-Employed / Not Incorporated in Surprise is 5.1%.
What is the Percentage of Self-Employed / Not Incorporated in Arizona?
Percentage of Self-Employed / Not Incorporated in Arizona is 5.9%.
What is the Percentage of Self-Employed / Not Incorporated in the United States?
Percentage of Self-Employed / Not Incorporated in the United States is 5.8%.