Zip Codes with the Highest Percentage of Population Employed in Accommodation & Food Services in Gilbert, AZ
RELATED REPORTS & OPTIONS
Accommodation & Food Services
Gilbert
Compare Zip Codes
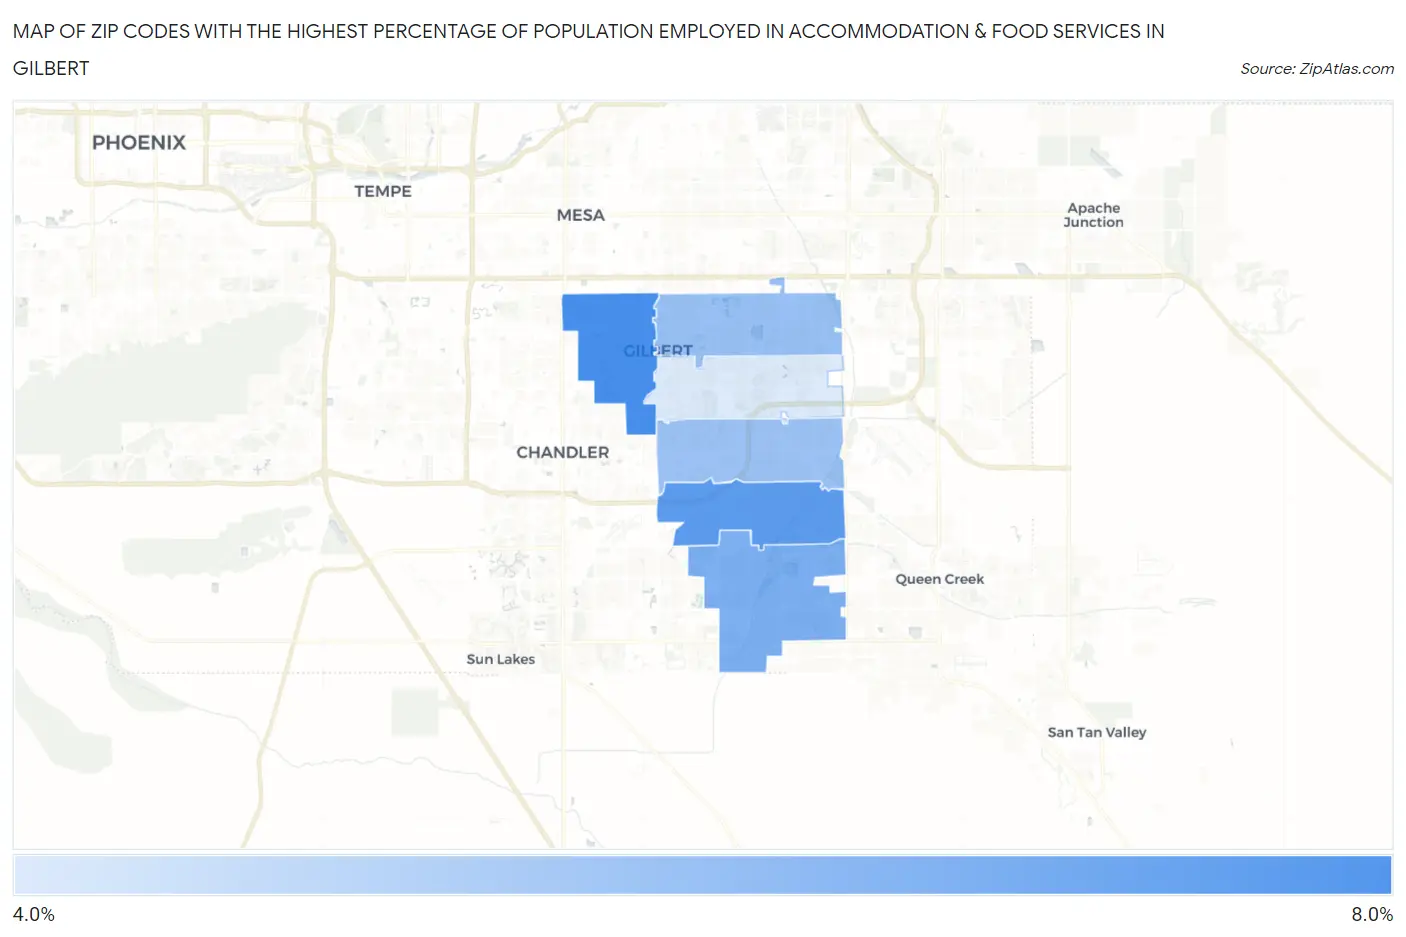
Map of Zip Codes with the Highest Percentage of Population Employed in Accommodation & Food Services in Gilbert
4.7%
6.7%
Zip Codes with the Highest Percentage of Population Employed in Accommodation & Food Services in Gilbert, AZ
| Zip Code | % Employed | vs State | vs National | |
| 1. | 85233 | 6.7% | 7.6%(-0.904)#206 | 6.9%(-0.231)#11,358 |
| 2. | 85297 | 6.4% | 7.6%(-1.13)#217 | 6.9%(-0.460)#12,088 |
| 3. | 85298 | 6.0% | 7.6%(-1.58)#242 | 6.9%(-0.910)#13,529 |
| 4. | 85234 | 5.6% | 7.6%(-1.95)#261 | 6.9%(-1.27)#14,675 |
| 5. | 85295 | 5.6% | 7.6%(-1.97)#262 | 6.9%(-1.30)#14,767 |
| 6. | 85296 | 4.7% | 7.6%(-2.85)#294 | 6.9%(-2.18)#17,811 |
1
Common Questions
What are the Top 5 Zip Codes with the Highest Percentage of Population Employed in Accommodation & Food Services in Gilbert, AZ?
Top 5 Zip Codes with the Highest Percentage of Population Employed in Accommodation & Food Services in Gilbert, AZ are:
What zip code has the Highest Percentage of Population Employed in Accommodation & Food Services in Gilbert, AZ?
85233 has the Highest Percentage of Population Employed in Accommodation & Food Services in Gilbert, AZ with 6.7%.
What is the Percentage of Population Employed in Accommodation & Food Services in Gilbert, AZ?
Percentage of Population Employed in Accommodation & Food Services in Gilbert is 5.8%.
What is the Percentage of Population Employed in Accommodation & Food Services in Arizona?
Percentage of Population Employed in Accommodation & Food Services in Arizona is 7.6%.
What is the Percentage of Population Employed in Accommodation & Food Services in the United States?
Percentage of Population Employed in Accommodation & Food Services in the United States is 6.9%.