Zip Codes with the Highest Percentage of Population Employed in Accommodation & Food Services in Casa Grande, AZ
RELATED REPORTS & OPTIONS
Accommodation & Food Services
Casa Grande
Compare Zip Codes
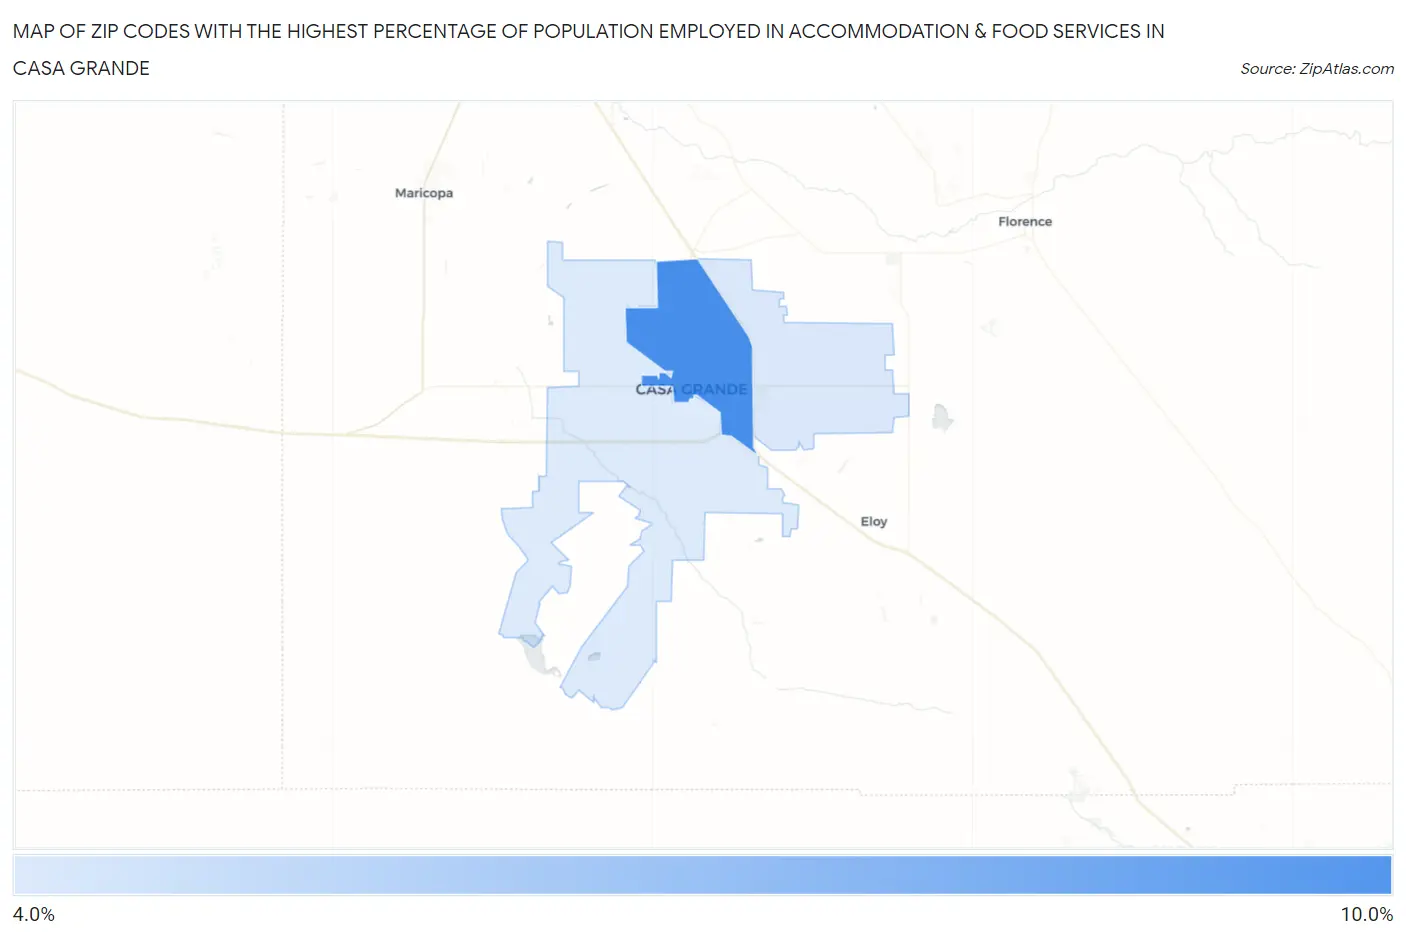
Map of Zip Codes with the Highest Percentage of Population Employed in Accommodation & Food Services in Casa Grande
4.2%
8.1%
Zip Codes with the Highest Percentage of Population Employed in Accommodation & Food Services in Casa Grande, AZ
| Zip Code | % Employed | vs State | vs National | |
| 1. | 85122 | 8.1% | 7.6%(+0.551)#156 | 6.9%(+1.22)#7,618 |
| 2. | 85194 | 4.3% | 7.6%(-3.30)#303 | 6.9%(-2.62)#19,323 |
| 3. | 85193 | 4.2% | 7.6%(-3.36)#306 | 6.9%(-2.69)#19,519 |
1
Common Questions
What are the Top Zip Codes with the Highest Percentage of Population Employed in Accommodation & Food Services in Casa Grande, AZ?
Top Zip Codes with the Highest Percentage of Population Employed in Accommodation & Food Services in Casa Grande, AZ are:
What zip code has the Highest Percentage of Population Employed in Accommodation & Food Services in Casa Grande, AZ?
85122 has the Highest Percentage of Population Employed in Accommodation & Food Services in Casa Grande, AZ with 8.1%.
What is the Percentage of Population Employed in Accommodation & Food Services in Casa Grande, AZ?
Percentage of Population Employed in Accommodation & Food Services in Casa Grande is 8.0%.
What is the Percentage of Population Employed in Accommodation & Food Services in Arizona?
Percentage of Population Employed in Accommodation & Food Services in Arizona is 7.6%.
What is the Percentage of Population Employed in Accommodation & Food Services in the United States?
Percentage of Population Employed in Accommodation & Food Services in the United States is 6.9%.