Zip Codes with the Highest Percentage of Population with a Degree in Liberal Arts and History in Casa Grande, AZ
RELATED REPORTS & OPTIONS
Liberal Arts and History
Casa Grande
Compare Zip Codes
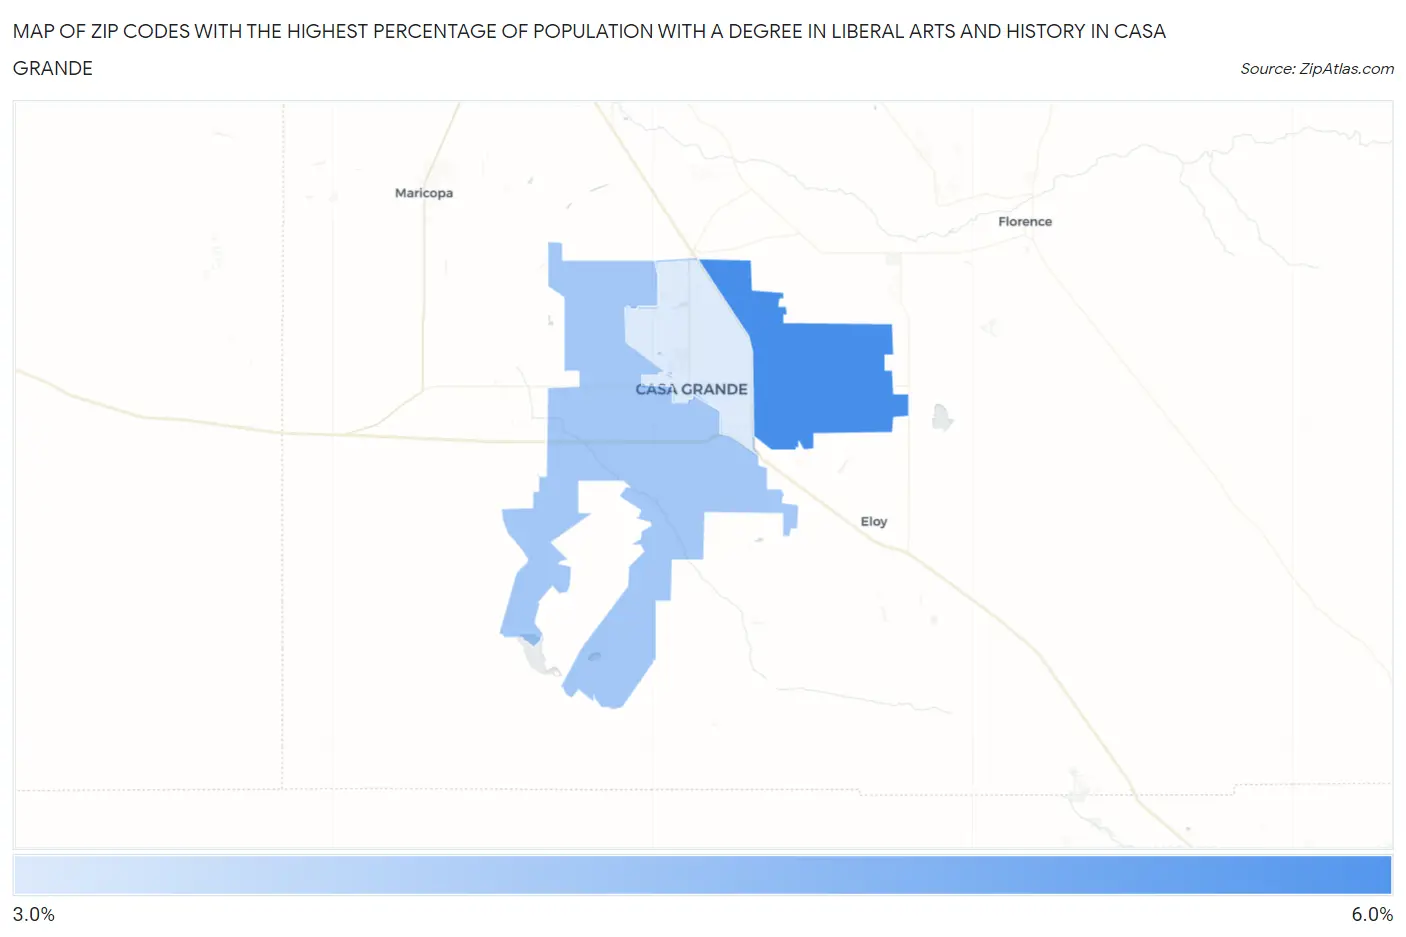
Map of Zip Codes with the Highest Percentage of Population with a Degree in Liberal Arts and History in Casa Grande
3.4%
5.5%
Zip Codes with the Highest Percentage of Population with a Degree in Liberal Arts and History in Casa Grande, AZ
| Zip Code | % Graduates | vs State | vs National | |
| 1. | 85194 | 5.5% | 4.3%(+1.28)#102 | 4.9%(+0.664)#9,768 |
| 2. | 85193 | 4.2% | 4.3%(-0.057)#170 | 4.9%(-0.676)#14,026 |
| 3. | 85122 | 3.4% | 4.3%(-0.885)#219 | 4.9%(-1.50)#17,081 |
1
Common Questions
What are the Top Zip Codes with the Highest Percentage of Population with a Degree in Liberal Arts and History in Casa Grande, AZ?
Top Zip Codes with the Highest Percentage of Population with a Degree in Liberal Arts and History in Casa Grande, AZ are:
What zip code has the Highest Percentage of Population with a Degree in Liberal Arts and History in Casa Grande, AZ?
85194 has the Highest Percentage of Population with a Degree in Liberal Arts and History in Casa Grande, AZ with 5.5%.
What is the Percentage of Population with a Degree in Liberal Arts and History in Casa Grande, AZ?
Percentage of Population with a Degree in Liberal Arts and History in Casa Grande is 3.5%.
What is the Percentage of Population with a Degree in Liberal Arts and History in Arizona?
Percentage of Population with a Degree in Liberal Arts and History in Arizona is 4.3%.
What is the Percentage of Population with a Degree in Liberal Arts and History in the United States?
Percentage of Population with a Degree in Liberal Arts and History in the United States is 4.9%.