Jacksonville, NC Map & Demographics
Jacksonville Map
Jacksonville Overview
$26,808
PER CAPITA INCOME
$54,922
AVG FAMILY INCOME
$50,185
AVG HOUSEHOLD INCOME
14.6%
WAGE / INCOME GAP [ % ]
85.4¢/ $1
WAGE / INCOME GAP [ $ ]
$10,433
FAMILY INCOME DEFICIT
0.41
INEQUALITY / GINI INDEX
71,908
TOTAL POPULATION
44,265
MALE POPULATION
27,643
FEMALE POPULATION
160.13
MALES / 100 FEMALES
62.45
FEMALES / 100 MALES
23.3
MEDIAN AGE
2.9
AVG FAMILY SIZE
2.4
AVG HOUSEHOLD SIZE
45,522
LABOR FORCE [ PEOPLE ]
76.9%
PERCENT IN LABOR FORCE
8.9%
UNEMPLOYMENT RATE
Jacksonville Area Codes
Income in Jacksonville
Income Overview in Jacksonville
Per Capita Income in Jacksonville is $26,808, while median incomes of families and households are $54,922 and $50,185 respectively.
| Characteristic | Number | Measure |
| Per Capita Income | 71,908 | $26,808 |
| Median Family Income | 15,420 | $54,922 |
| Mean Family Income | 15,420 | $71,887 |
| Median Household Income | 22,089 | $50,185 |
| Mean Household Income | 22,089 | $65,379 |
| Income Deficit | 15,420 | $10,433 |
| Wage / Income Gap (%) | 71,908 | 14.64% |
| Wage / Income Gap ($) | 71,908 | 85.36¢ per $1 |
| Gini / Inequality Index | 71,908 | 0.41 |
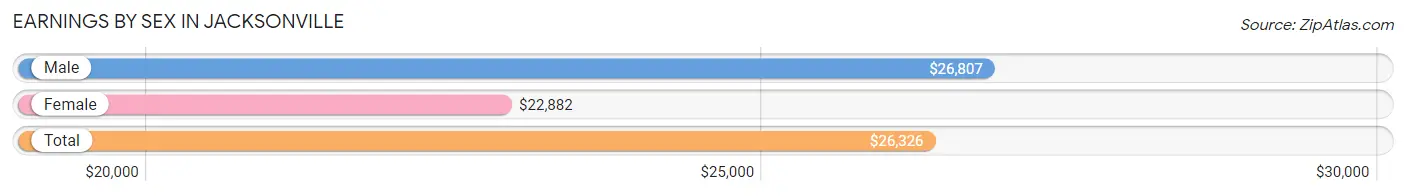
Earnings by Sex in Jacksonville
Average Earnings in Jacksonville are $26,326, $26,807 for men and $22,882 for women, a difference of 14.6%.
| Sex | Number | Average Earnings |
| Male | 33,971 (71.9%) | $26,807 |
| Female | 13,285 (28.1%) | $22,882 |
| Total | 47,256 (100.0%) | $26,326 |
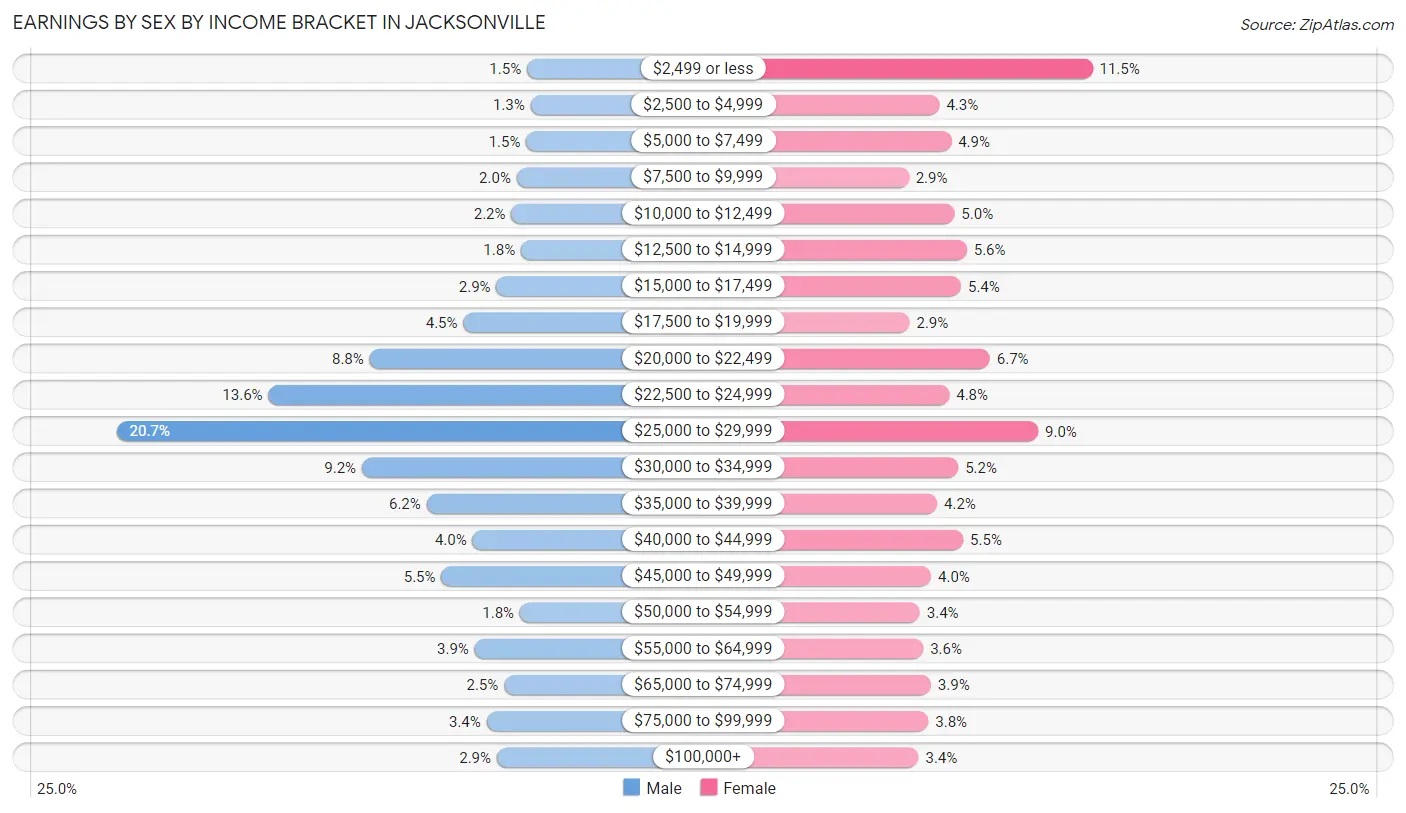
Earnings by Sex by Income Bracket in Jacksonville
The most common earnings brackets in Jacksonville are $25,000 to $29,999 for men (7,027 | 20.7%) and $2,499 or less for women (1,529 | 11.5%).
| Income | Male | Female |
| $2,499 or less | 499 (1.5%) | 1,529 (11.5%) |
| $2,500 to $4,999 | 442 (1.3%) | 576 (4.3%) |
| $5,000 to $7,499 | 508 (1.5%) | 649 (4.9%) |
| $7,500 to $9,999 | 663 (1.9%) | 385 (2.9%) |
| $10,000 to $12,499 | 748 (2.2%) | 669 (5.0%) |
| $12,500 to $14,999 | 595 (1.8%) | 746 (5.6%) |
| $15,000 to $17,499 | 985 (2.9%) | 711 (5.3%) |
| $17,500 to $19,999 | 1,513 (4.4%) | 390 (2.9%) |
| $20,000 to $22,499 | 3,004 (8.8%) | 890 (6.7%) |
| $22,500 to $24,999 | 4,612 (13.6%) | 638 (4.8%) |
| $25,000 to $29,999 | 7,027 (20.7%) | 1,190 (9.0%) |
| $30,000 to $34,999 | 3,127 (9.2%) | 694 (5.2%) |
| $35,000 to $39,999 | 2,096 (6.2%) | 562 (4.2%) |
| $40,000 to $44,999 | 1,367 (4.0%) | 724 (5.4%) |
| $45,000 to $49,999 | 1,861 (5.5%) | 525 (4.0%) |
| $50,000 to $54,999 | 613 (1.8%) | 454 (3.4%) |
| $55,000 to $64,999 | 1,330 (3.9%) | 476 (3.6%) |
| $65,000 to $74,999 | 862 (2.5%) | 523 (3.9%) |
| $75,000 to $99,999 | 1,142 (3.4%) | 508 (3.8%) |
| $100,000+ | 977 (2.9%) | 446 (3.4%) |
| Total | 33,971 (100.0%) | 13,285 (100.0%) |
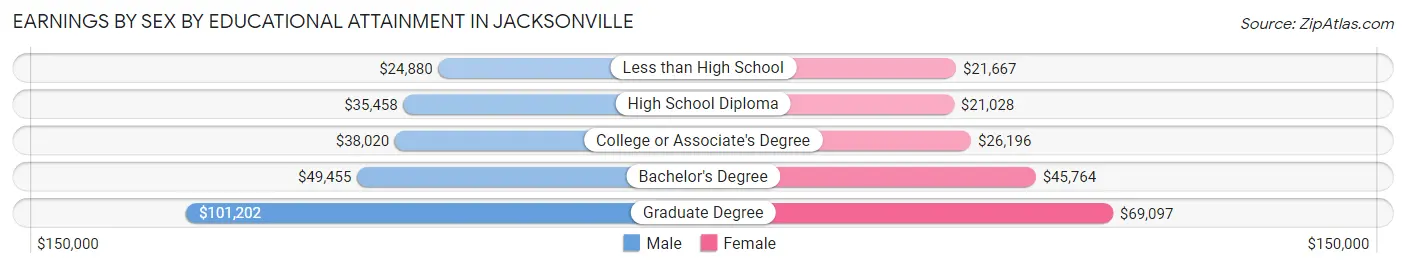
Earnings by Sex by Educational Attainment in Jacksonville
Average earnings in Jacksonville are $40,696 for men and $30,993 for women, a difference of 23.8%. Men with an educational attainment of graduate degree enjoy the highest average annual earnings of $101,202, while those with less than high school education earn the least with $24,880. Women with an educational attainment of graduate degree earn the most with the average annual earnings of $69,097, while those with high school diploma education have the smallest earnings of $21,028.
| Educational Attainment | Male Income | Female Income |
| Less than High School | $24,880 | $21,667 |
| High School Diploma | $35,458 | $21,028 |
| College or Associate's Degree | $38,020 | $26,196 |
| Bachelor's Degree | $49,455 | $45,764 |
| Graduate Degree | $101,202 | $69,097 |
| Total | $40,696 | $30,993 |
Family Income in Jacksonville
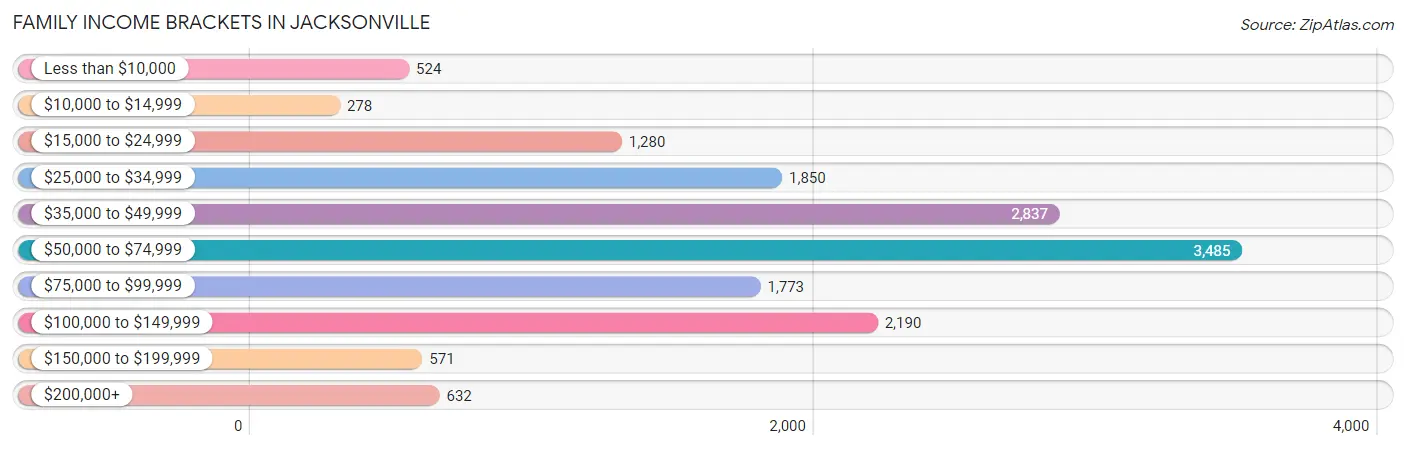
Family Income Brackets in Jacksonville
According to the Jacksonville family income data, there are 3,485 families falling into the $50,000 to $74,999 income range, which is the most common income bracket and makes up 22.6% of all families. Conversely, the $10,000 to $14,999 income bracket is the least frequent group with only 278 families (1.8%) belonging to this category.
| Income Bracket | # Families | % Families |
| Less than $10,000 | 524 | 3.4% |
| $10,000 to $14,999 | 278 | 1.8% |
| $15,000 to $24,999 | 1,280 | 8.3% |
| $25,000 to $34,999 | 1,850 | 12.0% |
| $35,000 to $49,999 | 2,837 | 18.4% |
| $50,000 to $74,999 | 3,485 | 22.6% |
| $75,000 to $99,999 | 1,773 | 11.5% |
| $100,000 to $149,999 | 2,190 | 14.2% |
| $150,000 to $199,999 | 571 | 3.7% |
| $200,000+ | 632 | 4.1% |
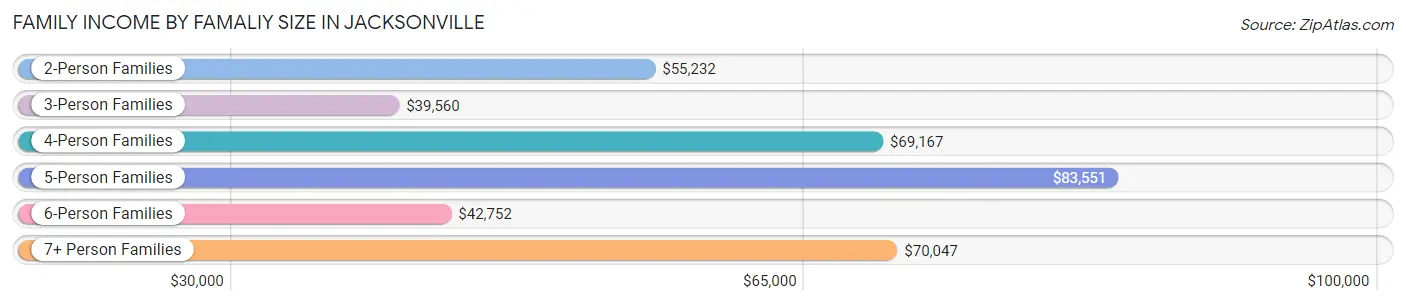
Family Income by Famaliy Size in Jacksonville
5-person families (1,160 | 7.5%) account for the highest median family income in Jacksonville with $83,551 per family, while 2-person families (7,889 | 51.2%) have the highest median income of $27,616 per family member.
| Income Bracket | # Families | Median Income |
| 2-Person Families | 7,889 (51.2%) | $55,232 |
| 3-Person Families | 3,990 (25.9%) | $39,560 |
| 4-Person Families | 1,444 (9.4%) | $69,167 |
| 5-Person Families | 1,160 (7.5%) | $83,551 |
| 6-Person Families | 652 (4.2%) | $42,752 |
| 7+ Person Families | 285 (1.8%) | $70,047 |
| Total | 15,420 (100.0%) | $54,922 |
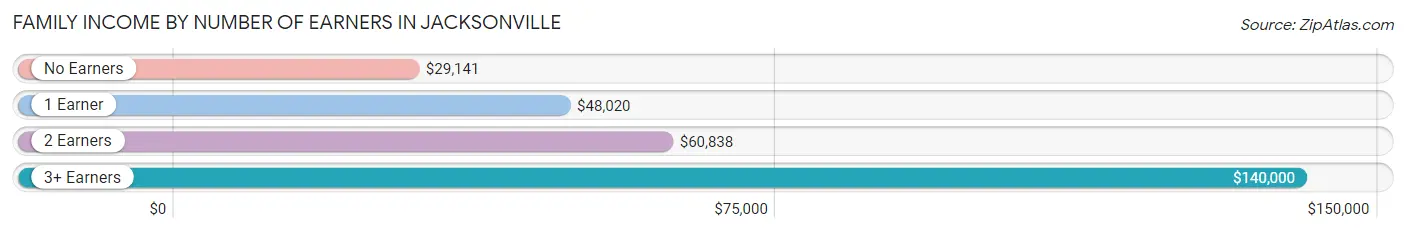
Family Income by Number of Earners in Jacksonville
The median family income in Jacksonville is $54,922, with families comprising 3+ earners (840) having the highest median family income of $140,000, while families with no earners (1,430) have the lowest median family income of $29,141, accounting for 5.4% and 9.3% of families, respectively.
| Number of Earners | # Families | Median Income |
| No Earners | 1,430 (9.3%) | $29,141 |
| 1 Earner | 6,164 (40.0%) | $48,020 |
| 2 Earners | 6,986 (45.3%) | $60,838 |
| 3+ Earners | 840 (5.4%) | $140,000 |
| Total | 15,420 (100.0%) | $54,922 |
Household Income in Jacksonville
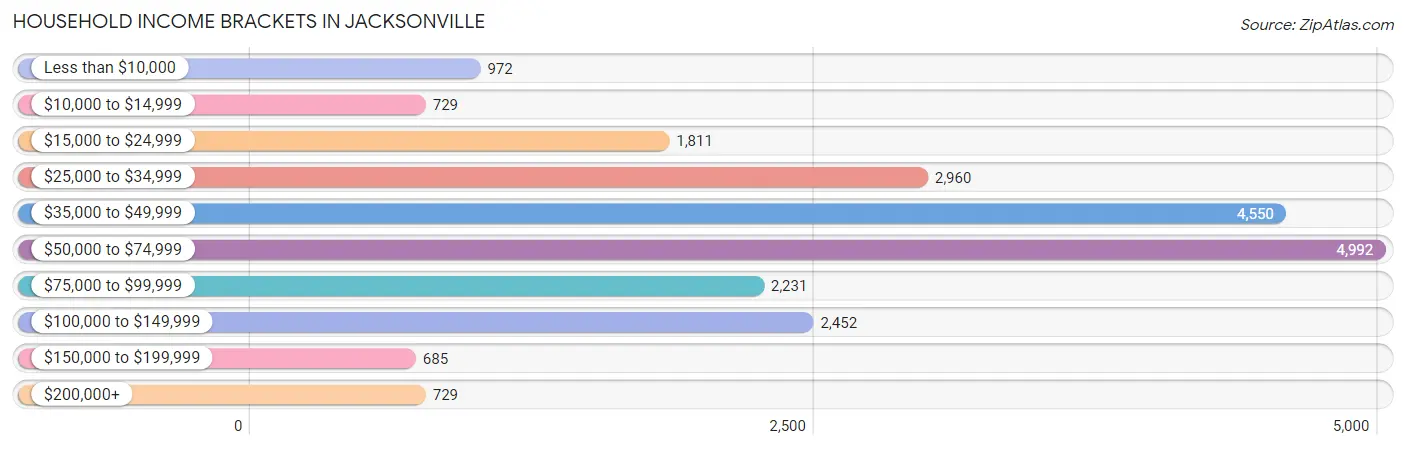
Household Income Brackets in Jacksonville
With 4,992 households falling in the category, the $50,000 to $74,999 income range is the most frequent in Jacksonville, accounting for 22.6% of all households. In contrast, only 685 households (3.1%) fall into the $150,000 to $199,999 income bracket, making it the least populous group.
| Income Bracket | # Households | % Households |
| Less than $10,000 | 972 | 4.4% |
| $10,000 to $14,999 | 729 | 3.3% |
| $15,000 to $24,999 | 1,811 | 8.2% |
| $25,000 to $34,999 | 2,960 | 13.4% |
| $35,000 to $49,999 | 4,550 | 20.6% |
| $50,000 to $74,999 | 4,992 | 22.6% |
| $75,000 to $99,999 | 2,231 | 10.1% |
| $100,000 to $149,999 | 2,452 | 11.1% |
| $150,000 to $199,999 | 685 | 3.1% |
| $200,000+ | 729 | 3.3% |
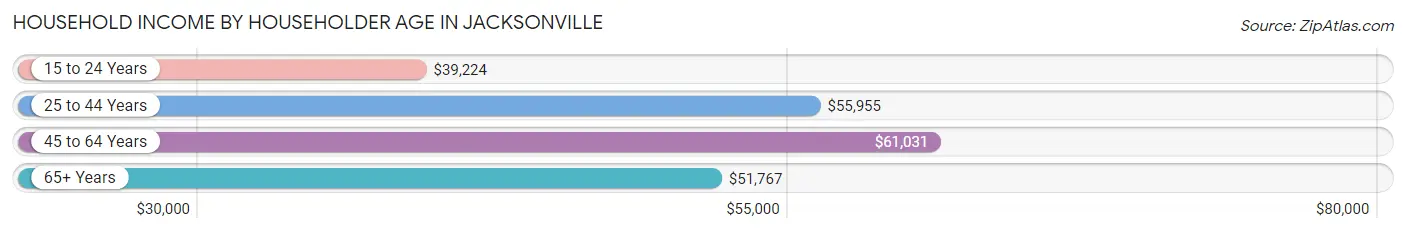
Household Income by Householder Age in Jacksonville
The median household income in Jacksonville is $50,185, with the highest median household income of $61,031 found in the 45 to 64 years age bracket for the primary householder. A total of 4,742 households (21.5%) fall into this category. Meanwhile, the 15 to 24 years age bracket for the primary householder has the lowest median household income of $39,224, with 6,002 households (27.2%) in this group.
| Income Bracket | # Households | Median Income |
| 15 to 24 Years | 6,002 (27.2%) | $39,224 |
| 25 to 44 Years | 8,100 (36.7%) | $55,955 |
| 45 to 64 Years | 4,742 (21.5%) | $61,031 |
| 65+ Years | 3,245 (14.7%) | $51,767 |
| Total | 22,089 (100.0%) | $50,185 |
Poverty in Jacksonville
Income Below Poverty by Sex and Age in Jacksonville
With 12.7% poverty level for males and 18.2% for females among the residents of Jacksonville, 12 to 14 year old males and 15 year old females are the most vulnerable to poverty, with 214 males (33.4%) and 93 females (53.4%) in their respective age groups living below the poverty level.
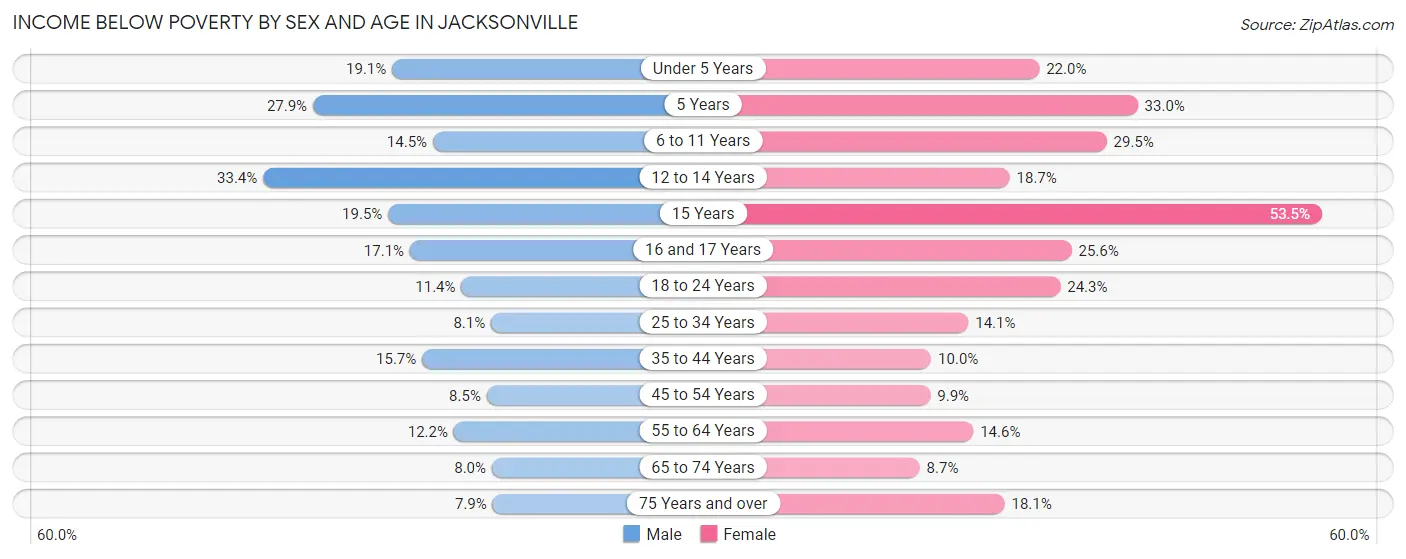
| Age Bracket | Male | Female |
| Under 5 Years | 479 (19.1%) | 564 (22.0%) |
| 5 Years | 99 (27.9%) | 86 (33.0%) |
| 6 to 11 Years | 346 (14.5%) | 730 (29.5%) |
| 12 to 14 Years | 214 (33.4%) | 145 (18.7%) |
| 15 Years | 64 (19.5%) | 93 (53.4%) |
| 16 and 17 Years | 80 (17.1%) | 140 (25.6%) |
| 18 to 24 Years | 717 (11.4%) | 1,284 (24.3%) |
| 25 to 34 Years | 436 (8.1%) | 655 (14.1%) |
| 35 to 44 Years | 388 (15.7%) | 278 (10.0%) |
| 45 to 54 Years | 138 (8.5%) | 179 (9.9%) |
| 55 to 64 Years | 244 (12.2%) | 349 (14.6%) |
| 65 to 74 Years | 113 (8.0%) | 162 (8.7%) |
| 75 Years and over | 53 (7.9%) | 188 (18.1%) |
| Total | 3,371 (12.7%) | 4,853 (18.2%) |
Income Above Poverty by Sex and Age in Jacksonville
According to the poverty statistics in Jacksonville, males aged 75 years and over and females aged 65 to 74 years are the age groups that are most secure financially, with 92.1% of males and 91.3% of females in these age groups living above the poverty line.
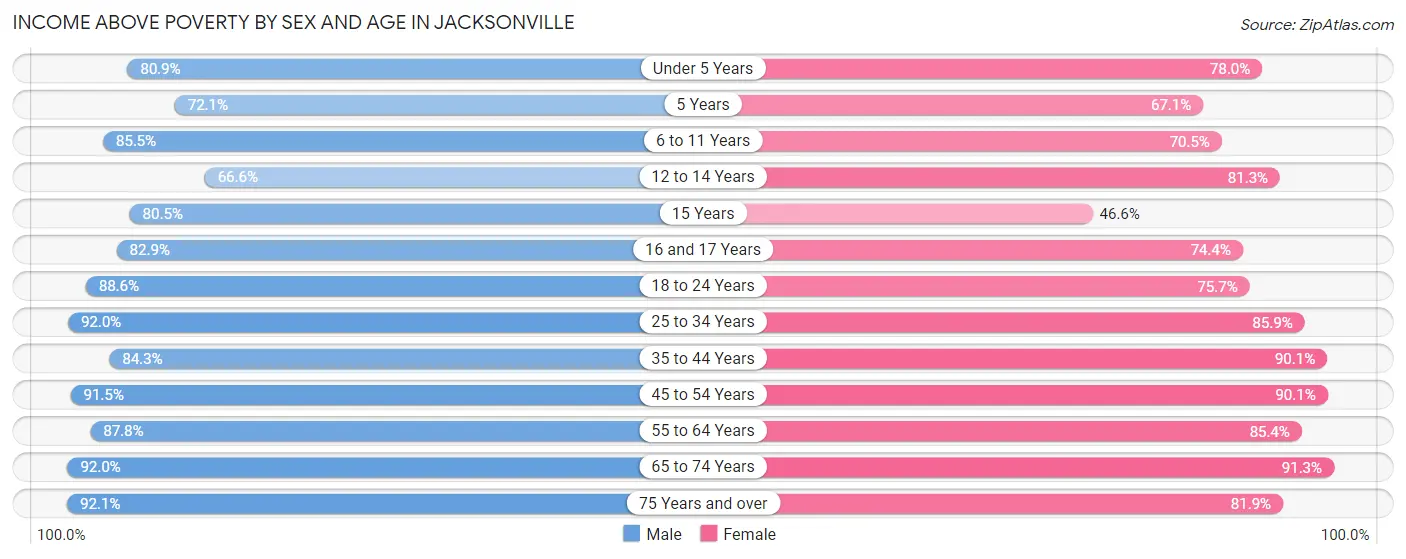
| Age Bracket | Male | Female |
| Under 5 Years | 2,033 (80.9%) | 2,001 (78.0%) |
| 5 Years | 256 (72.1%) | 175 (67.0%) |
| 6 to 11 Years | 2,035 (85.5%) | 1,745 (70.5%) |
| 12 to 14 Years | 426 (66.6%) | 631 (81.3%) |
| 15 Years | 264 (80.5%) | 81 (46.6%) |
| 16 and 17 Years | 388 (82.9%) | 407 (74.4%) |
| 18 to 24 Years | 5,597 (88.6%) | 3,994 (75.7%) |
| 25 to 34 Years | 4,982 (91.9%) | 3,993 (85.9%) |
| 35 to 44 Years | 2,079 (84.3%) | 2,515 (90.0%) |
| 45 to 54 Years | 1,480 (91.5%) | 1,636 (90.1%) |
| 55 to 64 Years | 1,756 (87.8%) | 2,035 (85.4%) |
| 65 to 74 Years | 1,306 (92.0%) | 1,707 (91.3%) |
| 75 Years and over | 620 (92.1%) | 849 (81.9%) |
| Total | 23,222 (87.3%) | 21,769 (81.8%) |
Income Below Poverty Among Married-Couple Families in Jacksonville
The poverty statistics for married-couple families in Jacksonville show that 5.5% or 649 of the total 11,710 families live below the poverty line. Families with 1 or 2 children have the highest poverty rate of 11.1%, comprising of 436 families. On the other hand, families with 5 or more children have the lowest poverty rate of 0.0%, which includes 0 families.
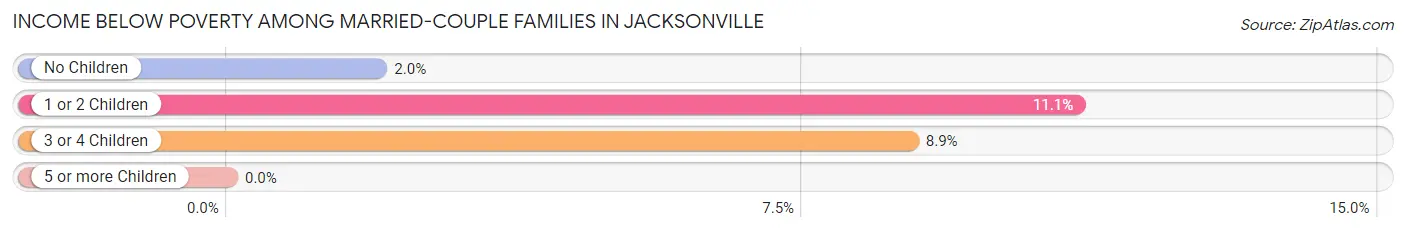
| Children | Above Poverty | Below Poverty |
| No Children | 6,399 (98.1%) | 127 (1.9%) |
| 1 or 2 Children | 3,507 (88.9%) | 436 (11.1%) |
| 3 or 4 Children | 881 (91.1%) | 86 (8.9%) |
| 5 or more Children | 274 (100.0%) | 0 (0.0%) |
| Total | 11,061 (94.5%) | 649 (5.5%) |
Income Below Poverty Among Single-Parent Households in Jacksonville
According to the poverty data in Jacksonville, 18.7% or 122 single-father households and 33.0% or 1,010 single-mother households are living below the poverty line. Among single-father households, those with 3 or 4 children have the highest poverty rate, with 13 households (50.0%) experiencing poverty. Likewise, among single-mother households, those with 5 or more children have the highest poverty rate, with 265 households (100.0%) falling below the poverty line.
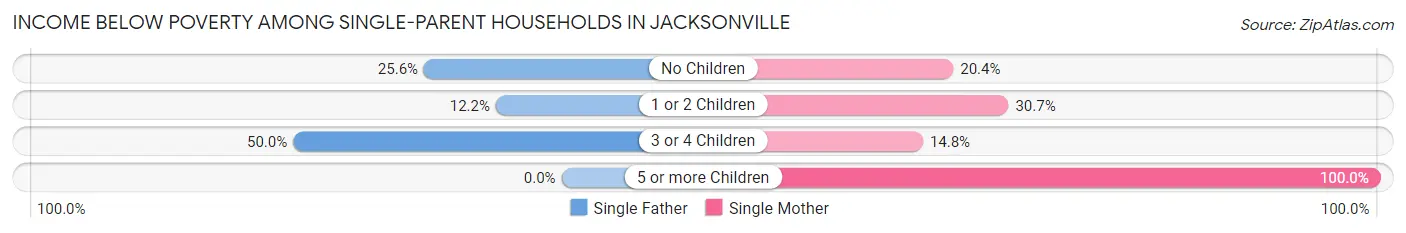
| Children | Single Father | Single Mother |
| No Children | 62 (25.6%) | 176 (20.4%) |
| 1 or 2 Children | 47 (12.2%) | 547 (30.7%) |
| 3 or 4 Children | 13 (50.0%) | 22 (14.8%) |
| 5 or more Children | 0 (0.0%) | 265 (100.0%) |
| Total | 122 (18.7%) | 1,010 (33.0%) |
Income Below Poverty Among Married-Couple vs Single-Parent Households in Jacksonville
The poverty data for Jacksonville shows that 649 of the married-couple family households (5.5%) and 1,132 of the single-parent households (30.5%) are living below the poverty level. Within the married-couple family households, those with 1 or 2 children have the highest poverty rate, with 436 households (11.1%) falling below the poverty line. Among the single-parent households, those with 5 or more children have the highest poverty rate, with 265 household (100.0%) living below poverty.
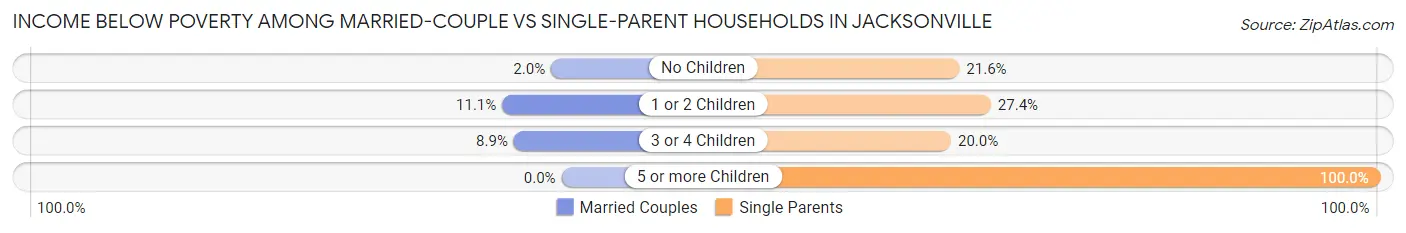
| Children | Married-Couple Families | Single-Parent Households |
| No Children | 127 (1.9%) | 238 (21.6%) |
| 1 or 2 Children | 436 (11.1%) | 594 (27.4%) |
| 3 or 4 Children | 86 (8.9%) | 35 (20.0%) |
| 5 or more Children | 0 (0.0%) | 265 (100.0%) |
| Total | 649 (5.5%) | 1,132 (30.5%) |
Race in Jacksonville
The most populous races in Jacksonville are White / Caucasian (44,320 | 61.6%), Hispanic or Latino (13,833 | 19.2%), and Black / African American (13,428 | 18.7%).
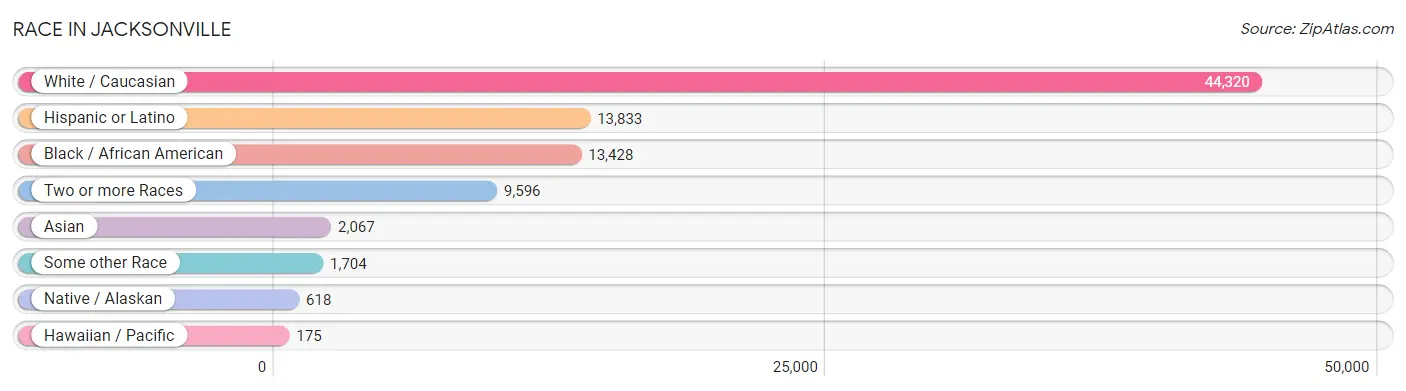
| Race | # Population | % Population |
| Asian | 2,067 | 2.9% |
| Black / African American | 13,428 | 18.7% |
| Hawaiian / Pacific | 175 | 0.2% |
| Hispanic or Latino | 13,833 | 19.2% |
| Native / Alaskan | 618 | 0.9% |
| White / Caucasian | 44,320 | 61.6% |
| Two or more Races | 9,596 | 13.3% |
| Some other Race | 1,704 | 2.4% |
| Total | 71,908 | 100.0% |
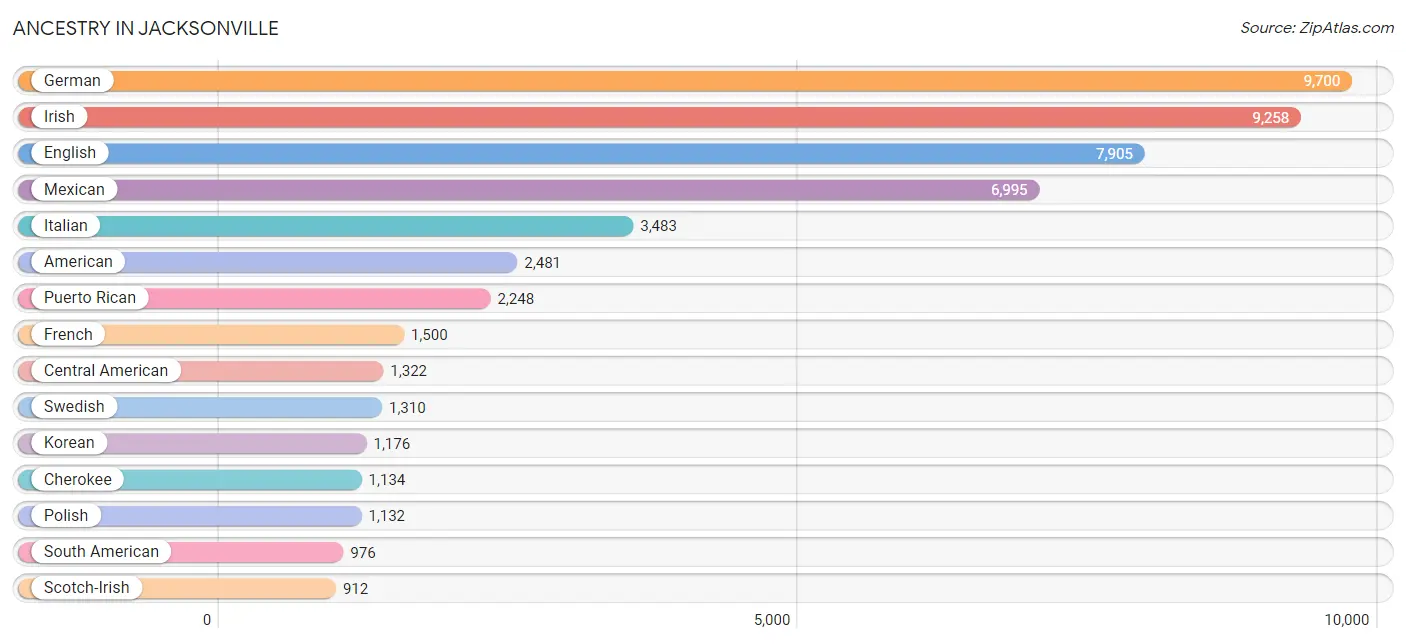
Ancestry in Jacksonville
The most populous ancestries reported in Jacksonville are German (9,700 | 13.5%), Irish (9,258 | 12.9%), English (7,905 | 11.0%), Mexican (6,995 | 9.7%), and Italian (3,483 | 4.8%), together accounting for 51.9% of all Jacksonville residents.
| Ancestry | # Population | % Population |
| African | 639 | 0.9% |
| Alaska Native | 90 | 0.1% |
| Albanian | 18 | 0.0% |
| American | 2,481 | 3.5% |
| Apache | 27 | 0.0% |
| Arab | 352 | 0.5% |
| Argentinean | 7 | 0.0% |
| Armenian | 86 | 0.1% |
| Austrian | 84 | 0.1% |
| Bangladeshi | 33 | 0.1% |
| Barbadian | 41 | 0.1% |
| Belgian | 18 | 0.0% |
| Bhutanese | 233 | 0.3% |
| Blackfeet | 481 | 0.7% |
| Bolivian | 20 | 0.0% |
| Brazilian | 12 | 0.0% |
| British | 376 | 0.5% |
| British West Indian | 61 | 0.1% |
| Burmese | 268 | 0.4% |
| Canadian | 188 | 0.3% |
| Cape Verdean | 12 | 0.0% |
| Central American | 1,322 | 1.8% |
| Cherokee | 1,134 | 1.6% |
| Chilean | 196 | 0.3% |
| Chinese | 27 | 0.0% |
| Chippewa | 106 | 0.2% |
| Choctaw | 59 | 0.1% |
| Colombian | 408 | 0.6% |
| Costa Rican | 10 | 0.0% |
| Creek | 10 | 0.0% |
| Croatian | 92 | 0.1% |
| Cuban | 507 | 0.7% |
| Czech | 34 | 0.1% |
| Czechoslovakian | 27 | 0.0% |
| Danish | 97 | 0.1% |
| Dominican | 867 | 1.2% |
| Dutch | 723 | 1.0% |
| Dutch West Indian | 28 | 0.0% |
| Eastern European | 13 | 0.0% |
| Ecuadorian | 151 | 0.2% |
| English | 7,905 | 11.0% |
| European | 704 | 1.0% |
| Filipino | 37 | 0.1% |
| Finnish | 70 | 0.1% |
| French | 1,500 | 2.1% |
| French Canadian | 428 | 0.6% |
| German | 9,700 | 13.5% |
| Ghanaian | 10 | 0.0% |
| Greek | 209 | 0.3% |
| Guamanian / Chamorro | 32 | 0.0% |
| Guatemalan | 349 | 0.5% |
| Guyanese | 38 | 0.1% |
| Haitian | 567 | 0.8% |
| Honduran | 90 | 0.1% |
| Hopi | 28 | 0.0% |
| Houma | 35 | 0.1% |
| Hungarian | 622 | 0.9% |
| Indian (Asian) | 603 | 0.8% |
| Indonesian | 19 | 0.0% |
| Irish | 9,258 | 12.9% |
| Iroquois | 5 | 0.0% |
| Italian | 3,483 | 4.8% |
| Jamaican | 460 | 0.6% |
| Japanese | 133 | 0.2% |
| Kenyan | 69 | 0.1% |
| Korean | 1,176 | 1.6% |
| Latvian | 52 | 0.1% |
| Lebanese | 188 | 0.3% |
| Lithuanian | 27 | 0.0% |
| Lumbee | 23 | 0.0% |
| Malaysian | 80 | 0.1% |
| Menominee | 16 | 0.0% |
| Mexican | 6,995 | 9.7% |
| Mexican American Indian | 90 | 0.1% |
| Mongolian | 6 | 0.0% |
| Native Hawaiian | 37 | 0.1% |
| Navajo | 14 | 0.0% |
| New Zealander | 104 | 0.1% |
| Nicaraguan | 48 | 0.1% |
| Nigerian | 33 | 0.1% |
| Northern European | 9 | 0.0% |
| Norwegian | 383 | 0.5% |
| Pakistani | 101 | 0.1% |
| Panamanian | 159 | 0.2% |
| Paraguayan | 88 | 0.1% |
| Peruvian | 69 | 0.1% |
| Polish | 1,132 | 1.6% |
| Portuguese | 314 | 0.4% |
| Potawatomi | 13 | 0.0% |
| Pueblo | 1 | 0.0% |
| Puerto Rican | 2,248 | 3.1% |
| Puget Sound Salish | 16 | 0.0% |
| Romanian | 92 | 0.1% |
| Russian | 273 | 0.4% |
| Salvadoran | 666 | 0.9% |
| Samoan | 148 | 0.2% |
| Scandinavian | 237 | 0.3% |
| Scotch-Irish | 912 | 1.3% |
| Scottish | 846 | 1.2% |
| Seminole | 20 | 0.0% |
| Sioux | 9 | 0.0% |
| Slovak | 91 | 0.1% |
| Somali | 18 | 0.0% |
| South American | 976 | 1.4% |
| Spaniard | 525 | 0.7% |
| Spanish | 191 | 0.3% |
| Sri Lankan | 422 | 0.6% |
| Subsaharan African | 820 | 1.1% |
| Swedish | 1,310 | 1.8% |
| Swiss | 58 | 0.1% |
| Syrian | 64 | 0.1% |
| Thai | 238 | 0.3% |
| Tohono O'Odham | 16 | 0.0% |
| Trinidadian and Tobagonian | 21 | 0.0% |
| Ukrainian | 153 | 0.2% |
| Uruguayan | 19 | 0.0% |
| Ute | 14 | 0.0% |
| Venezuelan | 18 | 0.0% |
| Vietnamese | 16 | 0.0% |
| Welsh | 239 | 0.3% |
| West Indian | 23 | 0.0% |
| Yugoslavian | 15 | 0.0% | View All 122 Rows |
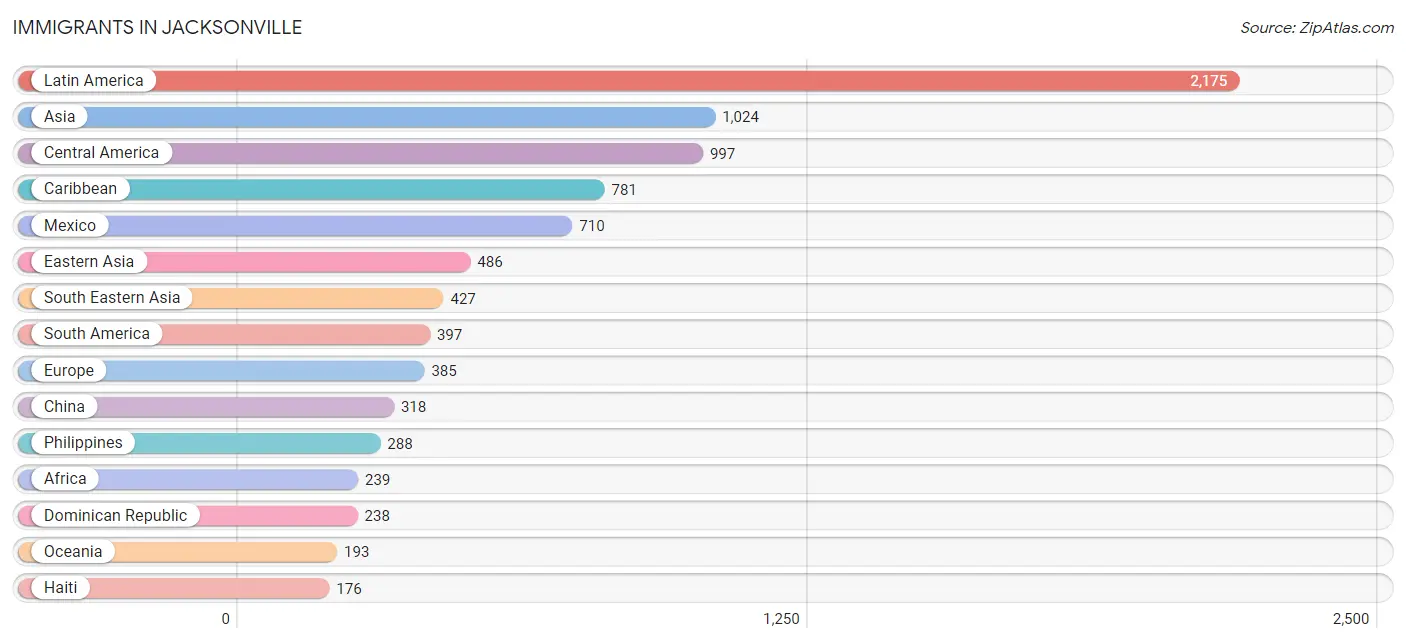
Immigrants in Jacksonville
The most numerous immigrant groups reported in Jacksonville came from Latin America (2,175 | 3.0%), Asia (1,024 | 1.4%), Central America (997 | 1.4%), Caribbean (781 | 1.1%), and Mexico (710 | 1.0%), together accounting for 7.9% of all Jacksonville residents.
| Immigration Origin | # Population | % Population |
| Africa | 239 | 0.3% |
| Albania | 18 | 0.0% |
| Armenia | 25 | 0.0% |
| Asia | 1,024 | 1.4% |
| Bangladesh | 16 | 0.0% |
| Barbados | 6 | 0.0% |
| Bolivia | 12 | 0.0% |
| Brazil | 12 | 0.0% |
| Cambodia | 7 | 0.0% |
| Cameroon | 43 | 0.1% |
| Canada | 22 | 0.0% |
| Caribbean | 781 | 1.1% |
| Central America | 997 | 1.4% |
| Chile | 80 | 0.1% |
| China | 318 | 0.4% |
| Colombia | 112 | 0.2% |
| Costa Rica | 6 | 0.0% |
| Cuba | 160 | 0.2% |
| Dominican Republic | 238 | 0.3% |
| Eastern Africa | 111 | 0.2% |
| Eastern Asia | 486 | 0.7% |
| Eastern Europe | 109 | 0.2% |
| Ecuador | 44 | 0.1% |
| El Salvador | 117 | 0.2% |
| England | 11 | 0.0% |
| Ethiopia | 8 | 0.0% |
| Europe | 385 | 0.5% |
| Germany | 138 | 0.2% |
| Ghana | 10 | 0.0% |
| Greece | 71 | 0.1% |
| Guatemala | 62 | 0.1% |
| Haiti | 176 | 0.2% |
| Honduras | 6 | 0.0% |
| Hong Kong | 22 | 0.0% |
| India | 48 | 0.1% |
| Jamaica | 156 | 0.2% |
| Japan | 61 | 0.1% |
| Kenya | 69 | 0.1% |
| Korea | 107 | 0.2% |
| Laos | 13 | 0.0% |
| Latin America | 2,175 | 3.0% |
| Latvia | 43 | 0.1% |
| Liberia | 9 | 0.0% |
| Mexico | 710 | 1.0% |
| Middle Africa | 43 | 0.1% |
| Nepal | 6 | 0.0% |
| Nicaragua | 24 | 0.0% |
| Northern Europe | 67 | 0.1% |
| Oceania | 193 | 0.3% |
| Panama | 72 | 0.1% |
| Peru | 49 | 0.1% |
| Philippines | 288 | 0.4% |
| Romania | 15 | 0.0% |
| Russia | 21 | 0.0% |
| Singapore | 3 | 0.0% |
| South America | 397 | 0.5% |
| South Central Asia | 70 | 0.1% |
| South Eastern Asia | 427 | 0.6% |
| Southern Europe | 71 | 0.1% |
| Syria | 16 | 0.0% |
| Taiwan | 24 | 0.0% |
| Trinidad and Tobago | 23 | 0.0% |
| Ukraine | 12 | 0.0% |
| Vietnam | 116 | 0.2% |
| Western Africa | 19 | 0.0% |
| Western Asia | 41 | 0.1% |
| Western Europe | 138 | 0.2% | View All 67 Rows |
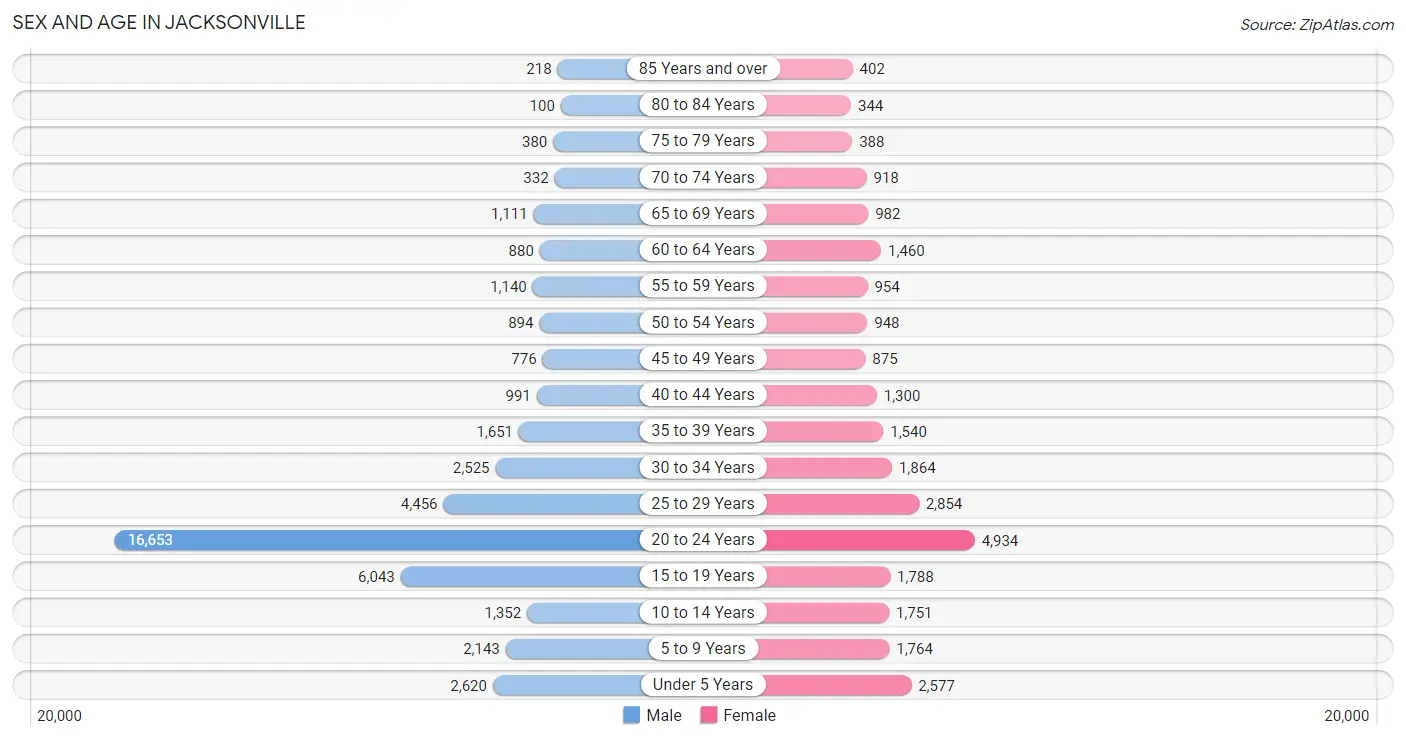
Sex and Age in Jacksonville
Sex and Age in Jacksonville
The most populous age groups in Jacksonville are 20 to 24 Years (16,653 | 37.6%) for men and 20 to 24 Years (4,934 | 17.8%) for women.
| Age Bracket | Male | Female |
| Under 5 Years | 2,620 (5.9%) | 2,577 (9.3%) |
| 5 to 9 Years | 2,143 (4.8%) | 1,764 (6.4%) |
| 10 to 14 Years | 1,352 (3.0%) | 1,751 (6.3%) |
| 15 to 19 Years | 6,043 (13.7%) | 1,788 (6.5%) |
| 20 to 24 Years | 16,653 (37.6%) | 4,934 (17.8%) |
| 25 to 29 Years | 4,456 (10.1%) | 2,854 (10.3%) |
| 30 to 34 Years | 2,525 (5.7%) | 1,864 (6.7%) |
| 35 to 39 Years | 1,651 (3.7%) | 1,540 (5.6%) |
| 40 to 44 Years | 991 (2.2%) | 1,300 (4.7%) |
| 45 to 49 Years | 776 (1.8%) | 875 (3.2%) |
| 50 to 54 Years | 894 (2.0%) | 948 (3.4%) |
| 55 to 59 Years | 1,140 (2.6%) | 954 (3.5%) |
| 60 to 64 Years | 880 (2.0%) | 1,460 (5.3%) |
| 65 to 69 Years | 1,111 (2.5%) | 982 (3.5%) |
| 70 to 74 Years | 332 (0.7%) | 918 (3.3%) |
| 75 to 79 Years | 380 (0.9%) | 388 (1.4%) |
| 80 to 84 Years | 100 (0.2%) | 344 (1.2%) |
| 85 Years and over | 218 (0.5%) | 402 (1.5%) |
| Total | 44,265 (100.0%) | 27,643 (100.0%) |
Families and Households in Jacksonville
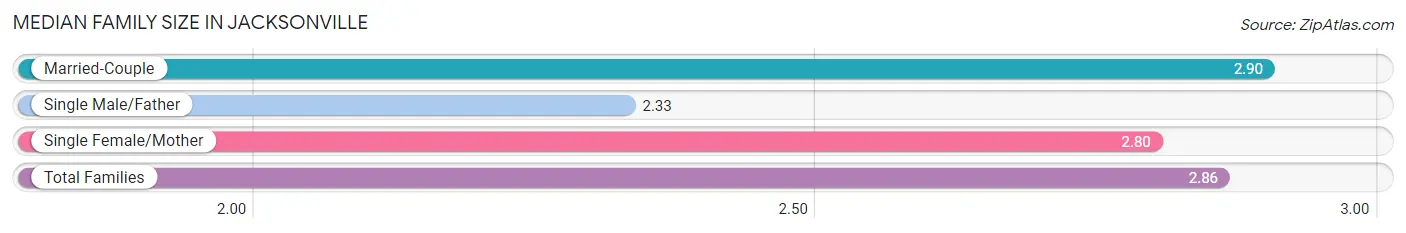
Median Family Size in Jacksonville
The median family size in Jacksonville is 2.86 persons per family, with married-couple families (11,710 | 75.9%) accounting for the largest median family size of 2.9 persons per family. On the other hand, single male/father families (652 | 4.2%) represent the smallest median family size with 2.33 persons per family.
| Family Type | # Families | Family Size |
| Married-Couple | 11,710 (75.9%) | 2.90 |
| Single Male/Father | 652 (4.2%) | 2.33 |
| Single Female/Mother | 3,058 (19.8%) | 2.80 |
| Total Families | 15,420 (100.0%) | 2.86 |
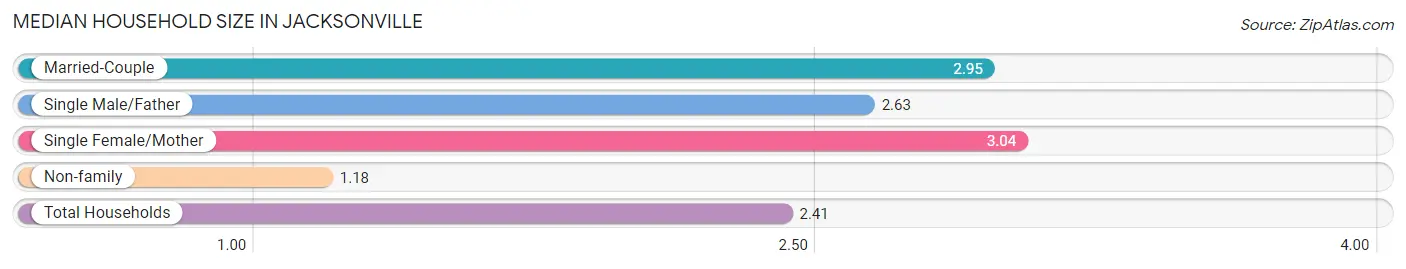
Median Household Size in Jacksonville
The median household size in Jacksonville is 2.41 persons per household, with single female/mother households (3,058 | 13.8%) accounting for the largest median household size of 3.04 persons per household. non-family households (6,669 | 30.2%) represent the smallest median household size with 1.18 persons per household.
| Household Type | # Households | Household Size |
| Married-Couple | 11,710 (53.0%) | 2.95 |
| Single Male/Father | 652 (2.9%) | 2.63 |
| Single Female/Mother | 3,058 (13.8%) | 3.04 |
| Non-family | 6,669 (30.2%) | 1.18 |
| Total Households | 22,089 (100.0%) | 2.41 |
Household Size by Marriage Status in Jacksonville
Out of a total of 22,089 households in Jacksonville, 15,420 (69.8%) are family households, while 6,669 (30.2%) are nonfamily households. The most numerous type of family households are 2-person households, comprising 7,371, and the most common type of nonfamily households are 1-person households, comprising 5,583.
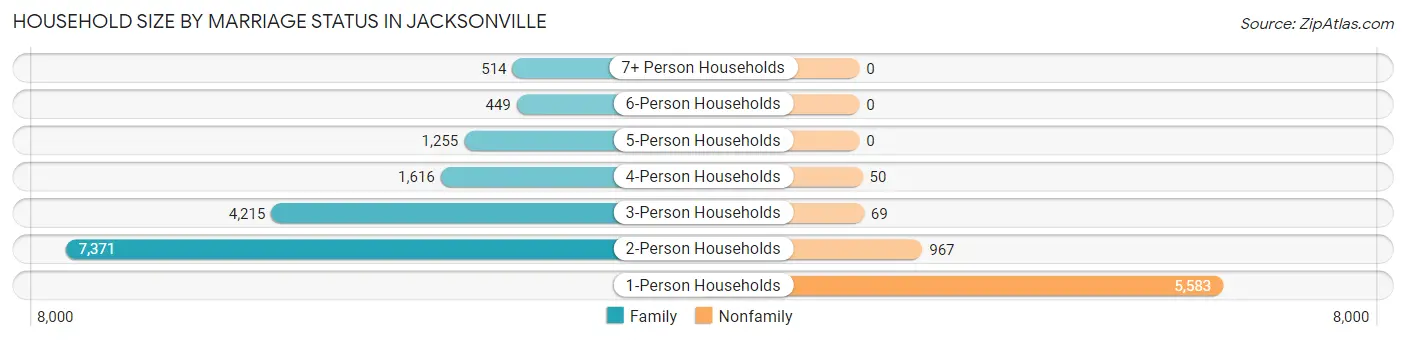
| Household Size | Family Households | Nonfamily Households |
| 1-Person Households | - | 5,583 (25.3%) |
| 2-Person Households | 7,371 (33.4%) | 967 (4.4%) |
| 3-Person Households | 4,215 (19.1%) | 69 (0.3%) |
| 4-Person Households | 1,616 (7.3%) | 50 (0.2%) |
| 5-Person Households | 1,255 (5.7%) | 0 (0.0%) |
| 6-Person Households | 449 (2.0%) | 0 (0.0%) |
| 7+ Person Households | 514 (2.3%) | 0 (0.0%) |
| Total | 15,420 (69.8%) | 6,669 (30.2%) |
Female Fertility in Jacksonville
Fertility by Age in Jacksonville
Average fertility rate in Jacksonville is 83.0 births per 1,000 women. Women in the age bracket of 20 to 34 years have the highest fertility rate with 116.0 births per 1,000 women. Women in the age bracket of 20 to 34 years acount for 88.7% of all women with births.
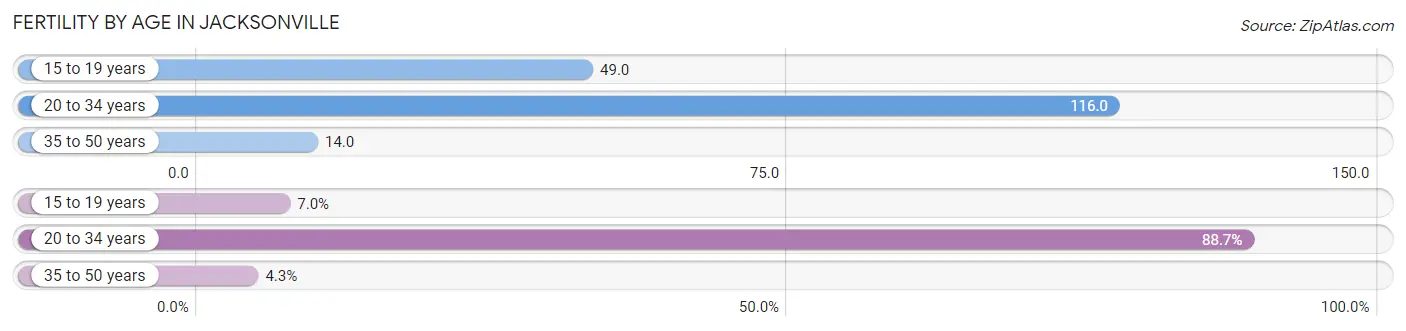
| Age Bracket | Women with Births | Births / 1,000 Women |
| 15 to 19 years | 88 (7.0%) | 49.0 |
| 20 to 34 years | 1,119 (88.7%) | 116.0 |
| 35 to 50 years | 54 (4.3%) | 14.0 |
| Total | 1,261 (100.0%) | 83.0 |
Fertility by Age by Marriage Status in Jacksonville
79.7% of women with births (1,261) in Jacksonville are married. The highest percentage of unmarried women with births falls into 35 to 50 years age bracket with 48.1% of them unmarried at the time of birth, while the lowest percentage of unmarried women with births belong to 15 to 19 years age bracket with 0.0% of them unmarried.
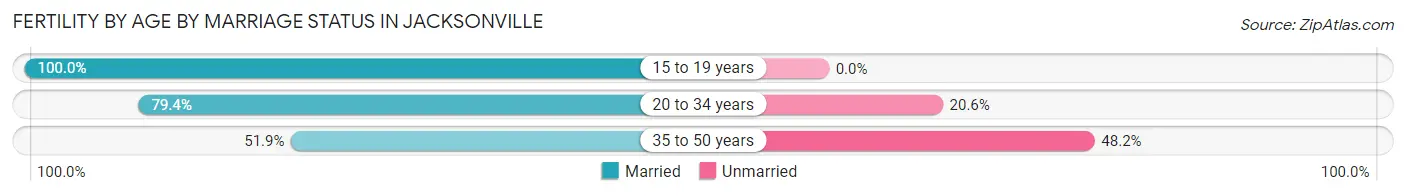
| Age Bracket | Married | Unmarried |
| 15 to 19 years | 88 (100.0%) | 0 (0.0%) |
| 20 to 34 years | 888 (79.4%) | 231 (20.6%) |
| 35 to 50 years | 28 (51.8%) | 26 (48.1%) |
| Total | 1,005 (79.7%) | 256 (20.3%) |
Fertility by Education in Jacksonville
Average fertility rate in Jacksonville is 83.0 births per 1,000 women. Women with the education attainment of less than high school have the highest fertility rate of 114.0 births per 1,000 women, while women with the education attainment of graduate degree have the lowest fertility at 48.0 births per 1,000 women. Women with the education attainment of college or associate's degree represent 34.8% of all women with births.
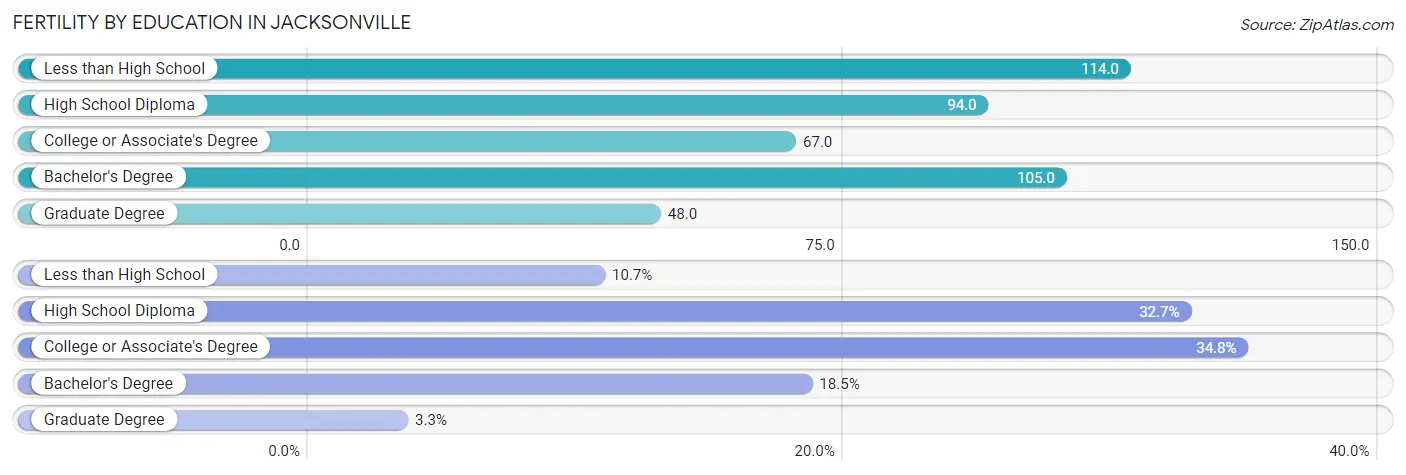
| Educational Attainment | Women with Births | Births / 1,000 Women |
| Less than High School | 135 (10.7%) | 114.0 |
| High School Diploma | 412 (32.7%) | 94.0 |
| College or Associate's Degree | 439 (34.8%) | 67.0 |
| Bachelor's Degree | 233 (18.5%) | 105.0 |
| Graduate Degree | 42 (3.3%) | 48.0 |
| Total | 1,261 (100.0%) | 83.0 |
Fertility by Education by Marriage Status in Jacksonville
20.3% of women with births in Jacksonville are unmarried. Women with the educational attainment of bachelor's degree are most likely to be married with 96.1% of them married at childbirth, while women with the educational attainment of less than high school are least likely to be married with 34.1% of them unmarried at childbirth.
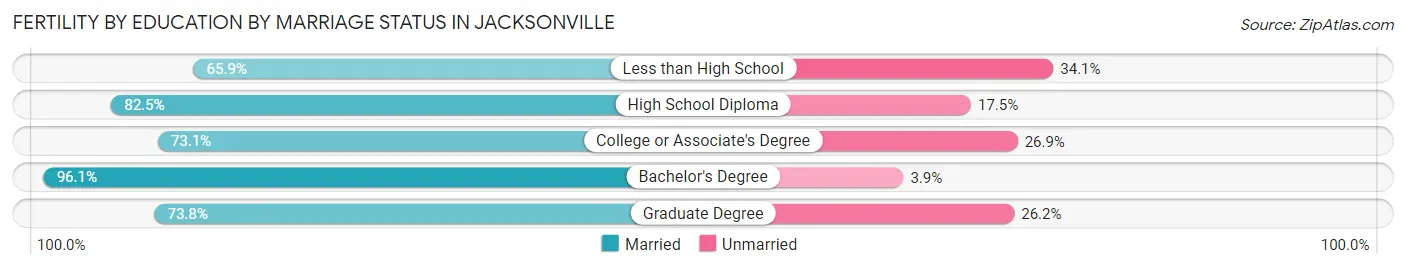
| Educational Attainment | Married | Unmarried |
| Less than High School | 89 (65.9%) | 46 (34.1%) |
| High School Diploma | 340 (82.5%) | 72 (17.5%) |
| College or Associate's Degree | 321 (73.1%) | 118 (26.9%) |
| Bachelor's Degree | 224 (96.1%) | 9 (3.9%) |
| Graduate Degree | 31 (73.8%) | 11 (26.2%) |
| Total | 1,005 (79.7%) | 256 (20.3%) |
Employment Characteristics in Jacksonville
Employment by Class of Employer in Jacksonville
Among the 43,154 employed individuals in Jacksonville, federal government employees (27,564 | 63.9%), private company employees (10,980 | 25.4%), and local government employees (1,628 | 3.8%) make up the most common classes of employment.
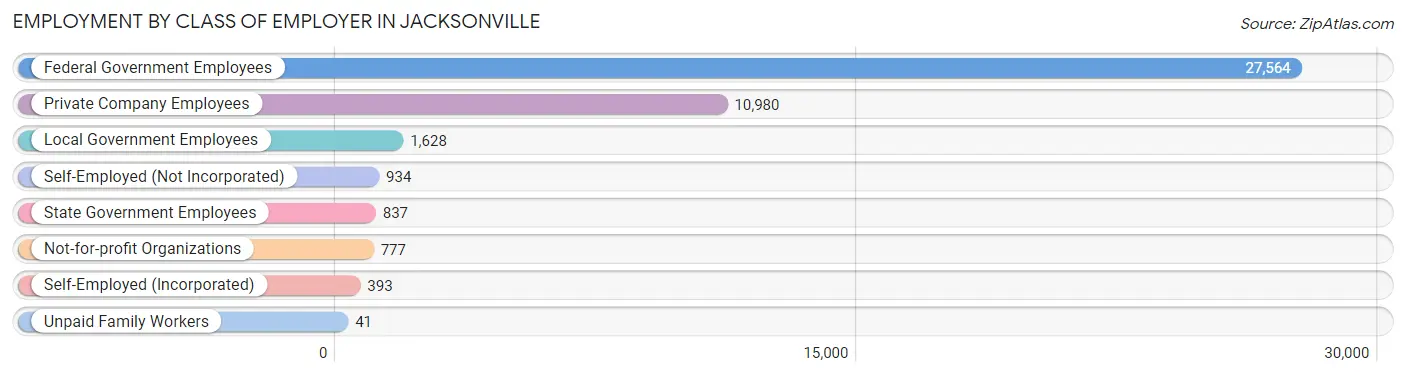
| Employer Class | # Employees | % Employees |
| Private Company Employees | 10,980 | 25.4% |
| Self-Employed (Incorporated) | 393 | 0.9% |
| Self-Employed (Not Incorporated) | 934 | 2.2% |
| Not-for-profit Organizations | 777 | 1.8% |
| Local Government Employees | 1,628 | 3.8% |
| State Government Employees | 837 | 1.9% |
| Federal Government Employees | 27,564 | 63.9% |
| Unpaid Family Workers | 41 | 0.1% |
| Total | 43,154 | 100.0% |
Employment Status by Age in Jacksonville
According to the labor force statistics for Jacksonville, out of the total population over 16 years of age (59,197), 76.9% or 45,522 individuals are in the labor force, with 8.9% or 4,051 of them unemployed. The age group with the highest labor force participation rate is 20 to 24 years, with 89.4% or 19,299 individuals in the labor force. Within the labor force, the 25 to 29 years age range has the highest percentage of unemployed individuals, with 15.6% or 946 of them being unemployed.
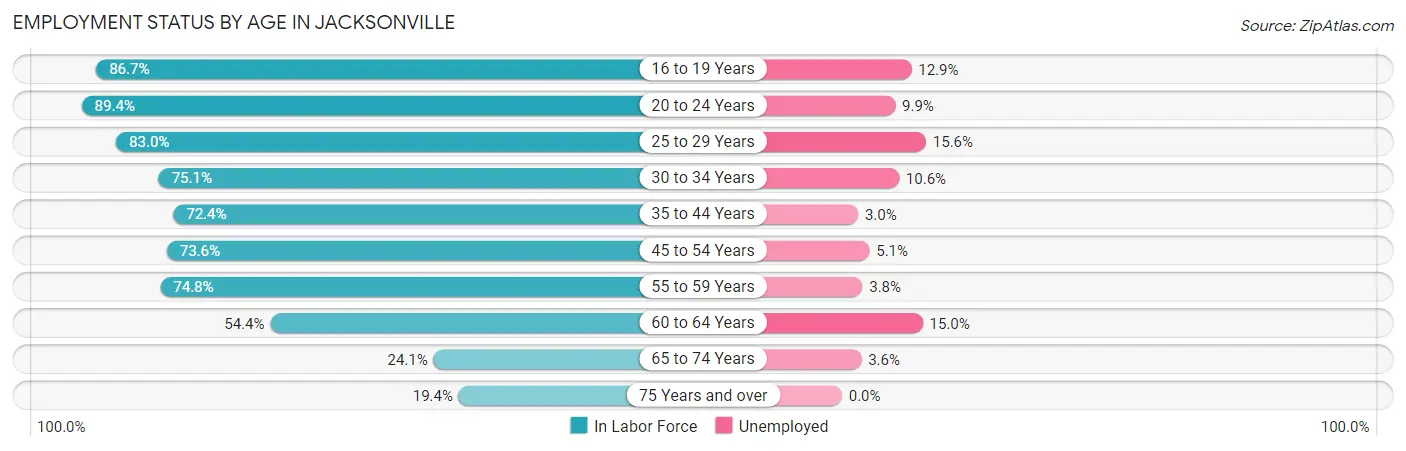
| Age Bracket | In Labor Force | Unemployed |
| 16 to 19 Years | 6,353 (86.7%) | 820 (12.9%) |
| 20 to 24 Years | 19,299 (89.4%) | 1,911 (9.9%) |
| 25 to 29 Years | 6,067 (83.0%) | 946 (15.6%) |
| 30 to 34 Years | 3,296 (75.1%) | 349 (10.6%) |
| 35 to 44 Years | 3,969 (72.4%) | 119 (3.0%) |
| 45 to 54 Years | 2,571 (73.6%) | 131 (5.1%) |
| 55 to 59 Years | 1,566 (74.8%) | 60 (3.8%) |
| 60 to 64 Years | 1,273 (54.4%) | 191 (15.0%) |
| 65 to 74 Years | 806 (24.1%) | 29 (3.6%) |
| 75 Years and over | 355 (19.4%) | 0 (0.0%) |
| Total | 45,522 (76.9%) | 4,051 (8.9%) |
Employment Status by Educational Attainment in Jacksonville
According to labor force statistics for Jacksonville, 74.6% of individuals (18,731) out of the total population between 25 and 64 years of age (25,108) are in the labor force, with 8.7% or 1,630 of them being unemployed. The group with the highest labor force participation rate are those with the educational attainment of bachelor's degree or higher, with 83.3% or 5,134 individuals in the labor force. Within the labor force, individuals with college / associate degree education have the highest percentage of unemployment, with 12.5% or 948 of them being unemployed.
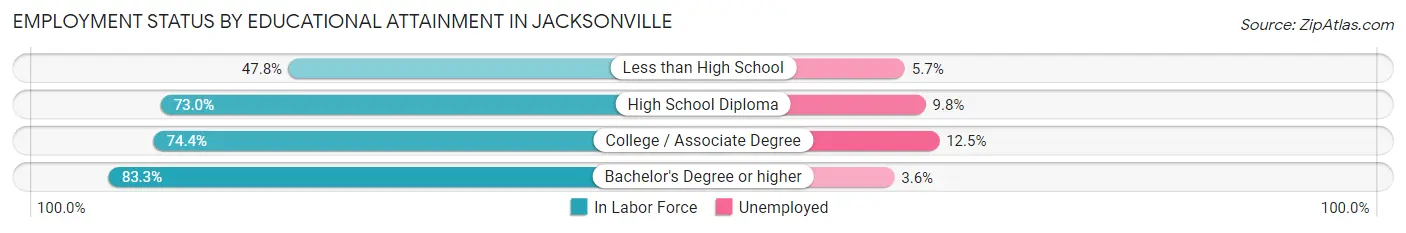
| Educational Attainment | In Labor Force | Unemployed |
| Less than High School | 707 (47.8%) | 84 (5.7%) |
| High School Diploma | 5,306 (73.0%) | 712 (9.8%) |
| College / Associate Degree | 7,587 (74.4%) | 1,275 (12.5%) |
| Bachelor's Degree or higher | 5,134 (83.3%) | 222 (3.6%) |
| Total | 18,731 (74.6%) | 2,184 (8.7%) |
Employment Occupations by Sex in Jacksonville
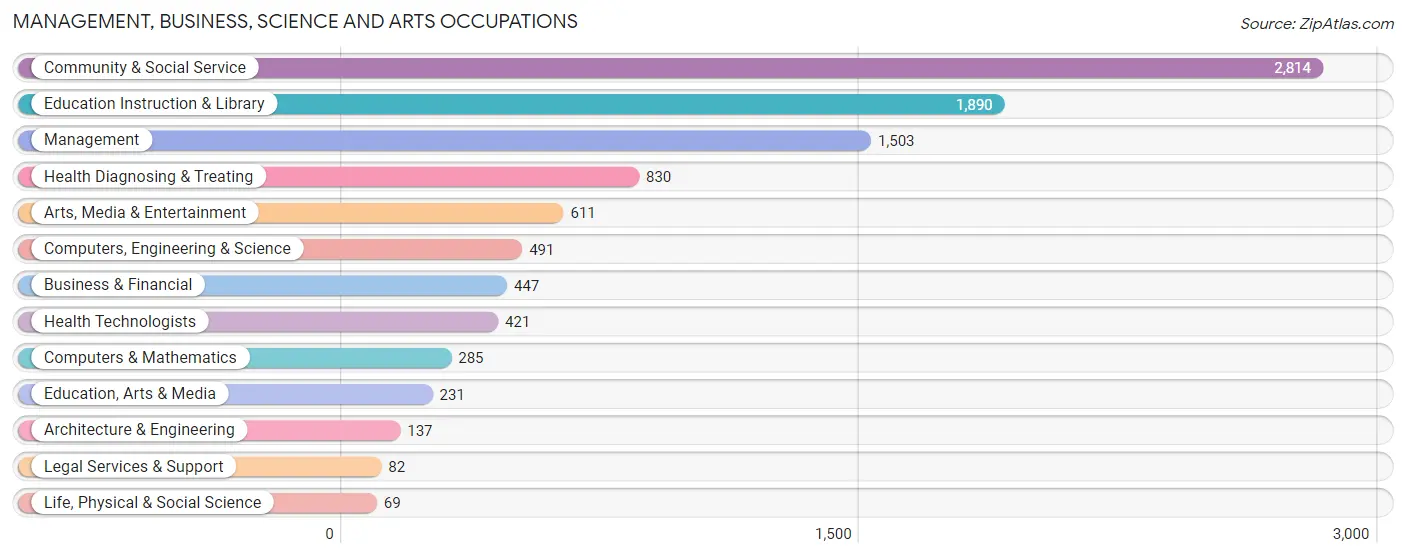
Management, Business, Science and Arts Occupations
The most common Management, Business, Science and Arts occupations in Jacksonville are Community & Social Service (2,814 | 15.5%), Education Instruction & Library (1,890 | 10.4%), Management (1,503 | 8.3%), Health Diagnosing & Treating (830 | 4.6%), and Arts, Media & Entertainment (611 | 3.4%).
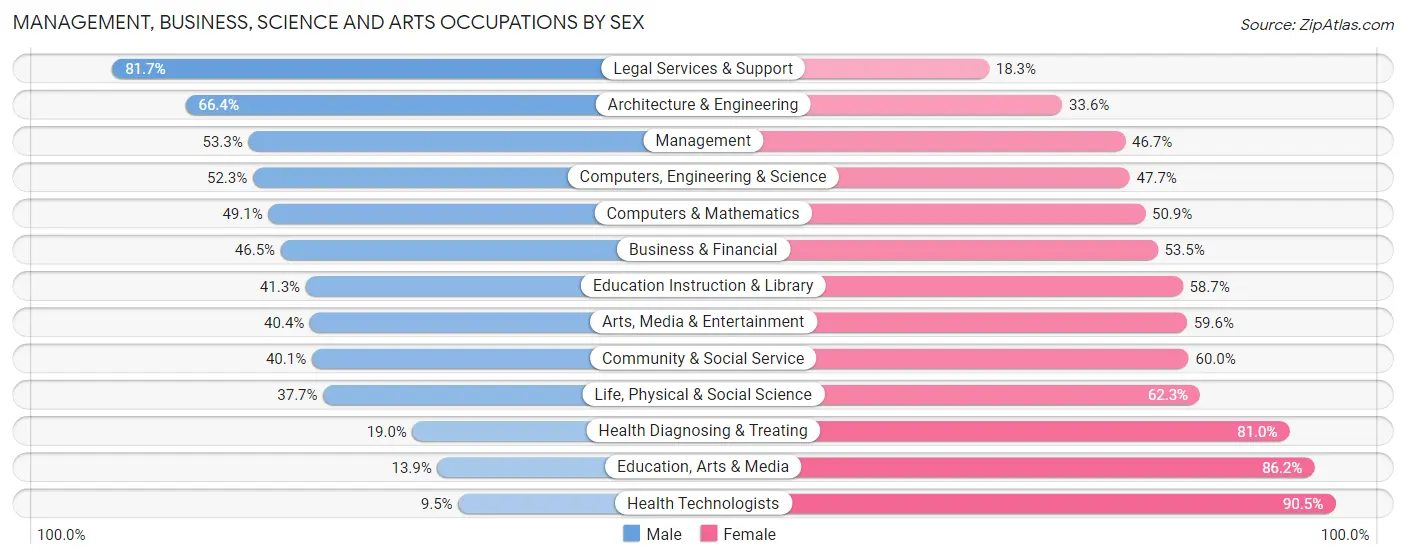
Management, Business, Science and Arts Occupations by Sex
Within the Management, Business, Science and Arts occupations in Jacksonville, the most male-oriented occupations are Legal Services & Support (81.7%), Architecture & Engineering (66.4%), and Management (53.3%), while the most female-oriented occupations are Health Technologists (90.5%), Education, Arts & Media (86.2%), and Health Diagnosing & Treating (81.0%).
| Occupation | Male | Female |
| Management | 801 (53.3%) | 702 (46.7%) |
| Business & Financial | 208 (46.5%) | 239 (53.5%) |
| Computers, Engineering & Science | 257 (52.3%) | 234 (47.7%) |
| Computers & Mathematics | 140 (49.1%) | 145 (50.9%) |
| Architecture & Engineering | 91 (66.4%) | 46 (33.6%) |
| Life, Physical & Social Science | 26 (37.7%) | 43 (62.3%) |
| Community & Social Service | 1,127 (40.1%) | 1,687 (60.0%) |
| Education, Arts & Media | 32 (13.9%) | 199 (86.2%) |
| Legal Services & Support | 67 (81.7%) | 15 (18.3%) |
| Education Instruction & Library | 781 (41.3%) | 1,109 (58.7%) |
| Arts, Media & Entertainment | 247 (40.4%) | 364 (59.6%) |
| Health Diagnosing & Treating | 158 (19.0%) | 672 (81.0%) |
| Health Technologists | 40 (9.5%) | 381 (90.5%) |
| Total (Category) | 2,551 (41.9%) | 3,534 (58.1%) |
| Total (Overall) | 8,272 (45.7%) | 9,828 (54.3%) |
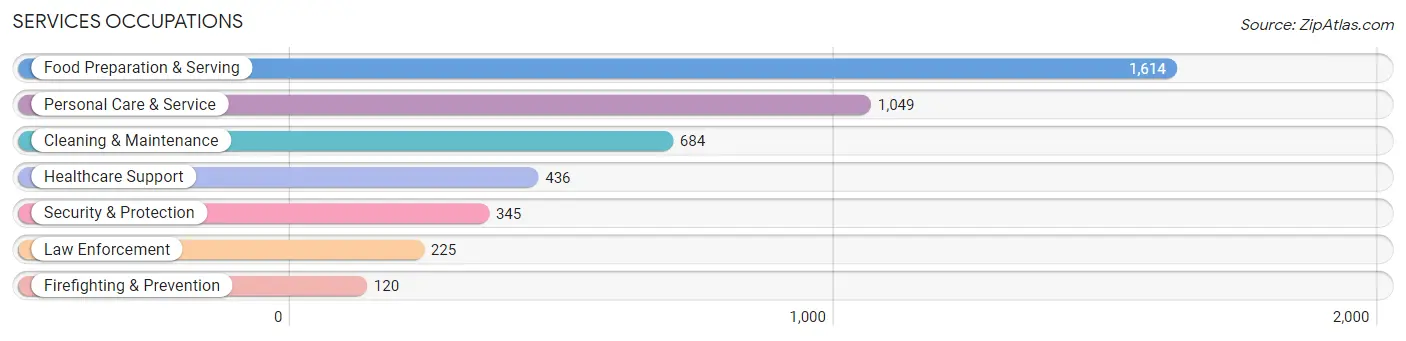
Services Occupations
The most common Services occupations in Jacksonville are Food Preparation & Serving (1,614 | 8.9%), Personal Care & Service (1,049 | 5.8%), Cleaning & Maintenance (684 | 3.8%), Healthcare Support (436 | 2.4%), and Security & Protection (345 | 1.9%).
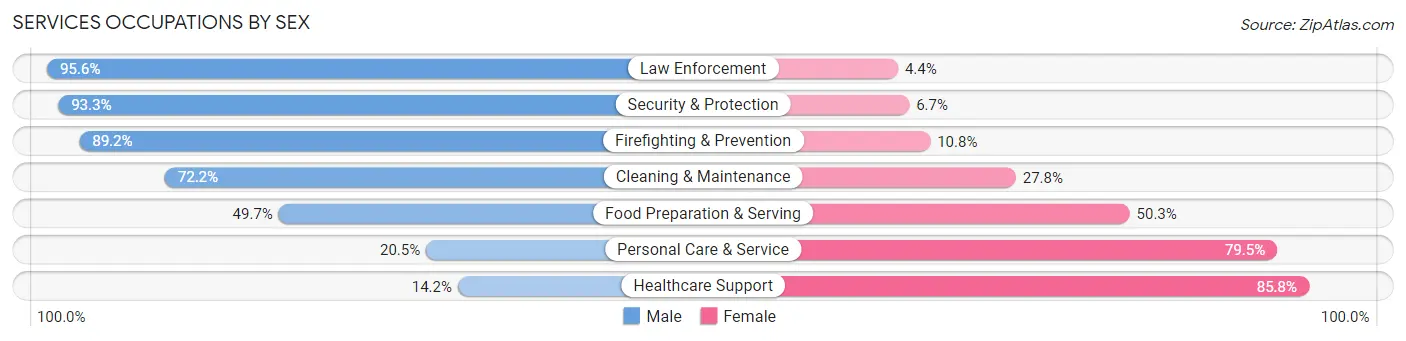
Services Occupations by Sex
Within the Services occupations in Jacksonville, the most male-oriented occupations are Law Enforcement (95.6%), Security & Protection (93.3%), and Firefighting & Prevention (89.2%), while the most female-oriented occupations are Healthcare Support (85.8%), Personal Care & Service (79.5%), and Food Preparation & Serving (50.3%).
| Occupation | Male | Female |
| Healthcare Support | 62 (14.2%) | 374 (85.8%) |
| Security & Protection | 322 (93.3%) | 23 (6.7%) |
| Firefighting & Prevention | 107 (89.2%) | 13 (10.8%) |
| Law Enforcement | 215 (95.6%) | 10 (4.4%) |
| Food Preparation & Serving | 802 (49.7%) | 812 (50.3%) |
| Cleaning & Maintenance | 494 (72.2%) | 190 (27.8%) |
| Personal Care & Service | 215 (20.5%) | 834 (79.5%) |
| Total (Category) | 1,895 (45.9%) | 2,233 (54.1%) |
| Total (Overall) | 8,272 (45.7%) | 9,828 (54.3%) |
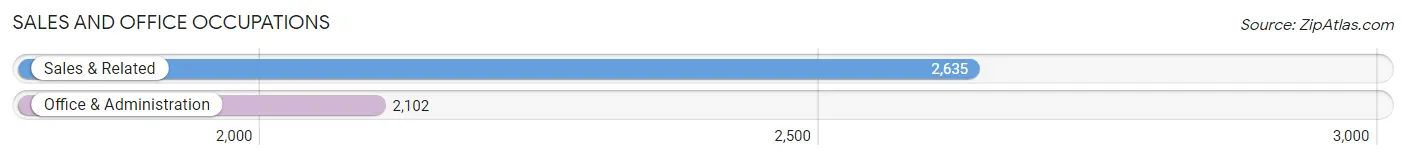
Sales and Office Occupations
The most common Sales and Office occupations in Jacksonville are Sales & Related (2,635 | 14.6%), and Office & Administration (2,102 | 11.6%).
Sales and Office Occupations by Sex
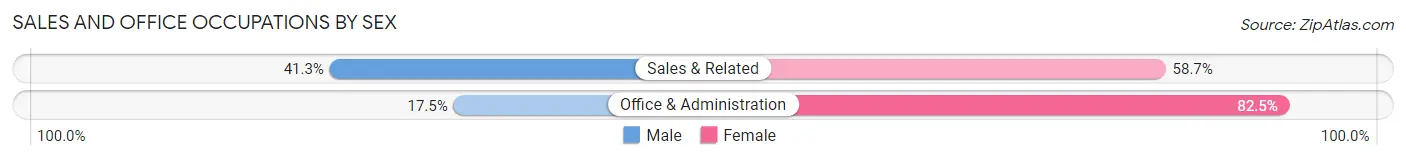
| Occupation | Male | Female |
| Sales & Related | 1,089 (41.3%) | 1,546 (58.7%) |
| Office & Administration | 368 (17.5%) | 1,734 (82.5%) |
| Total (Category) | 1,457 (30.8%) | 3,280 (69.2%) |
| Total (Overall) | 8,272 (45.7%) | 9,828 (54.3%) |
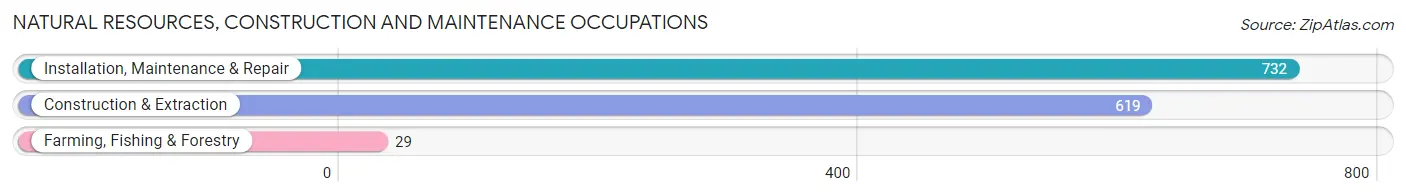
Natural Resources, Construction and Maintenance Occupations
The most common Natural Resources, Construction and Maintenance occupations in Jacksonville are Installation, Maintenance & Repair (732 | 4.0%), Construction & Extraction (619 | 3.4%), and Farming, Fishing & Forestry (29 | 0.2%).
Natural Resources, Construction and Maintenance Occupations by Sex
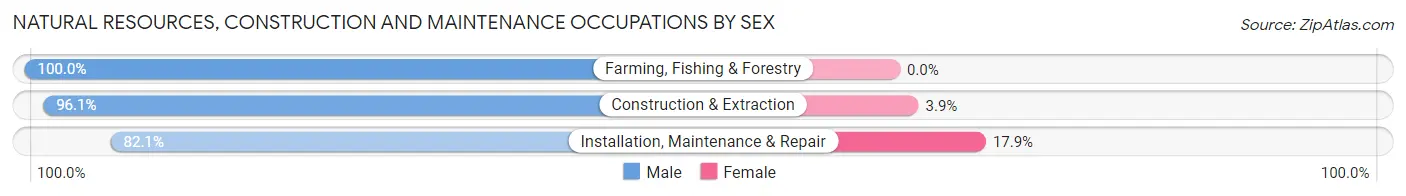
| Occupation | Male | Female |
| Farming, Fishing & Forestry | 29 (100.0%) | 0 (0.0%) |
| Construction & Extraction | 595 (96.1%) | 24 (3.9%) |
| Installation, Maintenance & Repair | 601 (82.1%) | 131 (17.9%) |
| Total (Category) | 1,225 (88.8%) | 155 (11.2%) |
| Total (Overall) | 8,272 (45.7%) | 9,828 (54.3%) |
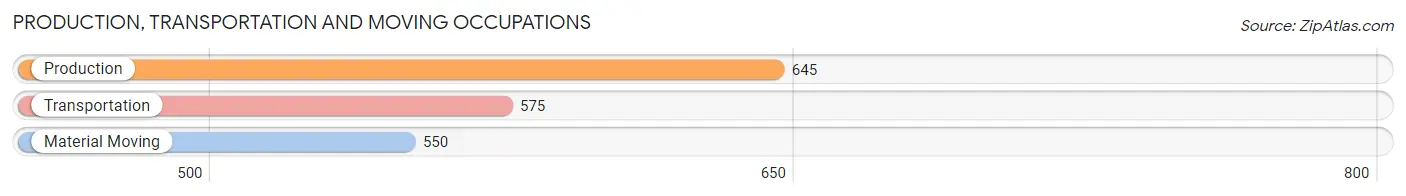
Production, Transportation and Moving Occupations
The most common Production, Transportation and Moving occupations in Jacksonville are Production (645 | 3.6%), Transportation (575 | 3.2%), and Material Moving (550 | 3.0%).
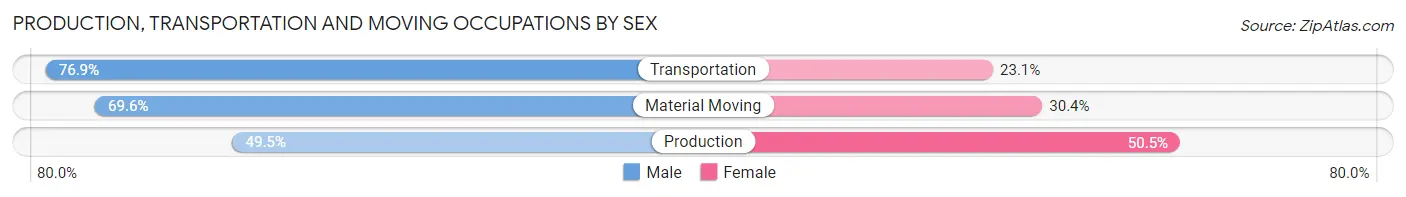
Production, Transportation and Moving Occupations by Sex
| Occupation | Male | Female |
| Production | 319 (49.5%) | 326 (50.5%) |
| Transportation | 442 (76.9%) | 133 (23.1%) |
| Material Moving | 383 (69.6%) | 167 (30.4%) |
| Total (Category) | 1,144 (64.6%) | 626 (35.4%) |
| Total (Overall) | 8,272 (45.7%) | 9,828 (54.3%) |
Employment Industries by Sex in Jacksonville
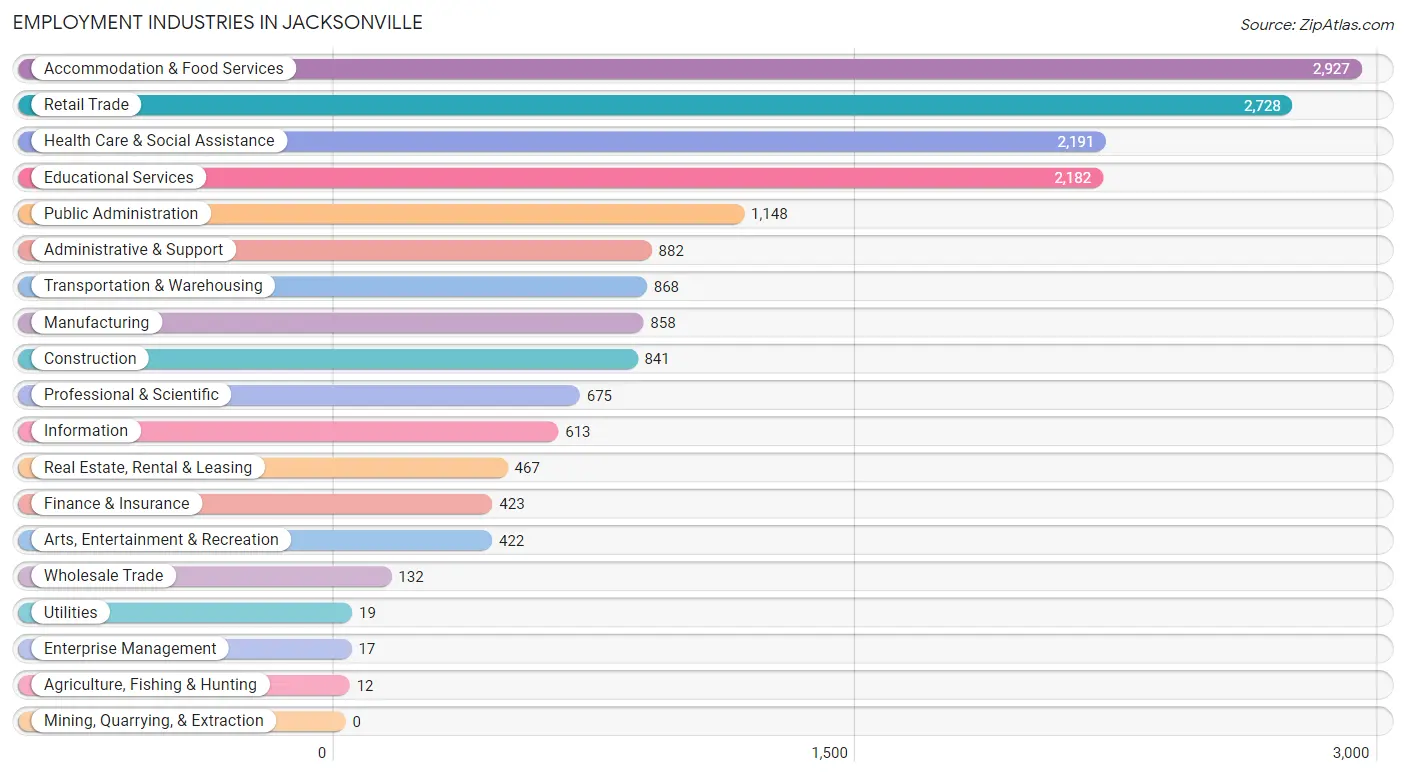
Employment Industries in Jacksonville
The major employment industries in Jacksonville include Accommodation & Food Services (2,927 | 16.2%), Retail Trade (2,728 | 15.1%), Health Care & Social Assistance (2,191 | 12.1%), Educational Services (2,182 | 12.1%), and Public Administration (1,148 | 6.3%).
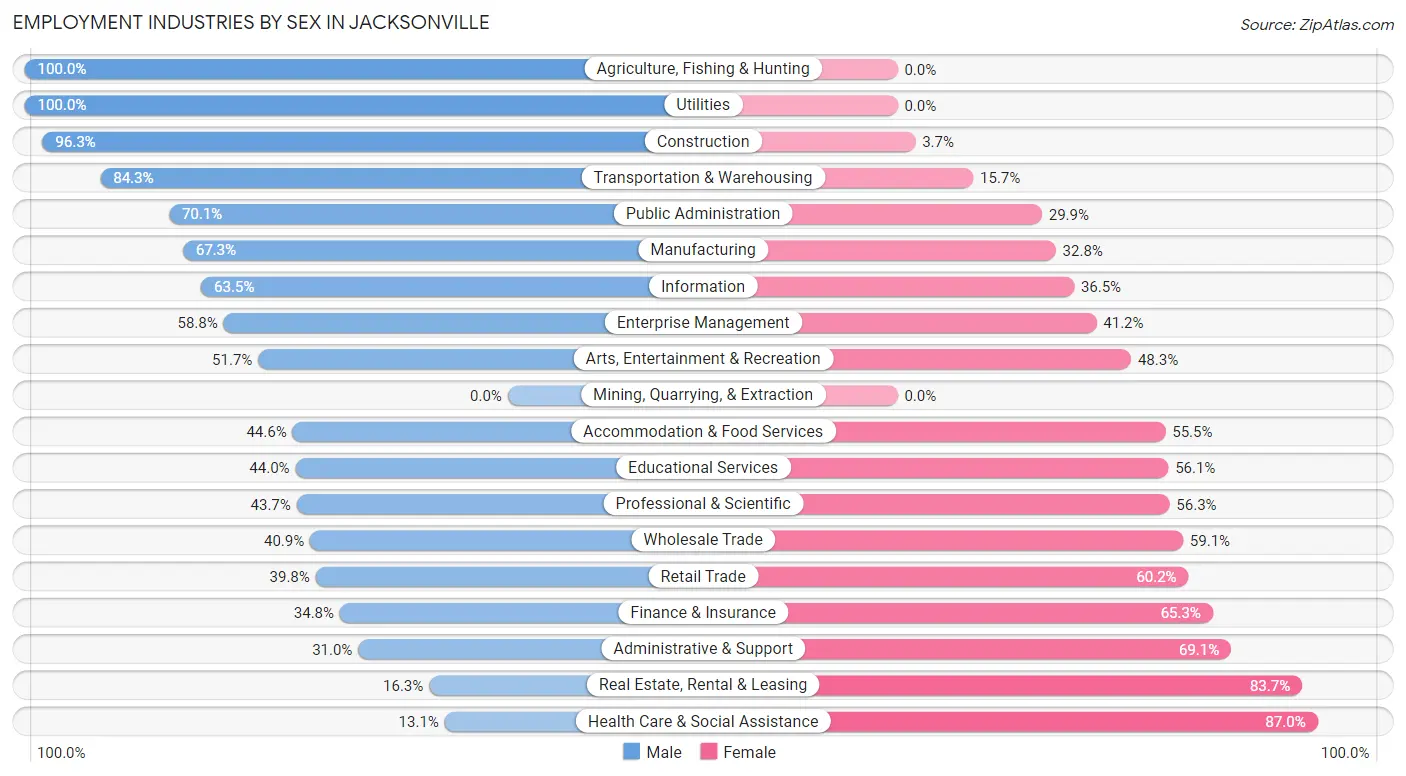
Employment Industries by Sex in Jacksonville
The Jacksonville industries that see more men than women are Agriculture, Fishing & Hunting (100.0%), Utilities (100.0%), and Construction (96.3%), whereas the industries that tend to have a higher number of women are Health Care & Social Assistance (87.0%), Real Estate, Rental & Leasing (83.7%), and Administrative & Support (69.1%).
| Industry | Male | Female |
| Agriculture, Fishing & Hunting | 12 (100.0%) | 0 (0.0%) |
| Mining, Quarrying, & Extraction | 0 (0.0%) | 0 (0.0%) |
| Construction | 810 (96.3%) | 31 (3.7%) |
| Manufacturing | 577 (67.2%) | 281 (32.8%) |
| Wholesale Trade | 54 (40.9%) | 78 (59.1%) |
| Retail Trade | 1,085 (39.8%) | 1,643 (60.2%) |
| Transportation & Warehousing | 732 (84.3%) | 136 (15.7%) |
| Utilities | 19 (100.0%) | 0 (0.0%) |
| Information | 389 (63.5%) | 224 (36.5%) |
| Finance & Insurance | 147 (34.7%) | 276 (65.2%) |
| Real Estate, Rental & Leasing | 76 (16.3%) | 391 (83.7%) |
| Professional & Scientific | 295 (43.7%) | 380 (56.3%) |
| Enterprise Management | 10 (58.8%) | 7 (41.2%) |
| Administrative & Support | 273 (30.9%) | 609 (69.1%) |
| Educational Services | 959 (44.0%) | 1,223 (56.0%) |
| Health Care & Social Assistance | 286 (13.1%) | 1,905 (87.0%) |
| Arts, Entertainment & Recreation | 218 (51.7%) | 204 (48.3%) |
| Accommodation & Food Services | 1,304 (44.6%) | 1,623 (55.4%) |
| Public Administration | 805 (70.1%) | 343 (29.9%) |
| Total | 8,272 (45.7%) | 9,828 (54.3%) |
Education in Jacksonville
School Enrollment in Jacksonville
The most common levels of schooling among the 14,799 students in Jacksonville are college / undergraduate (5,244 | 35.4%), elementary school (2,821 | 19.1%), and middle school (2,614 | 17.7%).
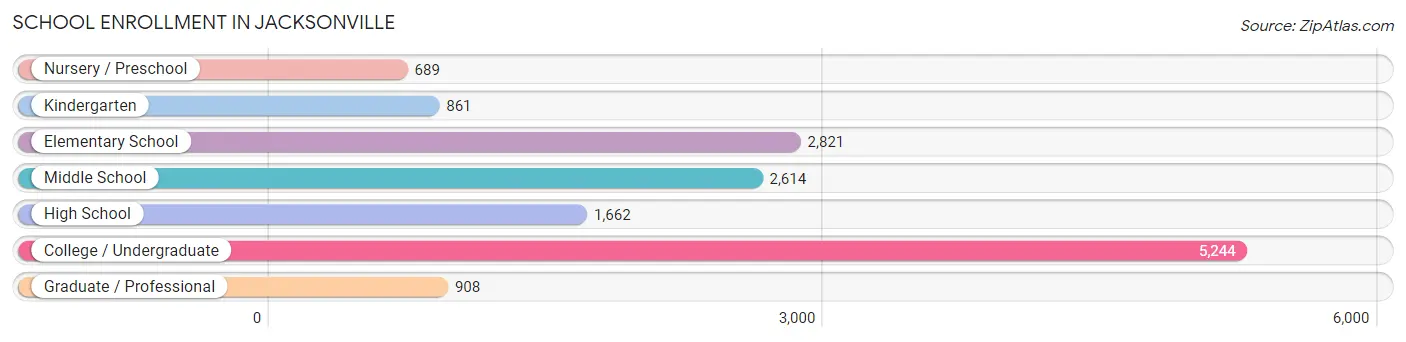
| School Level | # Students | % Students |
| Nursery / Preschool | 689 | 4.7% |
| Kindergarten | 861 | 5.8% |
| Elementary School | 2,821 | 19.1% |
| Middle School | 2,614 | 17.7% |
| High School | 1,662 | 11.2% |
| College / Undergraduate | 5,244 | 35.4% |
| Graduate / Professional | 908 | 6.1% |
| Total | 14,799 | 100.0% |
School Enrollment by Age by Funding Source in Jacksonville
Out of a total of 14,799 students who are enrolled in schools in Jacksonville, 1,761 (11.9%) attend a private institution, while the remaining 13,038 (88.1%) are enrolled in public schools. The age group of 3 to 4 year olds has the highest likelihood of being enrolled in private schools, with 209 (40.1% in the age bracket) enrolled. Conversely, the age group of 15 to 17 year olds has the lowest likelihood of being enrolled in a private school, with 1,332 (95.1% in the age bracket) attending a public institution.
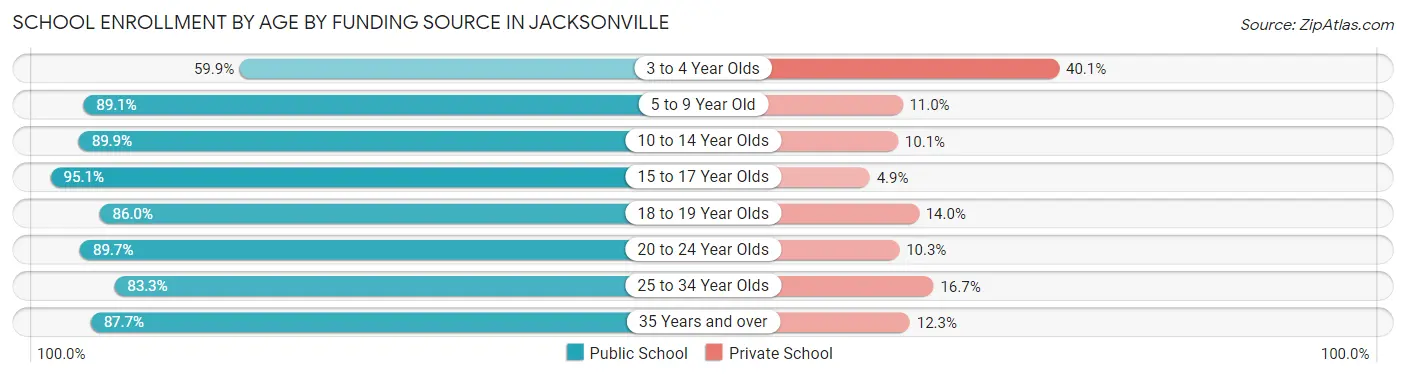
| Age Bracket | Public School | Private School |
| 3 to 4 Year Olds | 312 (59.9%) | 209 (40.1%) |
| 5 to 9 Year Old | 3,269 (89.0%) | 402 (11.0%) |
| 10 to 14 Year Olds | 2,643 (89.9%) | 297 (10.1%) |
| 15 to 17 Year Olds | 1,332 (95.1%) | 68 (4.9%) |
| 18 to 19 Year Olds | 554 (86.0%) | 90 (14.0%) |
| 20 to 24 Year Olds | 2,791 (89.7%) | 322 (10.3%) |
| 25 to 34 Year Olds | 1,279 (83.3%) | 257 (16.7%) |
| 35 Years and over | 854 (87.7%) | 120 (12.3%) |
| Total | 13,038 (88.1%) | 1,761 (11.9%) |
Educational Attainment by Field of Study in Jacksonville
Science & technology (1,392 | 17.2%), business (1,253 | 15.5%), education (1,233 | 15.3%), arts & humanities (911 | 11.3%), and social sciences (757 | 9.4%) are the most common fields of study among 8,073 individuals in Jacksonville who have obtained a bachelor's degree or higher.
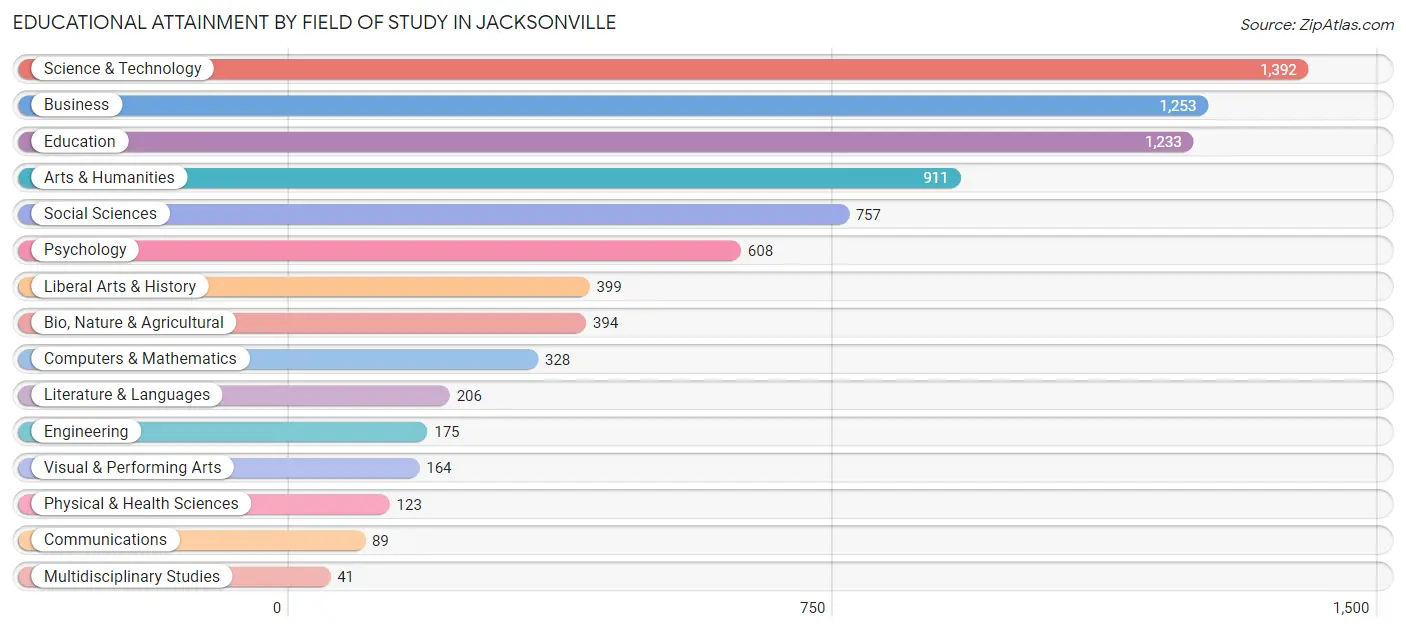
| Field of Study | # Graduates | % Graduates |
| Computers & Mathematics | 328 | 4.1% |
| Bio, Nature & Agricultural | 394 | 4.9% |
| Physical & Health Sciences | 123 | 1.5% |
| Psychology | 608 | 7.5% |
| Social Sciences | 757 | 9.4% |
| Engineering | 175 | 2.2% |
| Multidisciplinary Studies | 41 | 0.5% |
| Science & Technology | 1,392 | 17.2% |
| Business | 1,253 | 15.5% |
| Education | 1,233 | 15.3% |
| Literature & Languages | 206 | 2.5% |
| Liberal Arts & History | 399 | 4.9% |
| Visual & Performing Arts | 164 | 2.0% |
| Communications | 89 | 1.1% |
| Arts & Humanities | 911 | 11.3% |
| Total | 8,073 | 100.0% |
Transportation & Commute in Jacksonville
Vehicle Availability by Sex in Jacksonville
The most prevalent vehicle ownership categories in Jacksonville are males with 2 vehicles (8,393, accounting for 53.6%) and females with 2 vehicles (4,062, making up 86.0%).
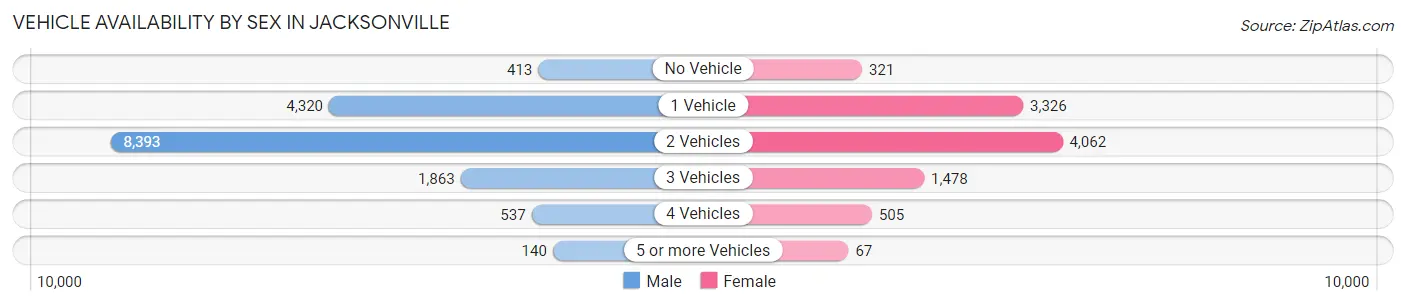
| Vehicles Available | Male | Female |
| No Vehicle | 413 (2.6%) | 321 (3.3%) |
| 1 Vehicle | 4,320 (27.6%) | 3,326 (34.1%) |
| 2 Vehicles | 8,393 (53.6%) | 4,062 (41.6%) |
| 3 Vehicles | 1,863 (11.9%) | 1,478 (15.1%) |
| 4 Vehicles | 537 (3.4%) | 505 (5.2%) |
| 5 or more Vehicles | 140 (0.9%) | 67 (0.7%) |
| Total | 15,666 (100.0%) | 9,759 (100.0%) |
Commute Time in Jacksonville
The most frequently occuring commute durations in Jacksonville are 5 to 9 minutes (10,234 commuters, 25.9%), 10 to 14 minutes (6,959 commuters, 17.6%), and 15 to 19 minutes (6,728 commuters, 17.0%).
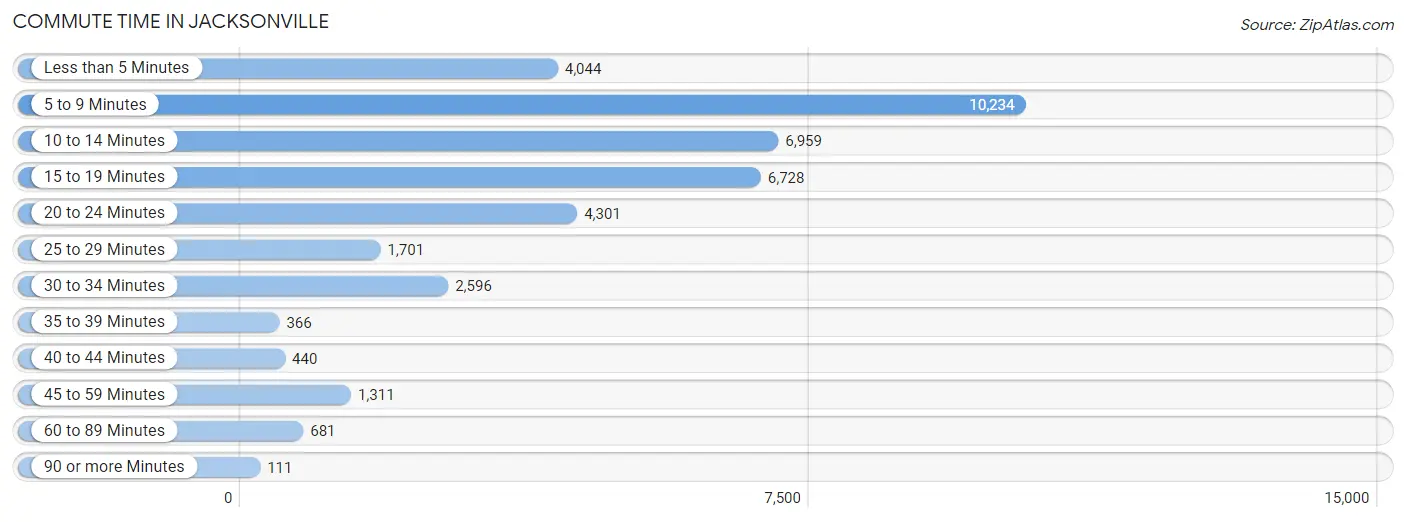
| Commute Time | # Commuters | % Commuters |
| Less than 5 Minutes | 4,044 | 10.2% |
| 5 to 9 Minutes | 10,234 | 25.9% |
| 10 to 14 Minutes | 6,959 | 17.6% |
| 15 to 19 Minutes | 6,728 | 17.0% |
| 20 to 24 Minutes | 4,301 | 10.9% |
| 25 to 29 Minutes | 1,701 | 4.3% |
| 30 to 34 Minutes | 2,596 | 6.6% |
| 35 to 39 Minutes | 366 | 0.9% |
| 40 to 44 Minutes | 440 | 1.1% |
| 45 to 59 Minutes | 1,311 | 3.3% |
| 60 to 89 Minutes | 681 | 1.7% |
| 90 or more Minutes | 111 | 0.3% |
Commute Time by Sex in Jacksonville
The most common commute times in Jacksonville are 5 to 9 minutes (8,307 commuters, 27.9%) for males and 10 to 14 minutes (2,224 commuters, 22.9%) for females.
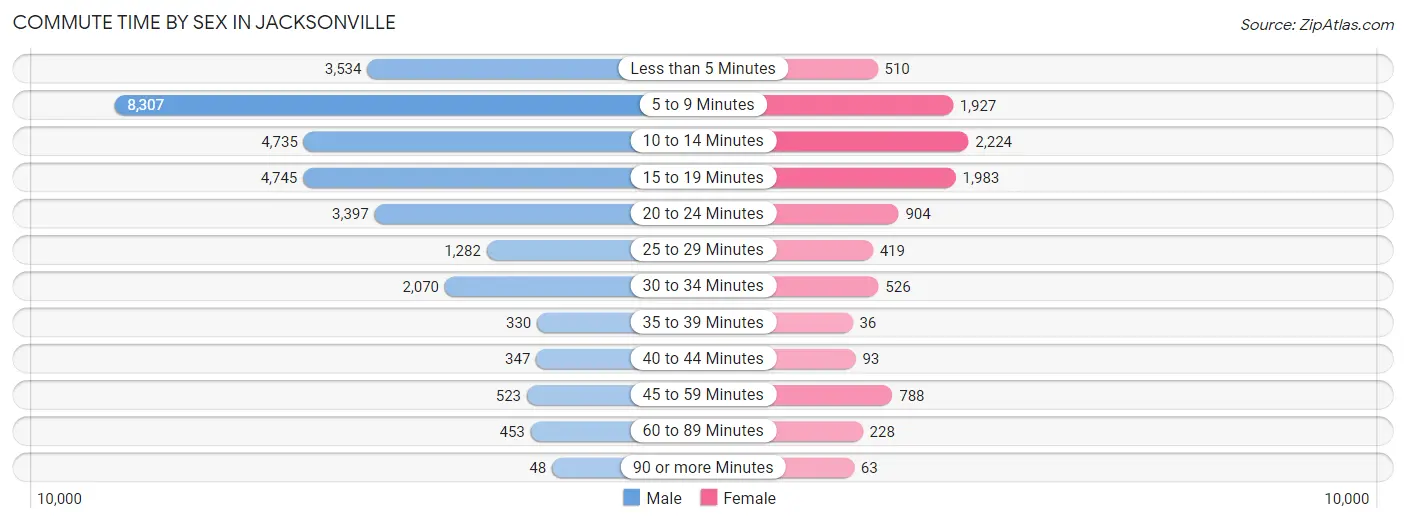
| Commute Time | Male | Female |
| Less than 5 Minutes | 3,534 (11.9%) | 510 (5.3%) |
| 5 to 9 Minutes | 8,307 (27.9%) | 1,927 (19.9%) |
| 10 to 14 Minutes | 4,735 (15.9%) | 2,224 (22.9%) |
| 15 to 19 Minutes | 4,745 (15.9%) | 1,983 (20.4%) |
| 20 to 24 Minutes | 3,397 (11.4%) | 904 (9.3%) |
| 25 to 29 Minutes | 1,282 (4.3%) | 419 (4.3%) |
| 30 to 34 Minutes | 2,070 (7.0%) | 526 (5.4%) |
| 35 to 39 Minutes | 330 (1.1%) | 36 (0.4%) |
| 40 to 44 Minutes | 347 (1.2%) | 93 (1.0%) |
| 45 to 59 Minutes | 523 (1.8%) | 788 (8.1%) |
| 60 to 89 Minutes | 453 (1.5%) | 228 (2.4%) |
| 90 or more Minutes | 48 (0.2%) | 63 (0.6%) |
Time of Departure to Work by Sex in Jacksonville
The most frequent times of departure to work in Jacksonville are 7:00 AM to 7:29 AM (6,118, 20.5%) for males and 6:30 AM to 6:59 AM (1,291, 13.3%) for females.
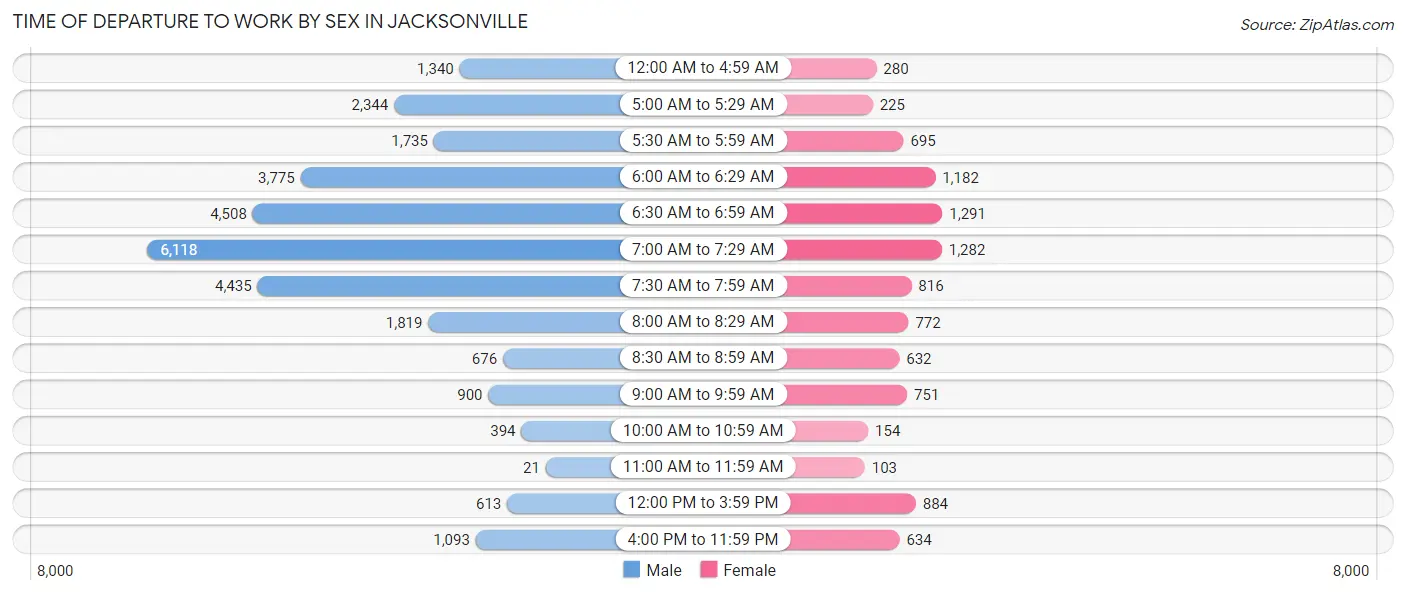
| Time of Departure | Male | Female |
| 12:00 AM to 4:59 AM | 1,340 (4.5%) | 280 (2.9%) |
| 5:00 AM to 5:29 AM | 2,344 (7.9%) | 225 (2.3%) |
| 5:30 AM to 5:59 AM | 1,735 (5.8%) | 695 (7.2%) |
| 6:00 AM to 6:29 AM | 3,775 (12.7%) | 1,182 (12.2%) |
| 6:30 AM to 6:59 AM | 4,508 (15.1%) | 1,291 (13.3%) |
| 7:00 AM to 7:29 AM | 6,118 (20.5%) | 1,282 (13.2%) |
| 7:30 AM to 7:59 AM | 4,435 (14.9%) | 816 (8.4%) |
| 8:00 AM to 8:29 AM | 1,819 (6.1%) | 772 (8.0%) |
| 8:30 AM to 8:59 AM | 676 (2.3%) | 632 (6.5%) |
| 9:00 AM to 9:59 AM | 900 (3.0%) | 751 (7.7%) |
| 10:00 AM to 10:59 AM | 394 (1.3%) | 154 (1.6%) |
| 11:00 AM to 11:59 AM | 21 (0.1%) | 103 (1.1%) |
| 12:00 PM to 3:59 PM | 613 (2.1%) | 884 (9.1%) |
| 4:00 PM to 11:59 PM | 1,093 (3.7%) | 634 (6.5%) |
| Total | 29,771 (100.0%) | 9,701 (100.0%) |
Housing Occupancy in Jacksonville
Occupancy by Ownership in Jacksonville
Of the total 22,089 dwellings in Jacksonville, owner-occupied units account for 7,851 (35.5%), while renter-occupied units make up 14,238 (64.5%).
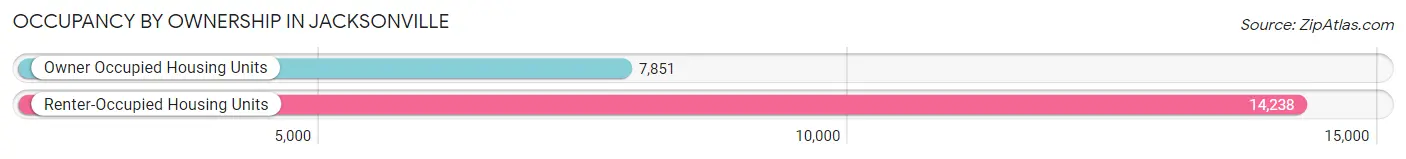
| Occupancy | # Housing Units | % Housing Units |
| Owner Occupied Housing Units | 7,851 | 35.5% |
| Renter-Occupied Housing Units | 14,238 | 64.5% |
| Total Occupied Housing Units | 22,089 | 100.0% |
Occupancy by Household Size in Jacksonville
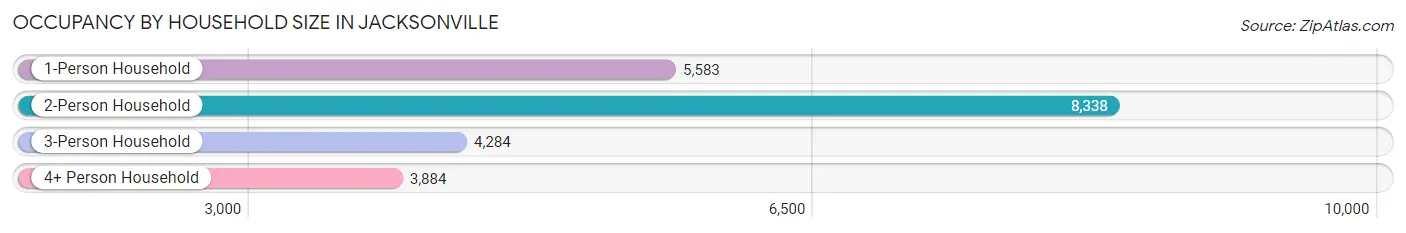
| Household Size | # Housing Units | % Housing Units |
| 1-Person Household | 5,583 | 25.3% |
| 2-Person Household | 8,338 | 37.8% |
| 3-Person Household | 4,284 | 19.4% |
| 4+ Person Household | 3,884 | 17.6% |
| Total Housing Units | 22,089 | 100.0% |
Occupancy by Ownership by Household Size in Jacksonville
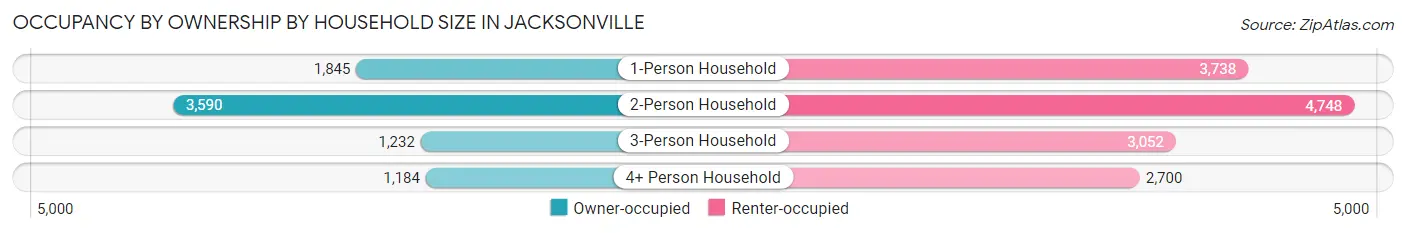
| Household Size | Owner-occupied | Renter-occupied |
| 1-Person Household | 1,845 (33.1%) | 3,738 (66.9%) |
| 2-Person Household | 3,590 (43.1%) | 4,748 (56.9%) |
| 3-Person Household | 1,232 (28.8%) | 3,052 (71.2%) |
| 4+ Person Household | 1,184 (30.5%) | 2,700 (69.5%) |
| Total Housing Units | 7,851 (35.5%) | 14,238 (64.5%) |
Occupancy by Educational Attainment in Jacksonville
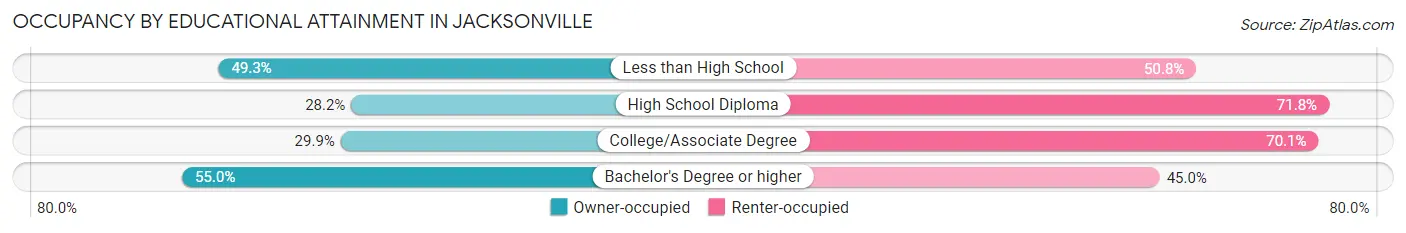
| Household Size | Owner-occupied | Renter-occupied |
| Less than High School | 686 (49.2%) | 707 (50.7%) |
| High School Diploma | 2,097 (28.2%) | 5,339 (71.8%) |
| College/Associate Degree | 2,646 (29.9%) | 6,213 (70.1%) |
| Bachelor's Degree or higher | 2,422 (55.0%) | 1,979 (45.0%) |
Occupancy by Age of Householder in Jacksonville
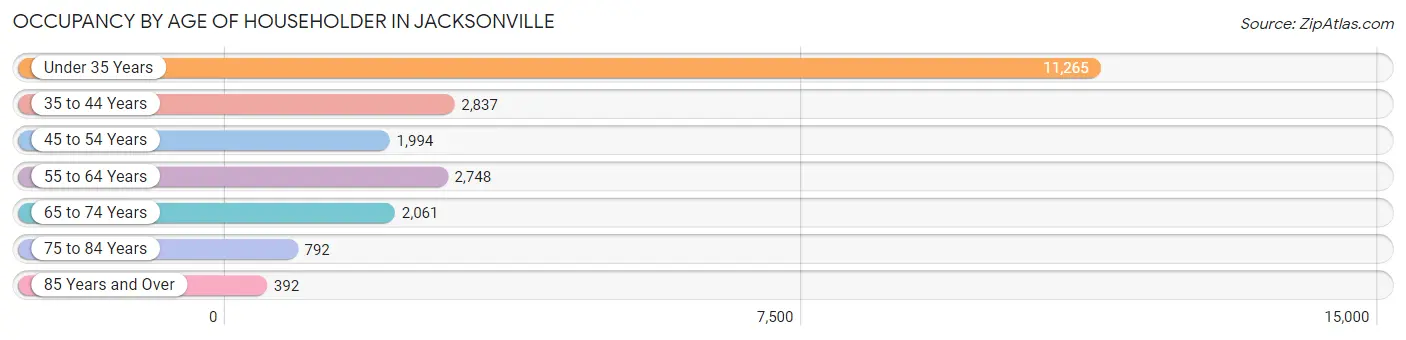
| Age Bracket | # Households | % Households |
| Under 35 Years | 11,265 | 51.0% |
| 35 to 44 Years | 2,837 | 12.8% |
| 45 to 54 Years | 1,994 | 9.0% |
| 55 to 64 Years | 2,748 | 12.4% |
| 65 to 74 Years | 2,061 | 9.3% |
| 75 to 84 Years | 792 | 3.6% |
| 85 Years and Over | 392 | 1.8% |
| Total | 22,089 | 100.0% |
Housing Finances in Jacksonville
Median Income by Occupancy in Jacksonville
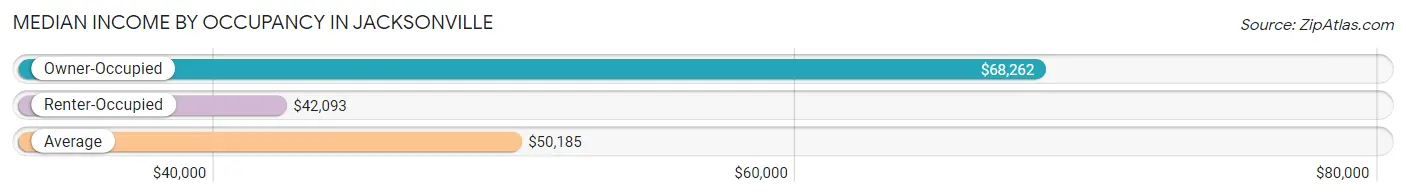
| Occupancy Type | # Households | Median Income |
| Owner-Occupied | 7,851 (35.5%) | $68,262 |
| Renter-Occupied | 14,238 (64.5%) | $42,093 |
| Average | 22,089 (100.0%) | $50,185 |
Occupancy by Householder Income Bracket in Jacksonville
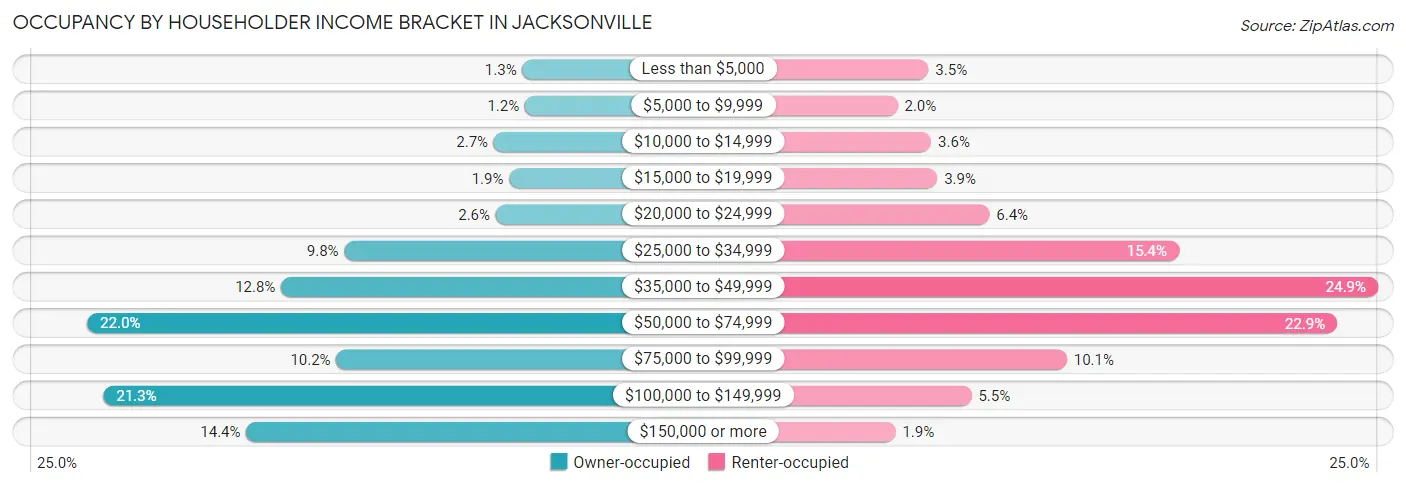
| Income Bracket | Owner-occupied | Renter-occupied |
| Less than $5,000 | 101 (1.3%) | 494 (3.5%) |
| $5,000 to $9,999 | 92 (1.2%) | 285 (2.0%) |
| $10,000 to $14,999 | 208 (2.6%) | 512 (3.6%) |
| $15,000 to $19,999 | 151 (1.9%) | 554 (3.9%) |
| $20,000 to $24,999 | 201 (2.6%) | 907 (6.4%) |
| $25,000 to $34,999 | 767 (9.8%) | 2,191 (15.4%) |
| $35,000 to $49,999 | 1,003 (12.8%) | 3,541 (24.9%) |
| $50,000 to $74,999 | 1,729 (22.0%) | 3,265 (22.9%) |
| $75,000 to $99,999 | 797 (10.2%) | 1,432 (10.1%) |
| $100,000 to $149,999 | 1,668 (21.2%) | 786 (5.5%) |
| $150,000 or more | 1,134 (14.4%) | 271 (1.9%) |
| Total | 7,851 (100.0%) | 14,238 (100.0%) |
Monthly Housing Cost Tiers in Jacksonville
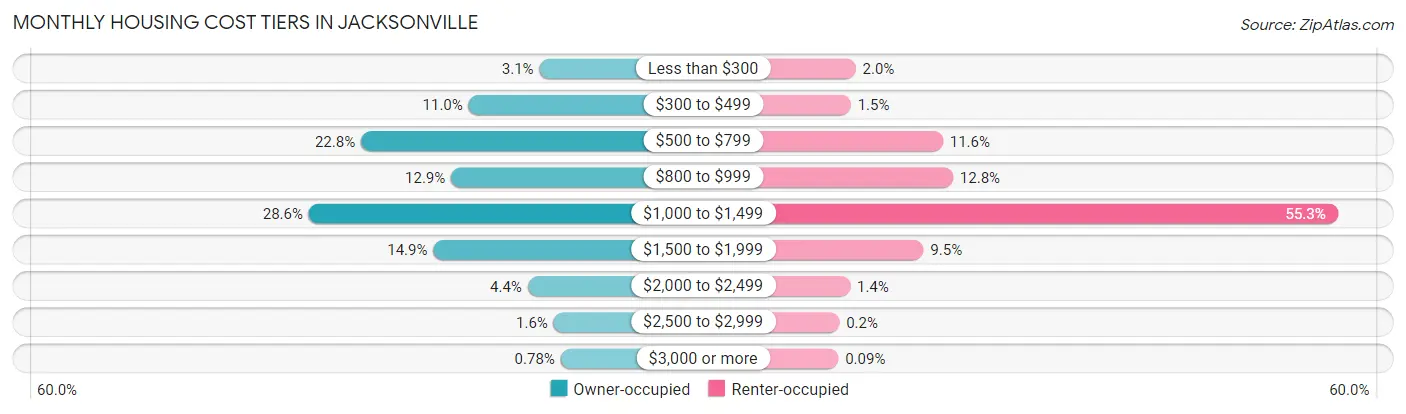
| Monthly Cost | Owner-occupied | Renter-occupied |
| Less than $300 | 246 (3.1%) | 286 (2.0%) |
| $300 to $499 | 860 (11.0%) | 210 (1.5%) |
| $500 to $799 | 1,793 (22.8%) | 1,657 (11.6%) |
| $800 to $999 | 1,011 (12.9%) | 1,817 (12.8%) |
| $1,000 to $1,499 | 2,245 (28.6%) | 7,866 (55.2%) |
| $1,500 to $1,999 | 1,166 (14.8%) | 1,352 (9.5%) |
| $2,000 to $2,499 | 347 (4.4%) | 198 (1.4%) |
| $2,500 to $2,999 | 122 (1.5%) | 29 (0.2%) |
| $3,000 or more | 61 (0.8%) | 13 (0.1%) |
| Total | 7,851 (100.0%) | 14,238 (100.0%) |
Physical Housing Characteristics in Jacksonville
Housing Structures in Jacksonville
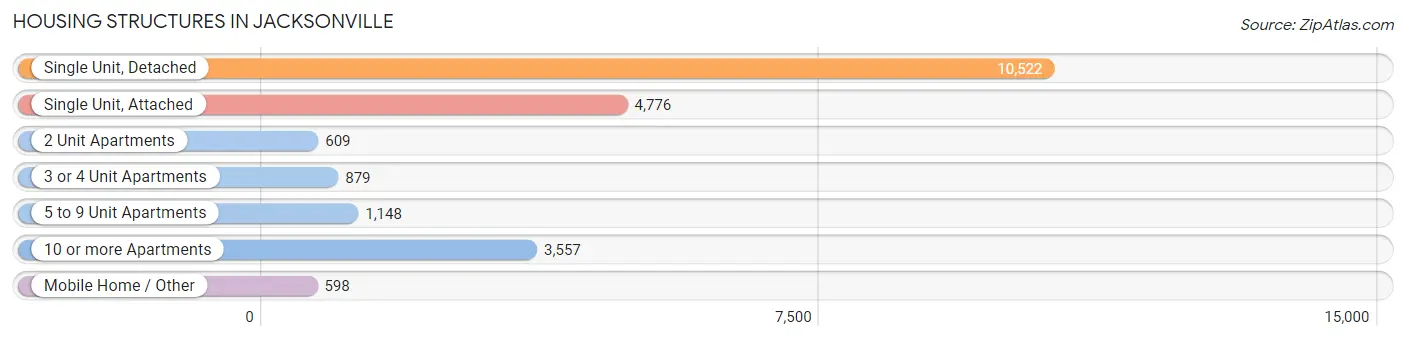
| Structure Type | # Housing Units | % Housing Units |
| Single Unit, Detached | 10,522 | 47.6% |
| Single Unit, Attached | 4,776 | 21.6% |
| 2 Unit Apartments | 609 | 2.8% |
| 3 or 4 Unit Apartments | 879 | 4.0% |
| 5 to 9 Unit Apartments | 1,148 | 5.2% |
| 10 or more Apartments | 3,557 | 16.1% |
| Mobile Home / Other | 598 | 2.7% |
| Total | 22,089 | 100.0% |
Housing Structures by Occupancy in Jacksonville
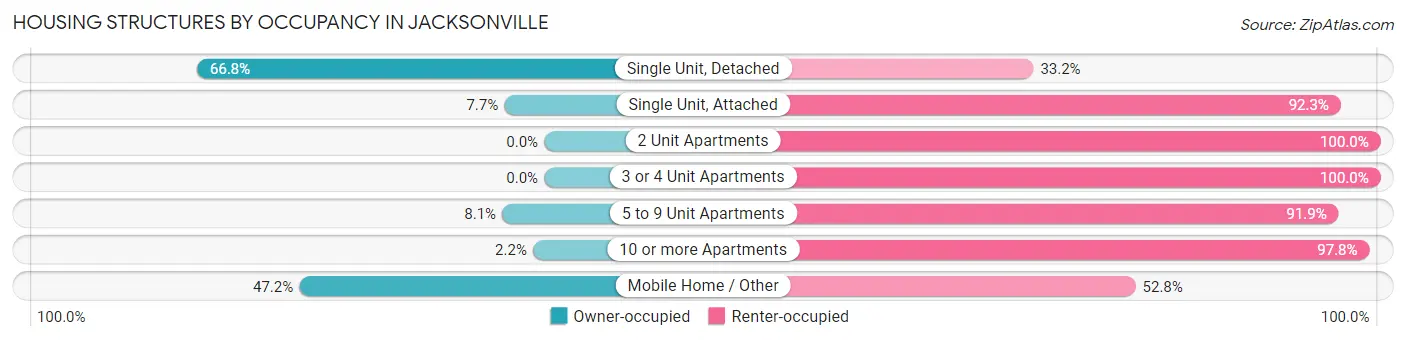
| Structure Type | Owner-occupied | Renter-occupied |
| Single Unit, Detached | 7,032 (66.8%) | 3,490 (33.2%) |
| Single Unit, Attached | 367 (7.7%) | 4,409 (92.3%) |
| 2 Unit Apartments | 0 (0.0%) | 609 (100.0%) |
| 3 or 4 Unit Apartments | 0 (0.0%) | 879 (100.0%) |
| 5 to 9 Unit Apartments | 93 (8.1%) | 1,055 (91.9%) |
| 10 or more Apartments | 77 (2.2%) | 3,480 (97.8%) |
| Mobile Home / Other | 282 (47.2%) | 316 (52.8%) |
| Total | 7,851 (35.5%) | 14,238 (64.5%) |
Housing Structures by Number of Rooms in Jacksonville
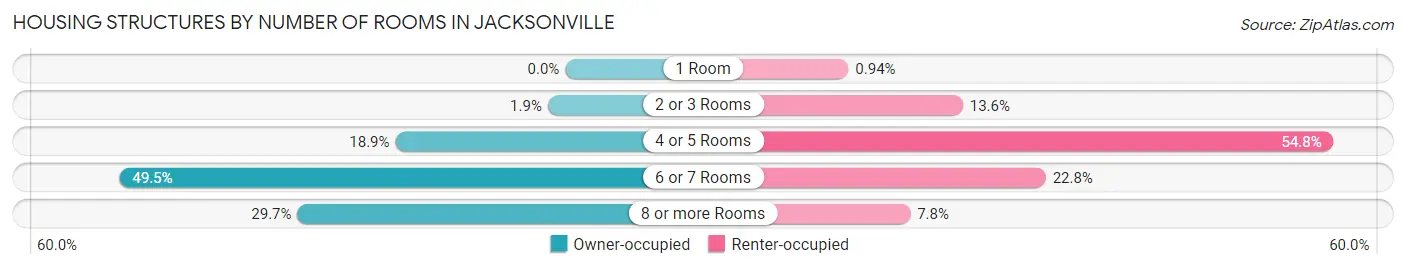
| Number of Rooms | Owner-occupied | Renter-occupied |
| 1 Room | 0 (0.0%) | 134 (0.9%) |
| 2 or 3 Rooms | 152 (1.9%) | 1,942 (13.6%) |
| 4 or 5 Rooms | 1,480 (18.9%) | 7,799 (54.8%) |
| 6 or 7 Rooms | 3,885 (49.5%) | 3,252 (22.8%) |
| 8 or more Rooms | 2,334 (29.7%) | 1,111 (7.8%) |
| Total | 7,851 (100.0%) | 14,238 (100.0%) |
Housing Structure by Heating Type in Jacksonville
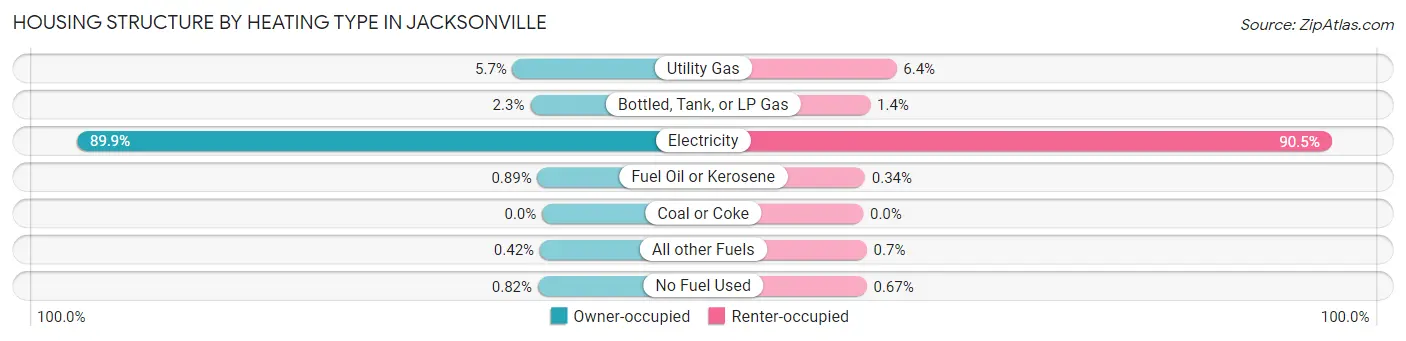
| Heating Type | Owner-occupied | Renter-occupied |
| Utility Gas | 447 (5.7%) | 915 (6.4%) |
| Bottled, Tank, or LP Gas | 180 (2.3%) | 194 (1.4%) |
| Electricity | 7,057 (89.9%) | 12,887 (90.5%) |
| Fuel Oil or Kerosene | 70 (0.9%) | 48 (0.3%) |
| Coal or Coke | 0 (0.0%) | 0 (0.0%) |
| All other Fuels | 33 (0.4%) | 99 (0.7%) |
| No Fuel Used | 64 (0.8%) | 95 (0.7%) |
| Total | 7,851 (100.0%) | 14,238 (100.0%) |
Household Vehicle Usage in Jacksonville
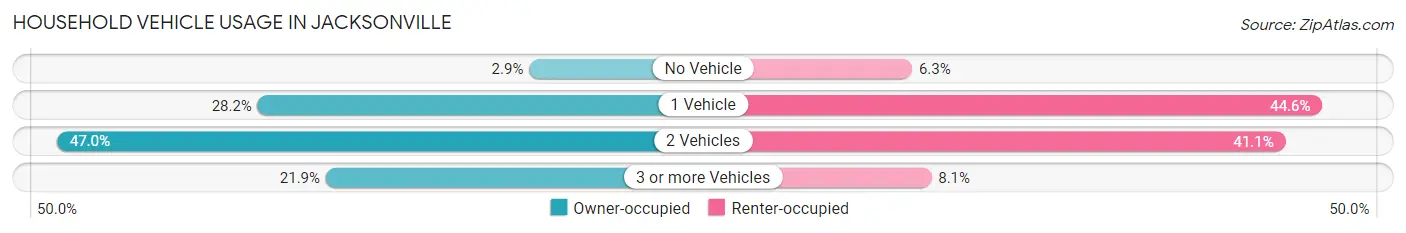
| Vehicles per Household | Owner-occupied | Renter-occupied |
| No Vehicle | 227 (2.9%) | 891 (6.3%) |
| 1 Vehicle | 2,217 (28.2%) | 6,344 (44.6%) |
| 2 Vehicles | 3,689 (47.0%) | 5,856 (41.1%) |
| 3 or more Vehicles | 1,718 (21.9%) | 1,147 (8.1%) |
| Total | 7,851 (100.0%) | 14,238 (100.0%) |
Real Estate & Mortgages in Jacksonville
Real Estate and Mortgage Overview in Jacksonville
| Characteristic | Without Mortgage | With Mortgage |
| Housing Units | 2,764 | 5,087 |
| Median Property Value | $164,200 | $180,800 |
| Median Household Income | $69,385 | $790 |
| Monthly Housing Costs | $559 | $61 |
| Real Estate Taxes | $1,899 | $82 |
Property Value by Mortgage Status in Jacksonville
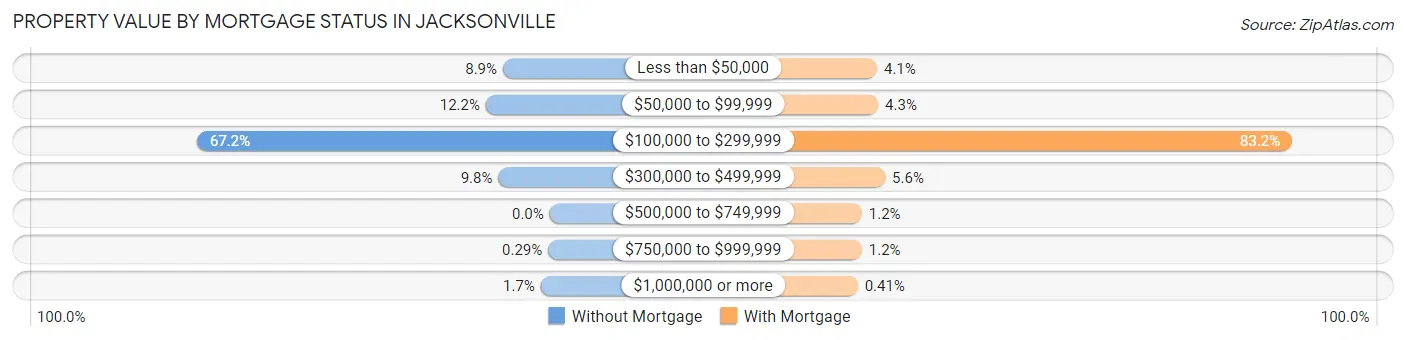
| Property Value | Without Mortgage | With Mortgage |
| Less than $50,000 | 246 (8.9%) | 208 (4.1%) |
| $50,000 to $99,999 | 336 (12.2%) | 219 (4.3%) |
| $100,000 to $299,999 | 1,857 (67.2%) | 4,230 (83.2%) |
| $300,000 to $499,999 | 270 (9.8%) | 287 (5.6%) |
| $500,000 to $749,999 | 0 (0.0%) | 61 (1.2%) |
| $750,000 to $999,999 | 8 (0.3%) | 61 (1.2%) |
| $1,000,000 or more | 47 (1.7%) | 21 (0.4%) |
| Total | 2,764 (100.0%) | 5,087 (100.0%) |
Household Income by Mortgage Status in Jacksonville
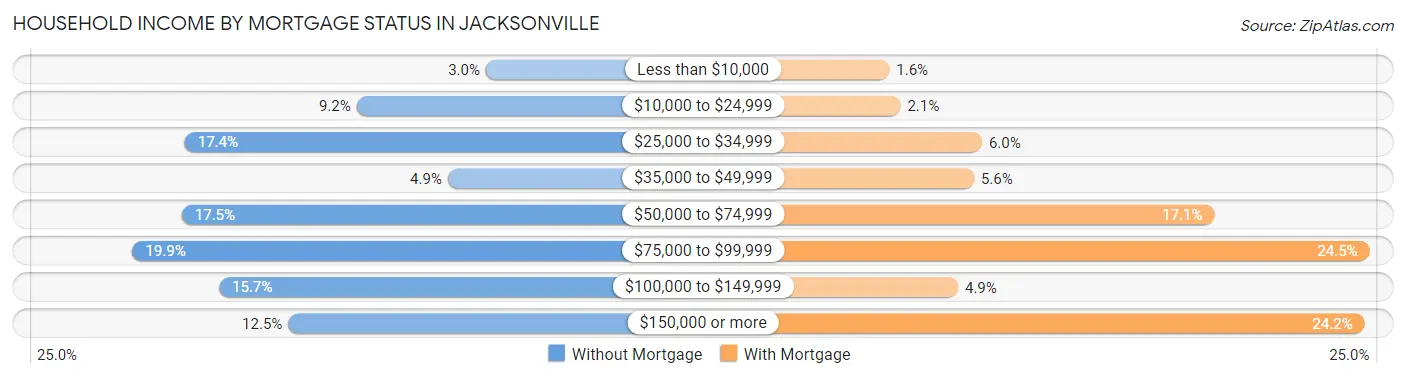
| Household Income | Without Mortgage | With Mortgage |
| Less than $10,000 | 84 (3.0%) | 82 (1.6%) |
| $10,000 to $24,999 | 254 (9.2%) | 109 (2.1%) |
| $25,000 to $34,999 | 480 (17.4%) | 306 (6.0%) |
| $35,000 to $49,999 | 134 (4.9%) | 287 (5.6%) |
| $50,000 to $74,999 | 484 (17.5%) | 869 (17.1%) |
| $75,000 to $99,999 | 549 (19.9%) | 1,245 (24.5%) |
| $100,000 to $149,999 | 435 (15.7%) | 248 (4.9%) |
| $150,000 or more | 344 (12.4%) | 1,233 (24.2%) |
| Total | 2,764 (100.0%) | 5,087 (100.0%) |
Property Value to Household Income Ratio in Jacksonville
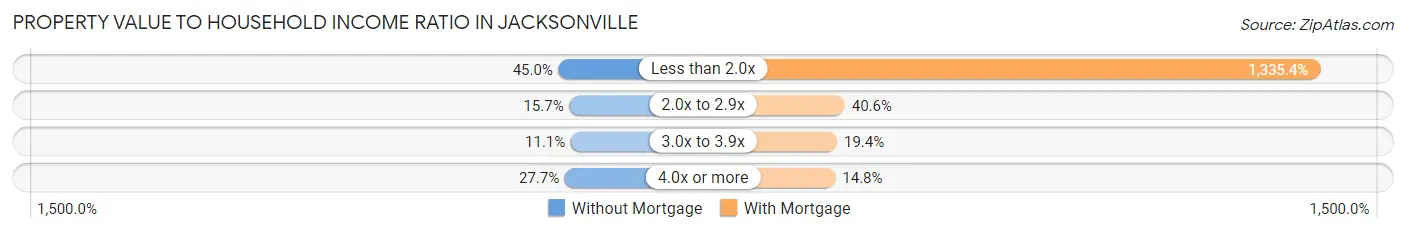
| Value-to-Income Ratio | Without Mortgage | With Mortgage |
| Less than 2.0x | 1,244 (45.0%) | 67,934 (1,335.4%) |
| 2.0x to 2.9x | 433 (15.7%) | 2,066 (40.6%) |
| 3.0x to 3.9x | 308 (11.1%) | 987 (19.4%) |
| 4.0x or more | 766 (27.7%) | 754 (14.8%) |
| Total | 2,764 (100.0%) | 5,087 (100.0%) |
Real Estate Taxes by Mortgage Status in Jacksonville
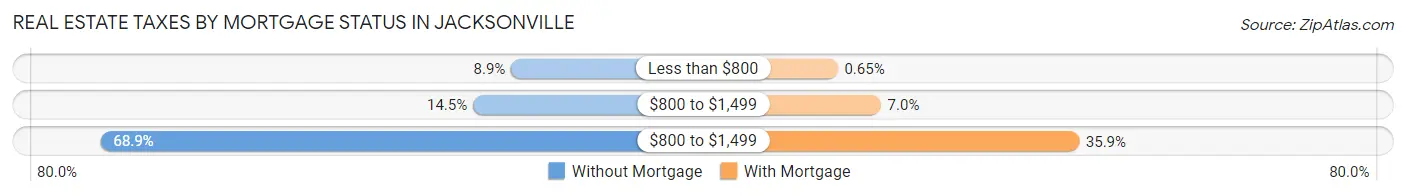
| Property Taxes | Without Mortgage | With Mortgage |
| Less than $800 | 246 (8.9%) | 33 (0.6%) |
| $800 to $1,499 | 400 (14.5%) | 354 (7.0%) |
| $800 to $1,499 | 1,905 (68.9%) | 1,827 (35.9%) |
| Total | 2,764 (100.0%) | 5,087 (100.0%) |
Health & Disability in Jacksonville
Health Insurance Coverage by Age in Jacksonville
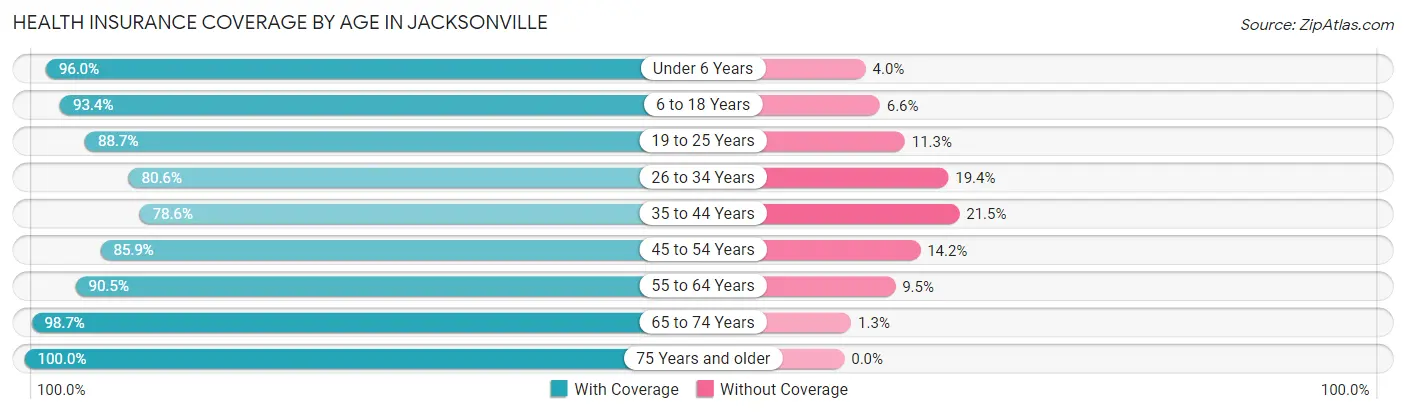
| Age Bracket | With Coverage | Without Coverage |
| Under 6 Years | 5,581 (96.0%) | 231 (4.0%) |
| 6 to 18 Years | 7,716 (93.4%) | 547 (6.6%) |
| 19 to 25 Years | 6,581 (88.7%) | 837 (11.3%) |
| 26 to 34 Years | 5,452 (80.6%) | 1,312 (19.4%) |
| 35 to 44 Years | 3,406 (78.5%) | 930 (21.4%) |
| 45 to 54 Years | 2,827 (85.9%) | 466 (14.1%) |
| 55 to 64 Years | 3,936 (90.5%) | 413 (9.5%) |
| 65 to 74 Years | 3,246 (98.7%) | 42 (1.3%) |
| 75 Years and older | 1,710 (100.0%) | 0 (0.0%) |
| Total | 40,455 (89.4%) | 4,778 (10.6%) |
Health Insurance Coverage by Citizenship Status in Jacksonville
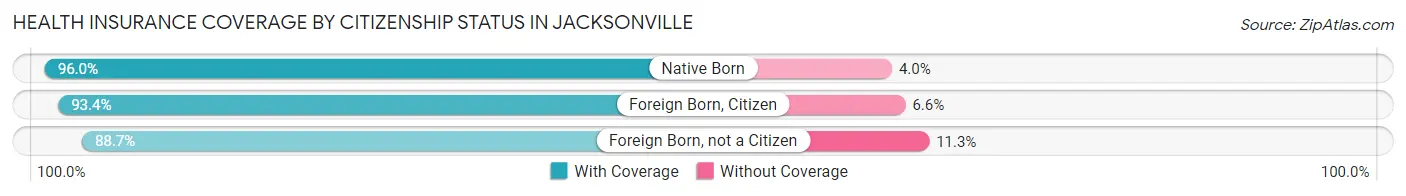
| Citizenship Status | With Coverage | Without Coverage |
| Native Born | 5,581 (96.0%) | 231 (4.0%) |
| Foreign Born, Citizen | 7,716 (93.4%) | 547 (6.6%) |
| Foreign Born, not a Citizen | 6,581 (88.7%) | 837 (11.3%) |
Health Insurance Coverage by Household Income in Jacksonville
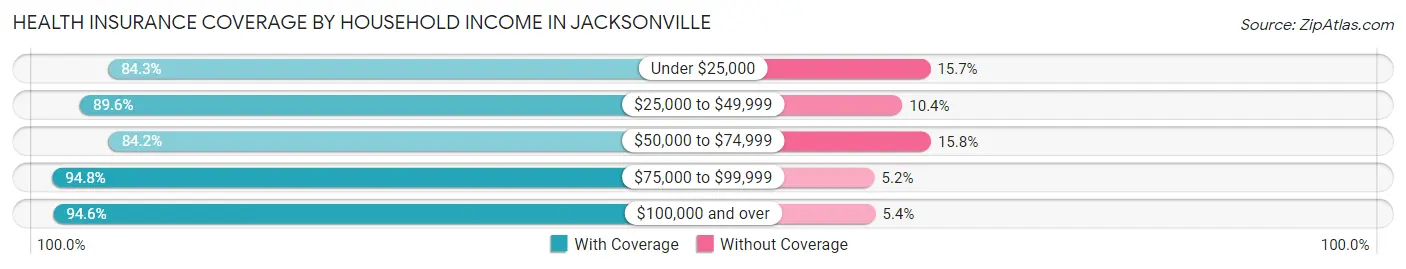
| Household Income | With Coverage | Without Coverage |
| Under $25,000 | 5,752 (84.3%) | 1,069 (15.7%) |
| $25,000 to $49,999 | 11,494 (89.6%) | 1,336 (10.4%) |
| $50,000 to $74,999 | 8,046 (84.2%) | 1,506 (15.8%) |
| $75,000 to $99,999 | 4,608 (94.8%) | 254 (5.2%) |
| $100,000 and over | 10,466 (94.6%) | 596 (5.4%) |
Public vs Private Health Insurance Coverage by Age in Jacksonville
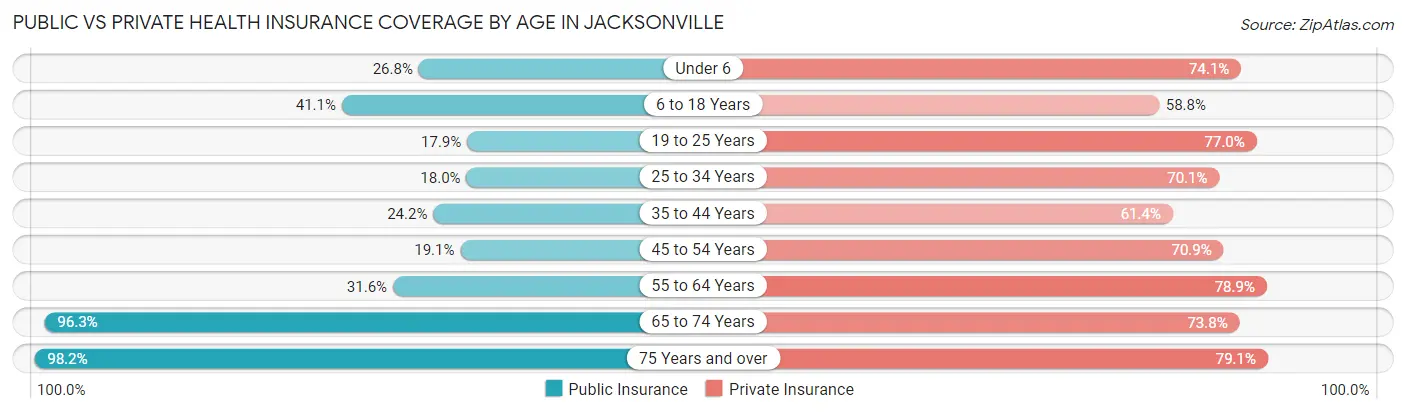
| Age Bracket | Public Insurance | Private Insurance |
| Under 6 | 1,560 (26.8%) | 4,308 (74.1%) |
| 6 to 18 Years | 3,398 (41.1%) | 4,862 (58.8%) |
| 19 to 25 Years | 1,325 (17.9%) | 5,711 (77.0%) |
| 25 to 34 Years | 1,217 (18.0%) | 4,739 (70.1%) |
| 35 to 44 Years | 1,047 (24.1%) | 2,663 (61.4%) |
| 45 to 54 Years | 630 (19.1%) | 2,333 (70.9%) |
| 55 to 64 Years | 1,376 (31.6%) | 3,430 (78.9%) |
| 65 to 74 Years | 3,167 (96.3%) | 2,427 (73.8%) |
| 75 Years and over | 1,679 (98.2%) | 1,352 (79.1%) |
| Total | 15,399 (34.0%) | 31,825 (70.4%) |
Disability Status by Sex by Age in Jacksonville
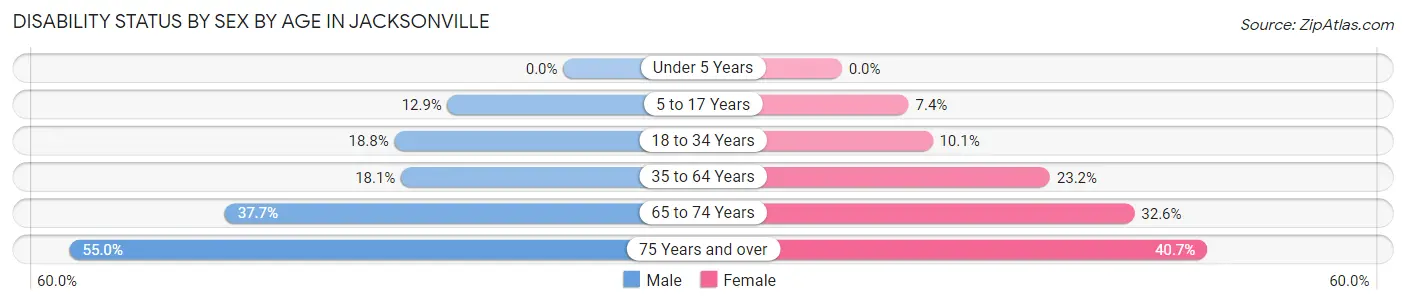
| Age Bracket | Male | Female |
| Under 5 Years | 0 (0.0%) | 0 (0.0%) |
| 5 to 17 Years | 552 (12.9%) | 315 (7.4%) |
| 18 to 34 Years | 941 (18.8%) | 963 (10.1%) |
| 35 to 64 Years | 924 (18.1%) | 1,590 (23.2%) |
| 65 to 74 Years | 535 (37.7%) | 609 (32.6%) |
| 75 Years and over | 370 (55.0%) | 422 (40.7%) |
Disability Class by Sex by Age in Jacksonville
Disability Class: Hearing Difficulty
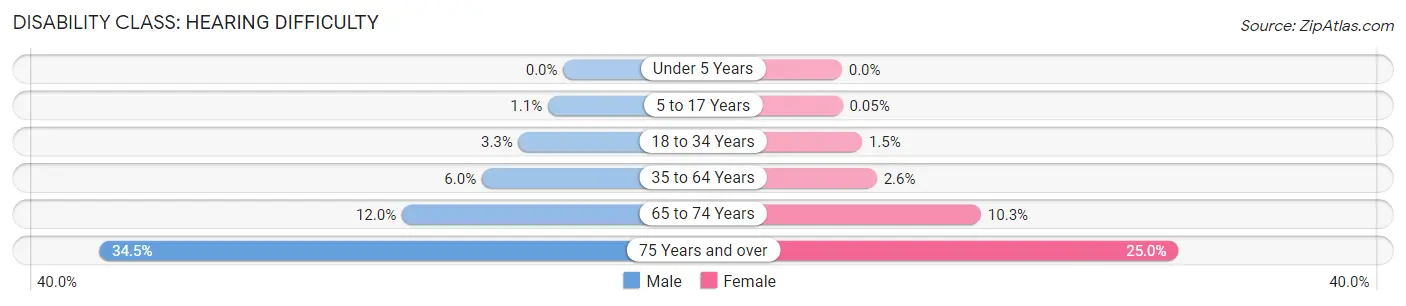
| Age Bracket | Male | Female |
| Under 5 Years | 0 (0.0%) | 0 (0.0%) |
| 5 to 17 Years | 49 (1.1%) | 2 (0.1%) |
| 18 to 34 Years | 166 (3.3%) | 143 (1.5%) |
| 35 to 64 Years | 309 (6.0%) | 178 (2.6%) |
| 65 to 74 Years | 170 (12.0%) | 193 (10.3%) |
| 75 Years and over | 232 (34.5%) | 259 (25.0%) |
Disability Class: Vision Difficulty
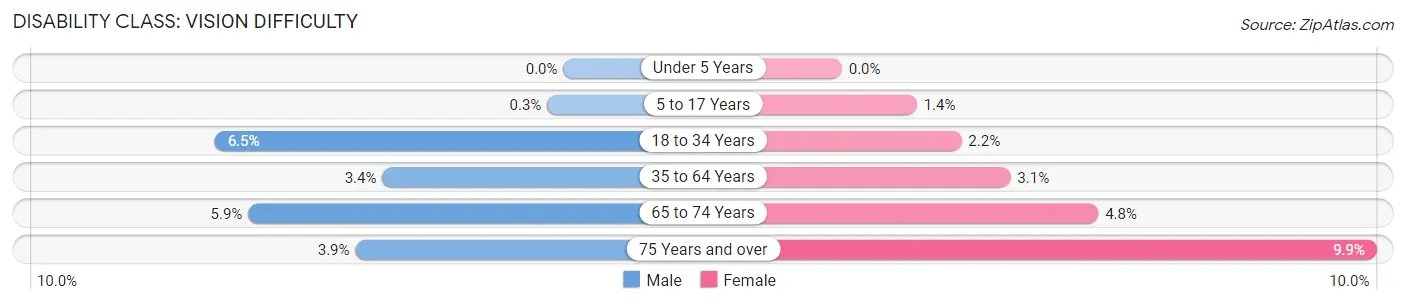
| Age Bracket | Male | Female |
| Under 5 Years | 0 (0.0%) | 0 (0.0%) |
| 5 to 17 Years | 13 (0.3%) | 59 (1.4%) |
| 18 to 34 Years | 324 (6.5%) | 212 (2.2%) |
| 35 to 64 Years | 172 (3.4%) | 215 (3.1%) |
| 65 to 74 Years | 83 (5.9%) | 89 (4.8%) |
| 75 Years and over | 26 (3.9%) | 103 (9.9%) |
Disability Class: Cognitive Difficulty
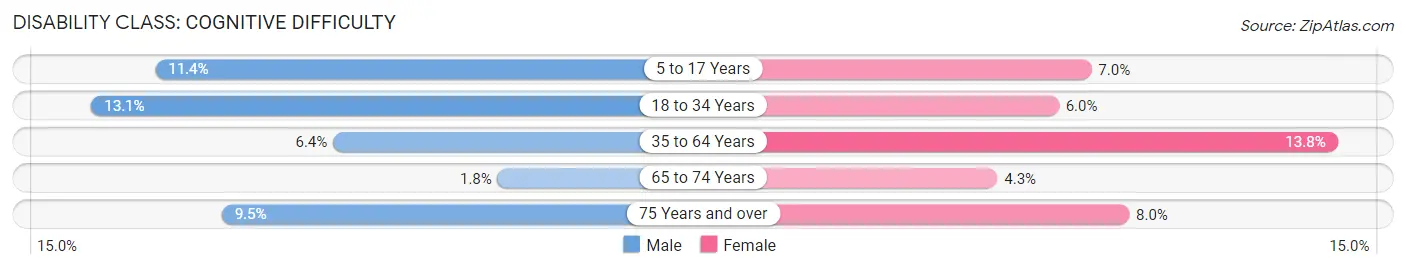
| Age Bracket | Male | Female |
| 5 to 17 Years | 487 (11.4%) | 294 (7.0%) |
| 18 to 34 Years | 658 (13.1%) | 576 (6.0%) |
| 35 to 64 Years | 328 (6.4%) | 947 (13.8%) |
| 65 to 74 Years | 26 (1.8%) | 81 (4.3%) |
| 75 Years and over | 64 (9.5%) | 83 (8.0%) |
Disability Class: Ambulatory Difficulty
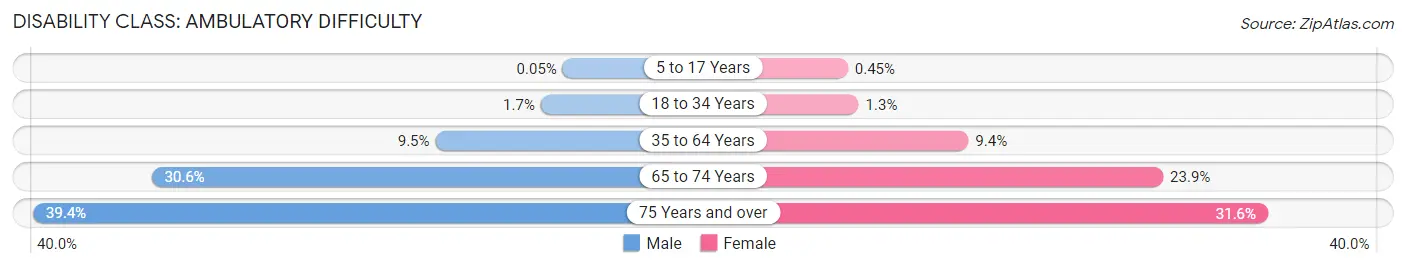
| Age Bracket | Male | Female |
| 5 to 17 Years | 2 (0.1%) | 19 (0.4%) |
| 18 to 34 Years | 84 (1.7%) | 119 (1.3%) |
| 35 to 64 Years | 486 (9.5%) | 645 (9.4%) |
| 65 to 74 Years | 434 (30.6%) | 446 (23.9%) |
| 75 Years and over | 265 (39.4%) | 328 (31.6%) |
Disability Class: Self-Care Difficulty
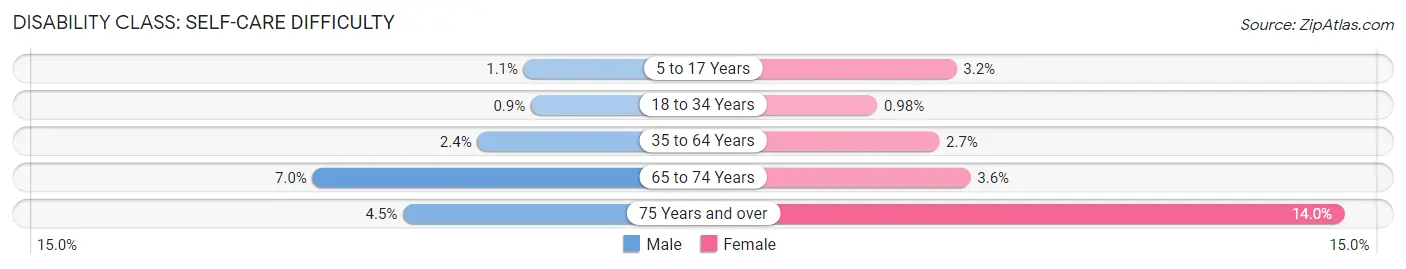
| Age Bracket | Male | Female |
| 5 to 17 Years | 47 (1.1%) | 135 (3.2%) |
| 18 to 34 Years | 45 (0.9%) | 93 (1.0%) |
| 35 to 64 Years | 122 (2.4%) | 186 (2.7%) |
| 65 to 74 Years | 99 (7.0%) | 67 (3.6%) |
| 75 Years and over | 30 (4.5%) | 145 (14.0%) |
Technology Access in Jacksonville
Computing Device Access in Jacksonville
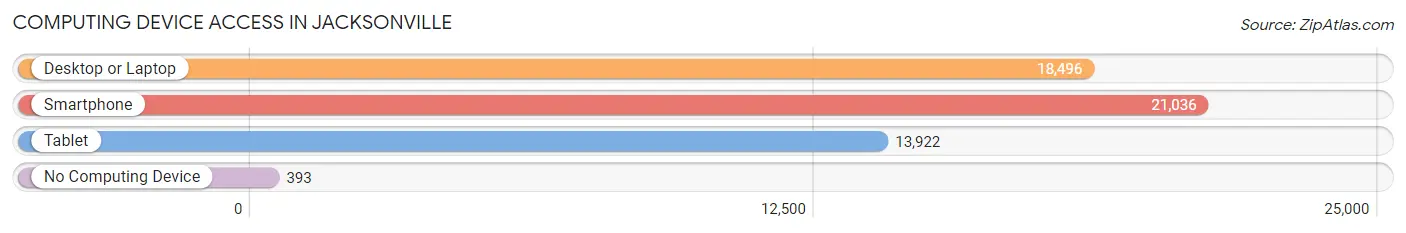
| Device Type | # Households | % Households |
| Desktop or Laptop | 18,496 | 83.7% |
| Smartphone | 21,036 | 95.2% |
| Tablet | 13,922 | 63.0% |
| No Computing Device | 393 | 1.8% |
| Total | 22,089 | 100.0% |
Internet Access in Jacksonville
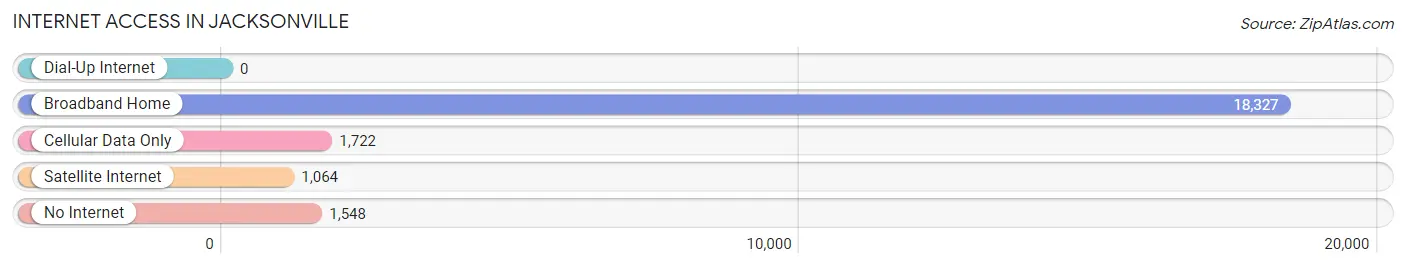
| Internet Type | # Households | % Households |
| Dial-Up Internet | 0 | 0.0% |
| Broadband Home | 18,327 | 83.0% |
| Cellular Data Only | 1,722 | 7.8% |
| Satellite Internet | 1,064 | 4.8% |
| No Internet | 1,548 | 7.0% |
| Total | 22,089 | 100.0% |
Jacksonville Summary
Jacksonville, North Carolina is a city located in Onslow County, North Carolina. It is the county seat of Onslow County and is the largest city in the county. The city is located in the southeastern part of the state, approximately 50 miles from the Atlantic Ocean. Jacksonville is the home of Marine Corps Base Camp Lejeune and Marine Corps Air Station New River.
Geography
Jacksonville is located in the Coastal Plain region of North Carolina. The city is situated on the New River, which is a tributary of the Cape Fear River. The city is located at an elevation of approximately 30 feet above sea level. The city has a total area of 28.2 square miles, of which 28.1 square miles is land and 0.1 square miles is water.
Climate
Jacksonville has a humid subtropical climate, with hot, humid summers and mild winters. The average annual temperature is around 68 degrees Fahrenheit. The average annual precipitation is around 48 inches.
Demographics
As of the 2010 census, the population of Jacksonville was 70,145. The racial makeup of the city was 68.2% White, 22.3% African American, 0.7% Native American, 2.7% Asian, 0.1% Pacific Islander, 3.2% from other races, and 2.8% from two or more races. Hispanic or Latino of any race were 8.2% of the population.
Economy
Jacksonville is the economic center of Onslow County. The city is home to Marine Corps Base Camp Lejeune and Marine Corps Air Station New River, which are major employers in the area. The city is also home to several large employers, including Onslow Memorial Hospital, Onslow County Schools, and Onslow County Government. The city is also home to several retail and service businesses, as well as a number of manufacturing companies.
History
The area that is now Jacksonville was first settled in 1731 by a group of settlers from New England. The settlement was originally known as Onslow Courthouse, and was named after Arthur Onslow, the Speaker of the House of Commons in England. The settlement was officially incorporated as the town of Jacksonville in 1842.
In 1941, the United States Marine Corps established Camp Lejeune in the area. The base has since grown to become one of the largest Marine Corps bases in the world. In 1952, the Marine Corps Air Station New River was established in the area.
Jacksonville has grown steadily since its incorporation, and is now the largest city in Onslow County. The city is home to a number of attractions, including the Onslow County Museum, the Onslow County Public Library, and the Onslow County Parks and Recreation Department. The city is also home to a number of annual events, including the Onslow County Fair and the Onslow County Bluegrass Festival.
Common Questions
What is Per Capita Income in Jacksonville?
Per Capita income in Jacksonville is $26,808.
What is the Median Family Income in Jacksonville?
Median Family Income in Jacksonville is $54,922.
What is the Median Household income in Jacksonville?
Median Household Income in Jacksonville is $50,185.
What is Income or Wage Gap in Jacksonville?
Income or Wage Gap in Jacksonville is 14.6%.
Women in Jacksonville earn 85.4 cents for every dollar earned by a man.
What is Family Income Deficit in Jacksonville?
Family Income Deficit in Jacksonville is $10,433.
Families that are below poverty line in Jacksonville earn $10,433 less on average than the poverty threshold level.
What is Inequality or Gini Index in Jacksonville?
Inequality or Gini Index in Jacksonville is 0.41.
What is the Total Population of Jacksonville?
Total Population of Jacksonville is 71,908.
What is the Total Male Population of Jacksonville?
Total Male Population of Jacksonville is 44,265.
What is the Total Female Population of Jacksonville?
Total Female Population of Jacksonville is 27,643.
What is the Ratio of Males per 100 Females in Jacksonville?
There are 160.13 Males per 100 Females in Jacksonville.
What is the Ratio of Females per 100 Males in Jacksonville?
There are 62.45 Females per 100 Males in Jacksonville.
What is the Median Population Age in Jacksonville?
Median Population Age in Jacksonville is 23.3 Years.
What is the Average Family Size in Jacksonville
Average Family Size in Jacksonville is 2.9 People.
What is the Average Household Size in Jacksonville
Average Household Size in Jacksonville is 2.4 People.
How Large is the Labor Force in Jacksonville?
There are 45,522 People in the Labor Forcein in Jacksonville.
What is the Percentage of People in the Labor Force in Jacksonville?
76.9% of People are in the Labor Force in Jacksonville.
What is the Unemployment Rate in Jacksonville?
Unemployment Rate in Jacksonville is 8.9%.