Trinity, NC Map & Demographics
Trinity Map
Trinity Overview
$32,062
PER CAPITA INCOME
$94,091
AVG FAMILY INCOME
$70,368
AVG HOUSEHOLD INCOME
28.0%
WAGE / INCOME GAP [ % ]
72.0¢/ $1
WAGE / INCOME GAP [ $ ]
0.39
INEQUALITY / GINI INDEX
7,012
TOTAL POPULATION
3,467
MALE POPULATION
3,545
FEMALE POPULATION
97.80
MALES / 100 FEMALES
102.25
FEMALES / 100 MALES
42.2
MEDIAN AGE
3.1
AVG FAMILY SIZE
2.6
AVG HOUSEHOLD SIZE
3,481
LABOR FORCE [ PEOPLE ]
62.0%
PERCENT IN LABOR FORCE
3.6%
UNEMPLOYMENT RATE
Trinity Zip Codes
Trinity Area Codes
Income in Trinity
Income Overview in Trinity
Per Capita Income in Trinity is $32,062, while median incomes of families and households are $94,091 and $70,368 respectively.
| Characteristic | Number | Measure |
| Per Capita Income | 7,012 | $32,062 |
| Median Family Income | 1,796 | $94,091 |
| Mean Family Income | 1,796 | $96,632 |
| Median Household Income | 2,676 | $70,368 |
| Mean Household Income | 2,676 | $81,146 |
| Income Deficit | 1,796 | $0 |
| Wage / Income Gap (%) | 7,012 | 28.01% |
| Wage / Income Gap ($) | 7,012 | 71.99¢ per $1 |
| Gini / Inequality Index | 7,012 | 0.39 |
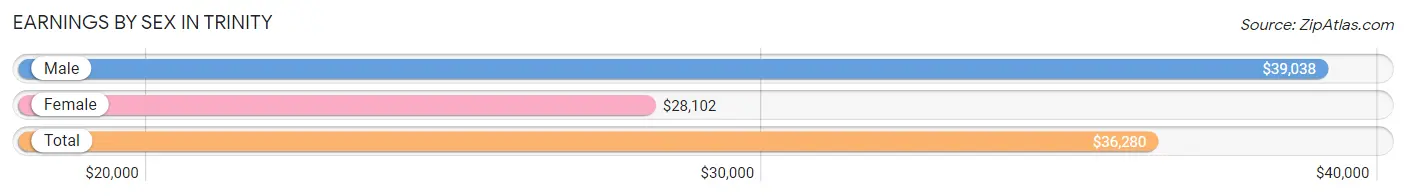
Earnings by Sex in Trinity
Average Earnings in Trinity are $36,280, $39,038 for men and $28,102 for women, a difference of 28.0%.
| Sex | Number | Average Earnings |
| Male | 1,874 (52.3%) | $39,038 |
| Female | 1,706 (47.6%) | $28,102 |
| Total | 3,580 (100.0%) | $36,280 |
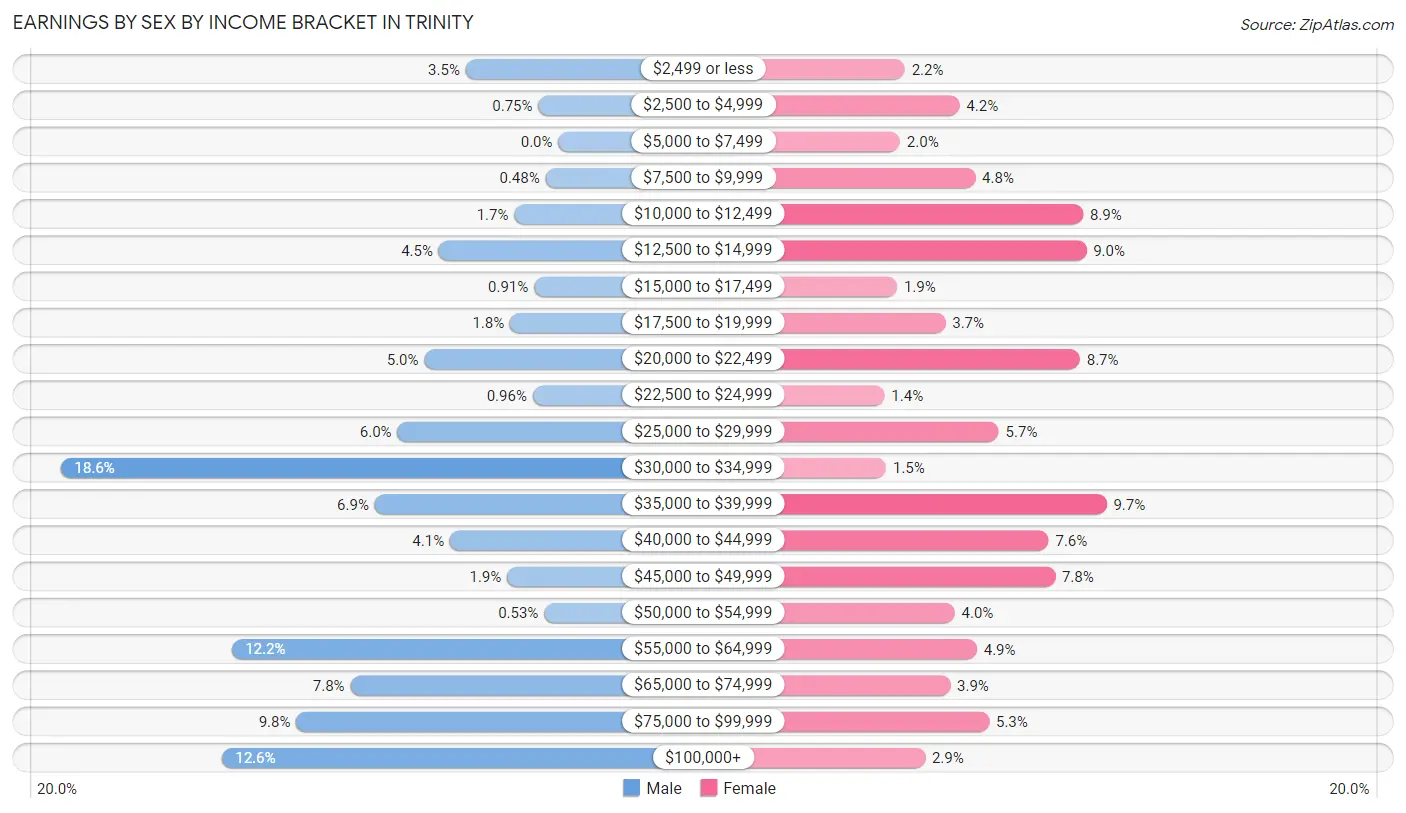
Earnings by Sex by Income Bracket in Trinity
The most common earnings brackets in Trinity are $30,000 to $34,999 for men (349 | 18.6%) and $35,000 to $39,999 for women (166 | 9.7%).
| Income | Male | Female |
| $2,499 or less | 65 (3.5%) | 37 (2.2%) |
| $2,500 to $4,999 | 14 (0.7%) | 72 (4.2%) |
| $5,000 to $7,499 | 0 (0.0%) | 34 (2.0%) |
| $7,500 to $9,999 | 9 (0.5%) | 82 (4.8%) |
| $10,000 to $12,499 | 31 (1.7%) | 151 (8.8%) |
| $12,500 to $14,999 | 84 (4.5%) | 153 (9.0%) |
| $15,000 to $17,499 | 17 (0.9%) | 32 (1.9%) |
| $17,500 to $19,999 | 34 (1.8%) | 63 (3.7%) |
| $20,000 to $22,499 | 94 (5.0%) | 149 (8.7%) |
| $22,500 to $24,999 | 18 (1.0%) | 24 (1.4%) |
| $25,000 to $29,999 | 113 (6.0%) | 97 (5.7%) |
| $30,000 to $34,999 | 349 (18.6%) | 25 (1.5%) |
| $35,000 to $39,999 | 129 (6.9%) | 166 (9.7%) |
| $40,000 to $44,999 | 76 (4.1%) | 129 (7.6%) |
| $45,000 to $49,999 | 36 (1.9%) | 133 (7.8%) |
| $50,000 to $54,999 | 10 (0.5%) | 69 (4.0%) |
| $55,000 to $64,999 | 229 (12.2%) | 83 (4.9%) |
| $65,000 to $74,999 | 146 (7.8%) | 66 (3.9%) |
| $75,000 to $99,999 | 184 (9.8%) | 91 (5.3%) |
| $100,000+ | 236 (12.6%) | 50 (2.9%) |
| Total | 1,874 (100.0%) | 1,706 (100.0%) |
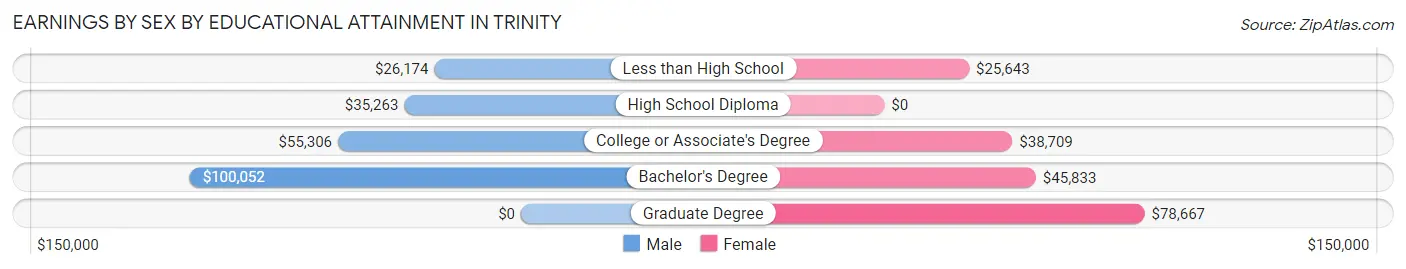
Earnings by Sex by Educational Attainment in Trinity
Average earnings in Trinity are $44,457 for men and $38,601 for women, a difference of 13.2%. Men with an educational attainment of bachelor's degree enjoy the highest average annual earnings of $100,052, while those with less than high school education earn the least with $26,174. Women with an educational attainment of graduate degree earn the most with the average annual earnings of $78,667, while those with less than high school education have the smallest earnings of $25,643.
| Educational Attainment | Male Income | Female Income |
| Less than High School | $26,174 | $25,643 |
| High School Diploma | $35,263 | $0 |
| College or Associate's Degree | $55,306 | $38,709 |
| Bachelor's Degree | $100,052 | $45,833 |
| Graduate Degree | - | - |
| Total | $44,457 | $38,601 |
Family Income in Trinity
Family Income Brackets in Trinity
According to the Trinity family income data, there are 517 families falling into the $100,000 to $149,999 income range, which is the most common income bracket and makes up 28.8% of all families. Conversely, the $15,000 to $24,999 income bracket is the least frequent group with only 9 families (0.5%) belonging to this category.
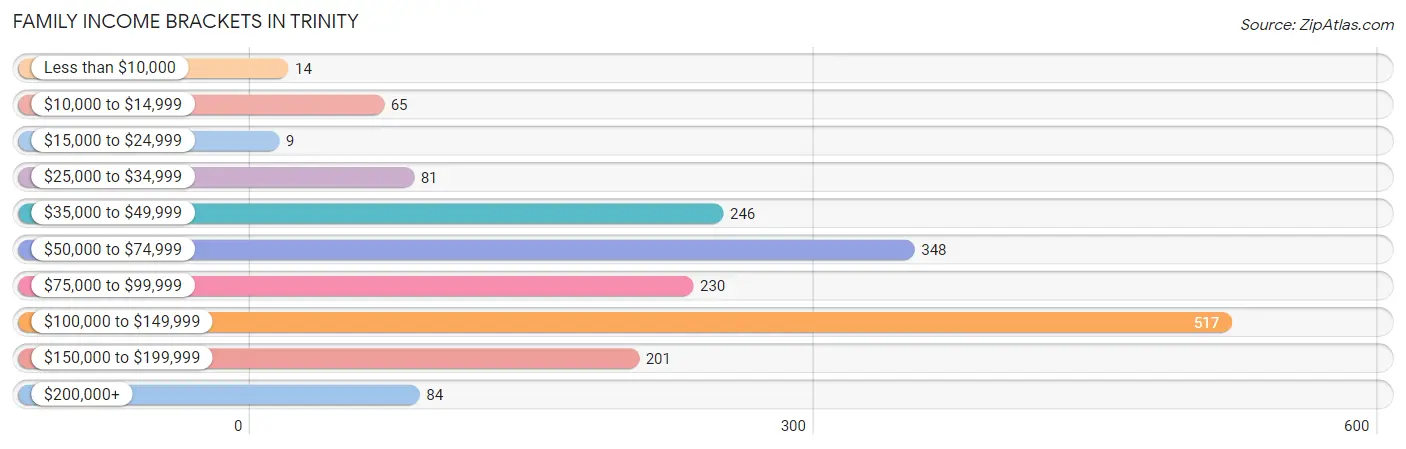
| Income Bracket | # Families | % Families |
| Less than $10,000 | 14 | 0.8% |
| $10,000 to $14,999 | 65 | 3.6% |
| $15,000 to $24,999 | 9 | 0.5% |
| $25,000 to $34,999 | 81 | 4.5% |
| $35,000 to $49,999 | 246 | 13.7% |
| $50,000 to $74,999 | 348 | 19.4% |
| $75,000 to $99,999 | 230 | 12.8% |
| $100,000 to $149,999 | 517 | 28.8% |
| $150,000 to $199,999 | 201 | 11.2% |
| $200,000+ | 84 | 4.7% |
Family Income by Famaliy Size in Trinity
2-person families (1,023 | 57.0%) account for the highest median family income in Trinity with $101,550 per family, while 2-person families (1,023 | 57.0%) have the highest median income of $50,775 per family member.
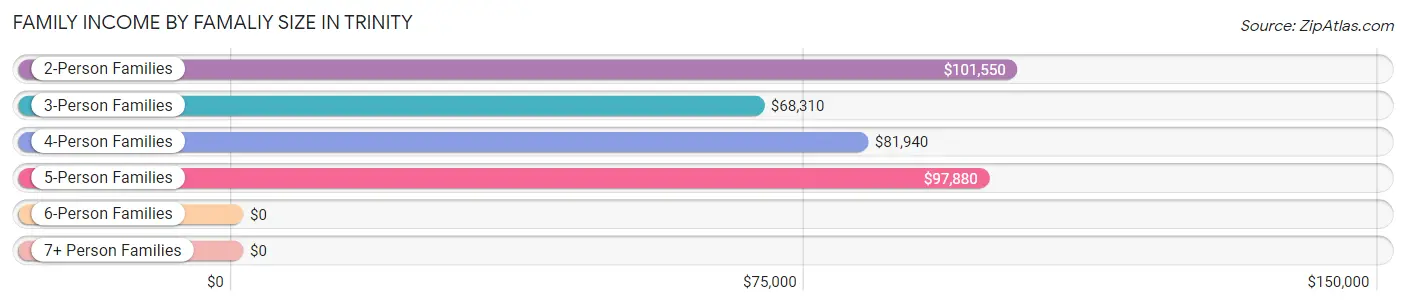
| Income Bracket | # Families | Median Income |
| 2-Person Families | 1,023 (57.0%) | $101,550 |
| 3-Person Families | 332 (18.5%) | $68,310 |
| 4-Person Families | 233 (13.0%) | $81,940 |
| 5-Person Families | 141 (7.9%) | $97,880 |
| 6-Person Families | 42 (2.3%) | $0 |
| 7+ Person Families | 25 (1.4%) | $0 |
| Total | 1,796 (100.0%) | $94,091 |
Family Income by Number of Earners in Trinity
The median family income in Trinity is $94,091, with families comprising 2 earners (787) having the highest median family income of $116,753, while families with 1 earner (494) have the lowest median family income of $47,602, accounting for 43.8% and 27.5% of families, respectively.
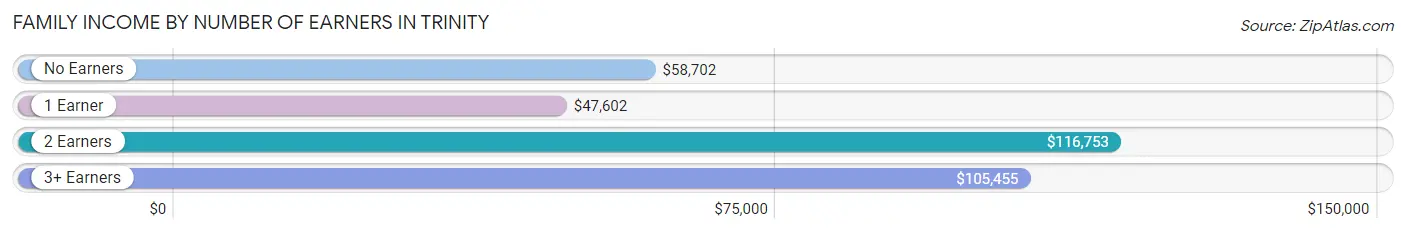
| Number of Earners | # Families | Median Income |
| No Earners | 313 (17.4%) | $58,702 |
| 1 Earner | 494 (27.5%) | $47,602 |
| 2 Earners | 787 (43.8%) | $116,753 |
| 3+ Earners | 202 (11.3%) | $105,455 |
| Total | 1,796 (100.0%) | $94,091 |
Household Income in Trinity
Household Income Brackets in Trinity
With 589 households falling in the category, the $100,000 to $149,999 income range is the most frequent in Trinity, accounting for 22.0% of all households. In contrast, only 67 households (2.5%) fall into the less than $10,000 income bracket, making it the least populous group.
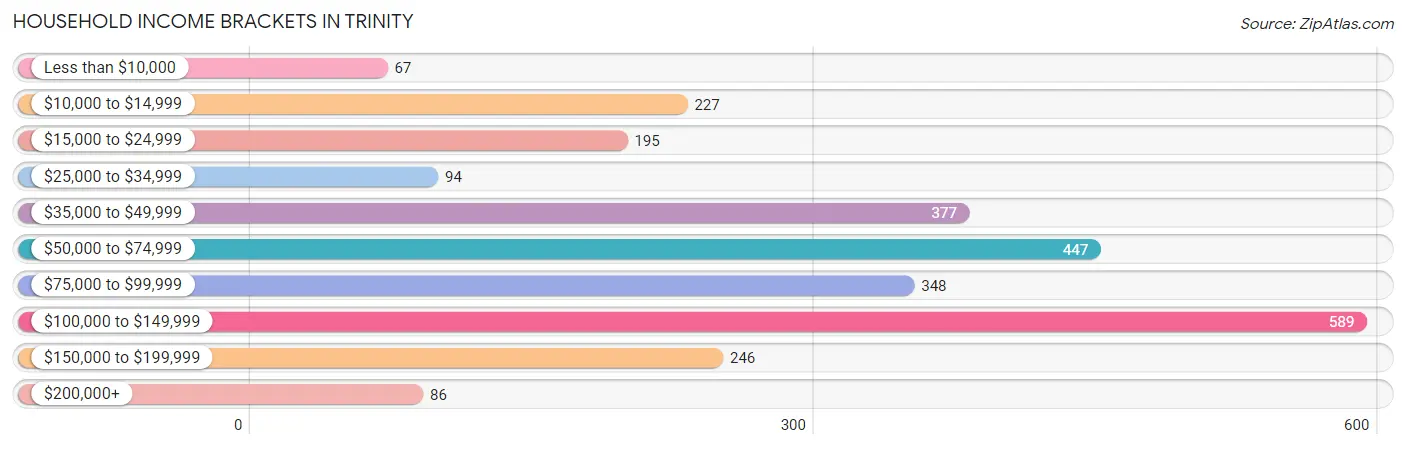
| Income Bracket | # Households | % Households |
| Less than $10,000 | 67 | 2.5% |
| $10,000 to $14,999 | 227 | 8.5% |
| $15,000 to $24,999 | 195 | 7.3% |
| $25,000 to $34,999 | 94 | 3.5% |
| $35,000 to $49,999 | 377 | 14.1% |
| $50,000 to $74,999 | 447 | 16.7% |
| $75,000 to $99,999 | 348 | 13.0% |
| $100,000 to $149,999 | 589 | 22.0% |
| $150,000 to $199,999 | 246 | 9.2% |
| $200,000+ | 86 | 3.2% |
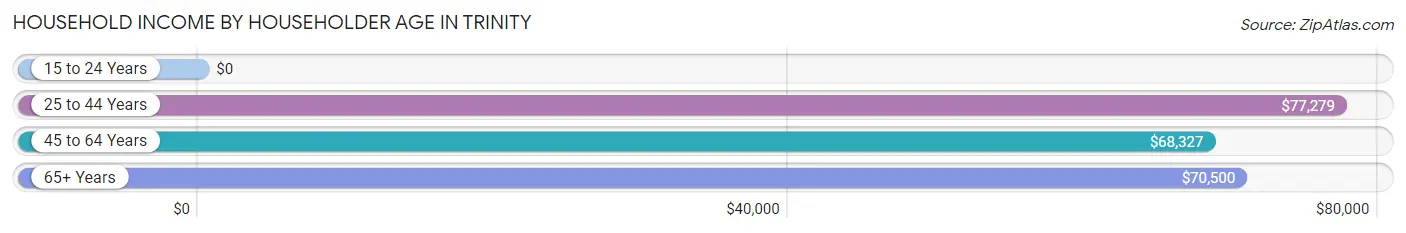
Household Income by Householder Age in Trinity
The median household income in Trinity is $70,368, with the highest median household income of $77,279 found in the 25 to 44 years age bracket for the primary householder. A total of 681 households (25.5%) fall into this category.
| Income Bracket | # Households | Median Income |
| 15 to 24 Years | 0 (0.0%) | $0 |
| 25 to 44 Years | 681 (25.5%) | $77,279 |
| 45 to 64 Years | 935 (34.9%) | $68,327 |
| 65+ Years | 1,060 (39.6%) | $70,500 |
| Total | 2,676 (100.0%) | $70,368 |
Poverty in Trinity
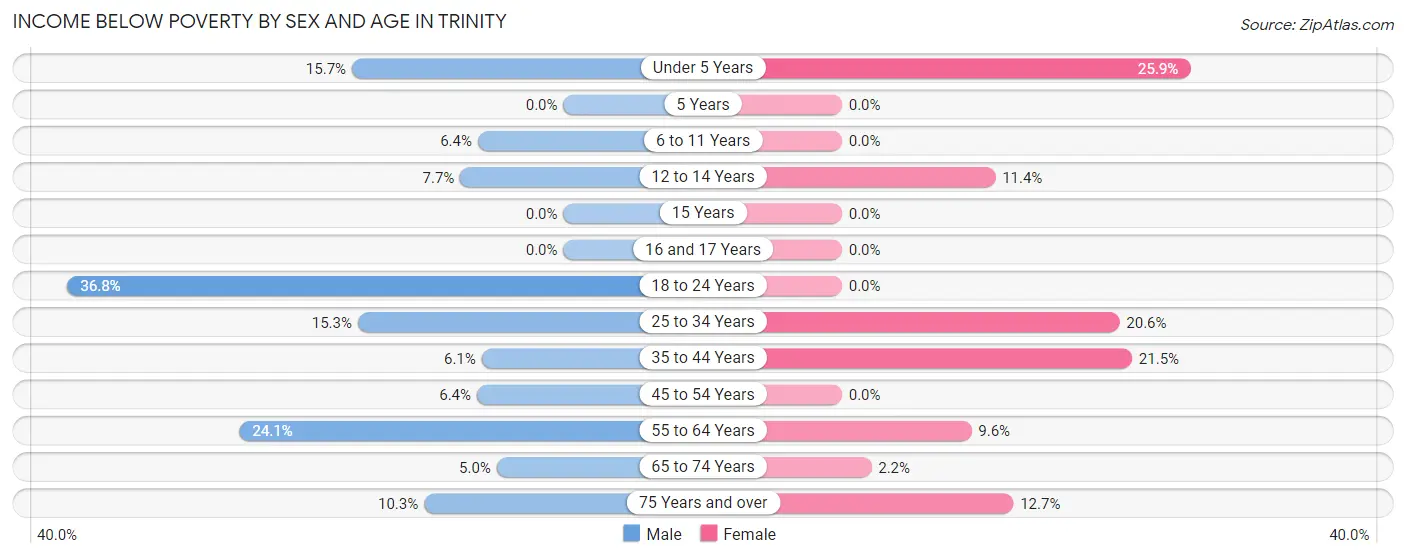
Income Below Poverty by Sex and Age in Trinity
With 12.8% poverty level for males and 8.2% for females among the residents of Trinity, 18 to 24 year old males and under 5 year old females are the most vulnerable to poverty, with 95 males (36.8%) and 45 females (25.9%) in their respective age groups living below the poverty level.
| Age Bracket | Male | Female |
| Under 5 Years | 19 (15.7%) | 45 (25.9%) |
| 5 Years | 0 (0.0%) | 0 (0.0%) |
| 6 to 11 Years | 25 (6.4%) | 0 (0.0%) |
| 12 to 14 Years | 16 (7.7%) | 9 (11.4%) |
| 15 Years | 0 (0.0%) | 0 (0.0%) |
| 16 and 17 Years | 0 (0.0%) | 0 (0.0%) |
| 18 to 24 Years | 95 (36.8%) | 0 (0.0%) |
| 25 to 34 Years | 85 (15.3%) | 88 (20.6%) |
| 35 to 44 Years | 19 (6.1%) | 56 (21.5%) |
| 45 to 54 Years | 19 (6.4%) | 0 (0.0%) |
| 55 to 64 Years | 120 (24.0%) | 41 (9.6%) |
| 65 to 74 Years | 27 (5.0%) | 16 (2.2%) |
| 75 Years and over | 18 (10.3%) | 34 (12.7%) |
| Total | 443 (12.8%) | 289 (8.2%) |
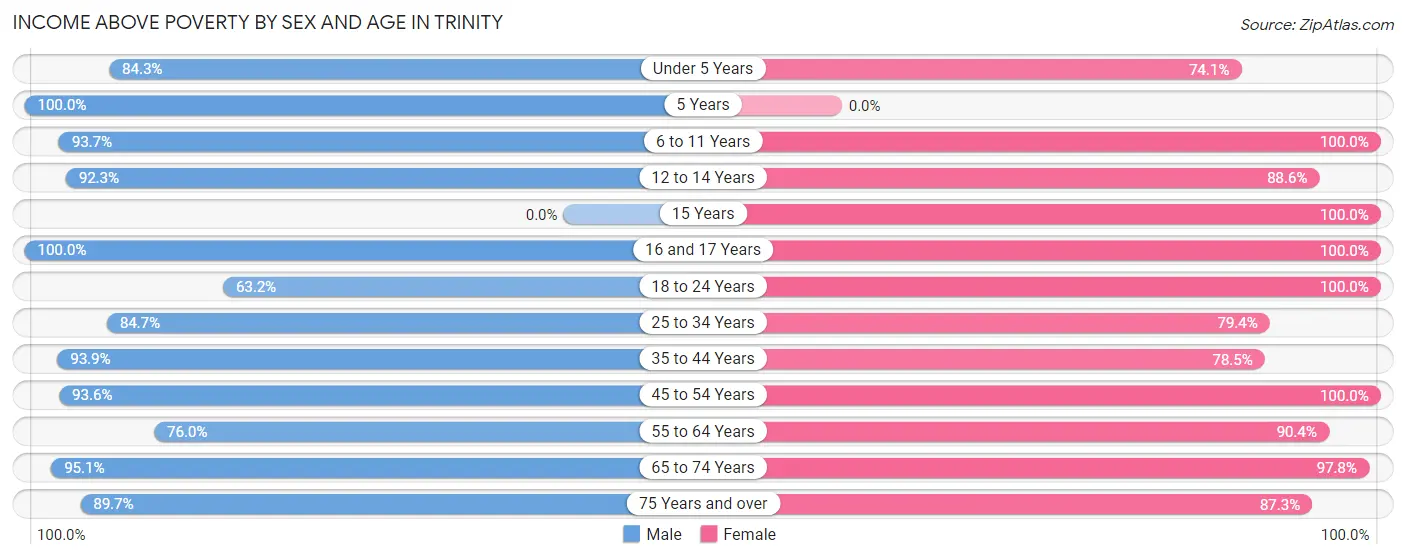
Income Above Poverty by Sex and Age in Trinity
According to the poverty statistics in Trinity, males aged 5 years and females aged 6 to 11 years are the age groups that are most secure financially, with 100.0% of males and 100.0% of females in these age groups living above the poverty line.
| Age Bracket | Male | Female |
| Under 5 Years | 102 (84.3%) | 129 (74.1%) |
| 5 Years | 4 (100.0%) | 0 (0.0%) |
| 6 to 11 Years | 369 (93.6%) | 325 (100.0%) |
| 12 to 14 Years | 193 (92.3%) | 70 (88.6%) |
| 15 Years | 0 (0.0%) | 88 (100.0%) |
| 16 and 17 Years | 96 (100.0%) | 109 (100.0%) |
| 18 to 24 Years | 163 (63.2%) | 259 (100.0%) |
| 25 to 34 Years | 472 (84.7%) | 339 (79.4%) |
| 35 to 44 Years | 294 (93.9%) | 204 (78.5%) |
| 45 to 54 Years | 277 (93.6%) | 396 (100.0%) |
| 55 to 64 Years | 379 (75.9%) | 385 (90.4%) |
| 65 to 74 Years | 519 (95.1%) | 715 (97.8%) |
| 75 Years and over | 156 (89.7%) | 233 (87.3%) |
| Total | 3,024 (87.2%) | 3,252 (91.8%) |
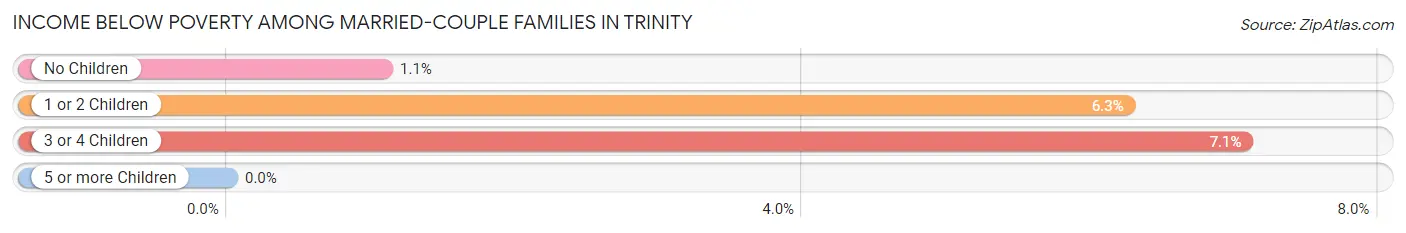
Income Below Poverty Among Married-Couple Families in Trinity
The poverty statistics for married-couple families in Trinity show that 2.7% or 35 of the total 1,315 families live below the poverty line. Families with 3 or 4 children have the highest poverty rate of 7.1%, comprising of 7 families. On the other hand, families with no children have the lowest poverty rate of 1.1%, which includes 10 families.
| Children | Above Poverty | Below Poverty |
| No Children | 918 (98.9%) | 10 (1.1%) |
| 1 or 2 Children | 270 (93.8%) | 18 (6.2%) |
| 3 or 4 Children | 92 (92.9%) | 7 (7.1%) |
| 5 or more Children | 0 (0.0%) | 0 (0.0%) |
| Total | 1,280 (97.3%) | 35 (2.7%) |
Income Below Poverty Among Single-Parent Households in Trinity
According to the poverty data in Trinity, 4.7% or 11 single-father households and 18.3% or 45 single-mother households are living below the poverty line. Among single-father households, those with no children have the highest poverty rate, with 11 households (21.1%) experiencing poverty. Likewise, among single-mother households, those with no children have the highest poverty rate, with 31 households (39.2%) falling below the poverty line.
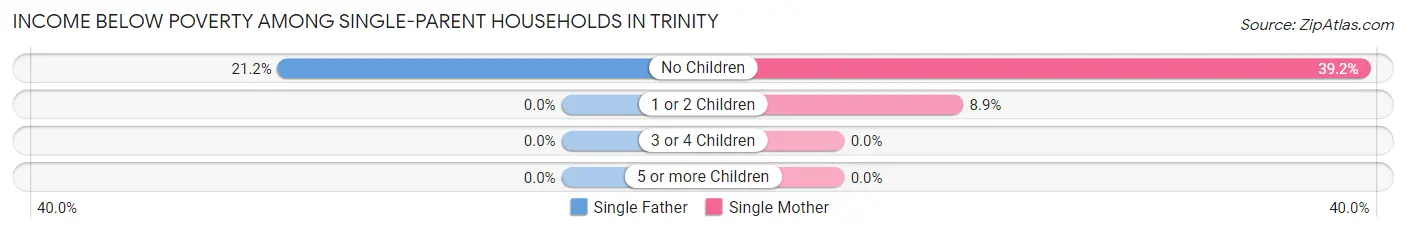
| Children | Single Father | Single Mother |
| No Children | 11 (21.1%) | 31 (39.2%) |
| 1 or 2 Children | 0 (0.0%) | 14 (8.9%) |
| 3 or 4 Children | 0 (0.0%) | 0 (0.0%) |
| 5 or more Children | 0 (0.0%) | 0 (0.0%) |
| Total | 11 (4.7%) | 45 (18.3%) |
Income Below Poverty Among Married-Couple vs Single-Parent Households in Trinity
The poverty data for Trinity shows that 35 of the married-couple family households (2.7%) and 56 of the single-parent households (11.6%) are living below the poverty level. Within the married-couple family households, those with 3 or 4 children have the highest poverty rate, with 7 households (7.1%) falling below the poverty line. Among the single-parent households, those with no children have the highest poverty rate, with 42 household (32.1%) living below poverty.
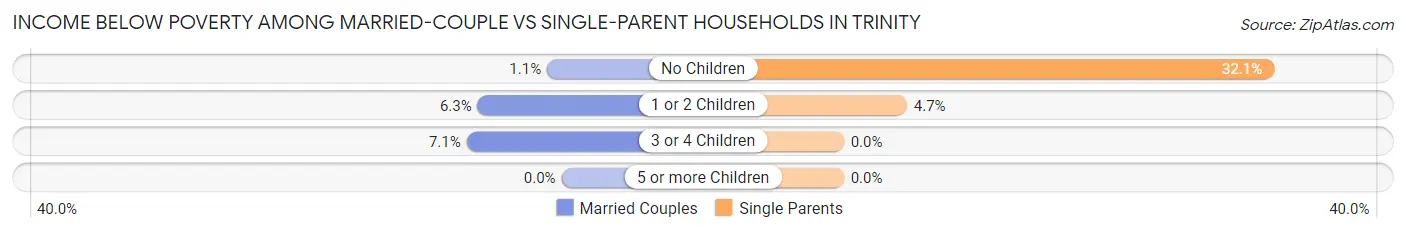
| Children | Married-Couple Families | Single-Parent Households |
| No Children | 10 (1.1%) | 42 (32.1%) |
| 1 or 2 Children | 18 (6.2%) | 14 (4.7%) |
| 3 or 4 Children | 7 (7.1%) | 0 (0.0%) |
| 5 or more Children | 0 (0.0%) | 0 (0.0%) |
| Total | 35 (2.7%) | 56 (11.6%) |
Race in Trinity
The most populous races in Trinity are White / Caucasian (6,011 | 85.7%), Hispanic or Latino (422 | 6.0%), and Some other Race (300 | 4.3%).
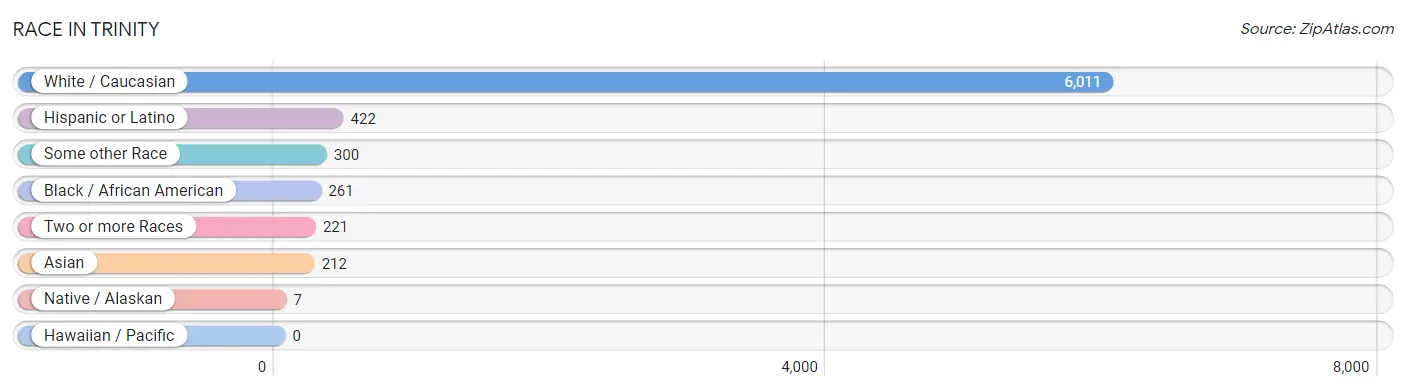
| Race | # Population | % Population |
| Asian | 212 | 3.0% |
| Black / African American | 261 | 3.7% |
| Hawaiian / Pacific | 0 | 0.0% |
| Hispanic or Latino | 422 | 6.0% |
| Native / Alaskan | 7 | 0.1% |
| White / Caucasian | 6,011 | 85.7% |
| Two or more Races | 221 | 3.2% |
| Some other Race | 300 | 4.3% |
| Total | 7,012 | 100.0% |
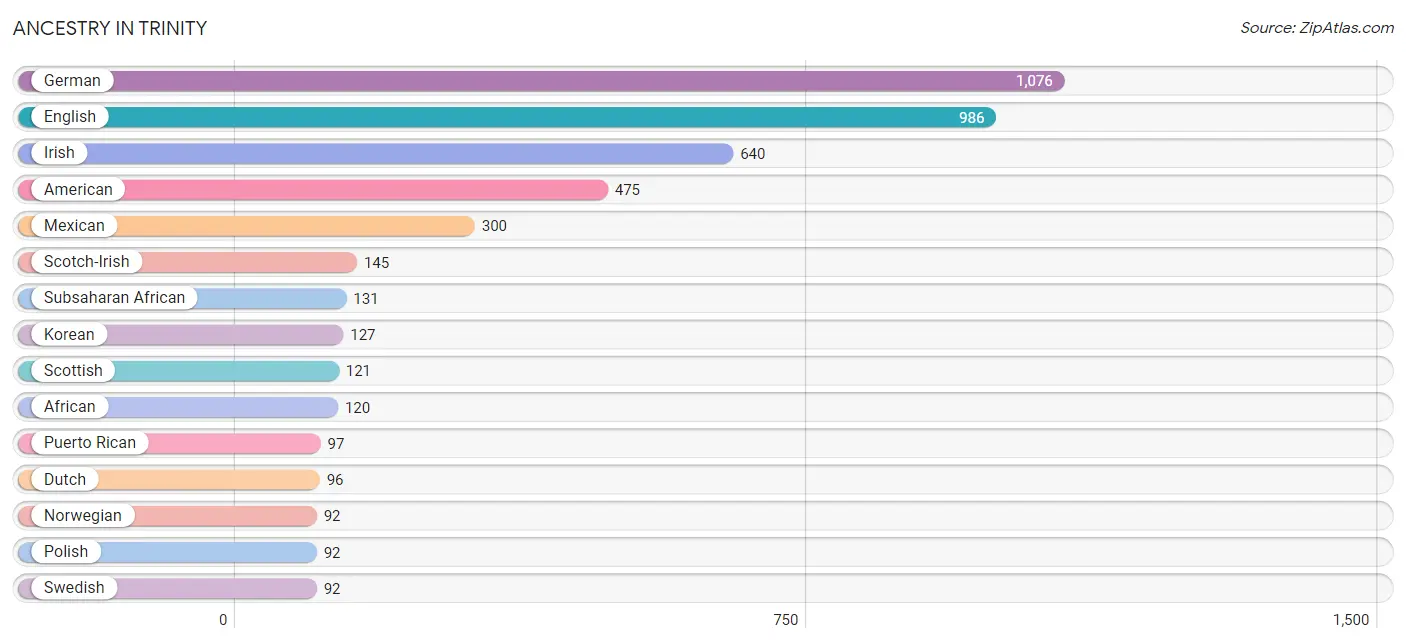
Ancestry in Trinity
The most populous ancestries reported in Trinity are German (1,076 | 15.3%), English (986 | 14.1%), Irish (640 | 9.1%), American (475 | 6.8%), and Mexican (300 | 4.3%), together accounting for 49.6% of all Trinity residents.
| Ancestry | # Population | % Population |
| African | 120 | 1.7% |
| American | 475 | 6.8% |
| British | 41 | 0.6% |
| Burmese | 19 | 0.3% |
| Central American | 2 | 0.0% |
| Central American Indian | 2 | 0.0% |
| Colombian | 14 | 0.2% |
| Cuban | 9 | 0.1% |
| Danish | 5 | 0.1% |
| Dutch | 96 | 1.4% |
| Eastern European | 35 | 0.5% |
| English | 986 | 14.1% |
| European | 12 | 0.2% |
| Finnish | 36 | 0.5% |
| French | 46 | 0.7% |
| German | 1,076 | 15.3% |
| Greek | 16 | 0.2% |
| Guatemalan | 2 | 0.0% |
| Hungarian | 11 | 0.2% |
| Indian (Asian) | 75 | 1.1% |
| Irish | 640 | 9.1% |
| Italian | 55 | 0.8% |
| Japanese | 36 | 0.5% |
| Korean | 127 | 1.8% |
| Mexican | 300 | 4.3% |
| Northern European | 5 | 0.1% |
| Norwegian | 92 | 1.3% |
| Polish | 92 | 1.3% |
| Puerto Rican | 97 | 1.4% |
| Russian | 1 | 0.0% |
| Scandinavian | 68 | 1.0% |
| Scotch-Irish | 145 | 2.1% |
| Scottish | 121 | 1.7% |
| South American | 14 | 0.2% |
| Sri Lankan | 18 | 0.3% |
| Subsaharan African | 131 | 1.9% |
| Swedish | 92 | 1.3% |
| Swiss | 7 | 0.1% |
| Ukrainian | 11 | 0.2% |
| Welsh | 27 | 0.4% | View All 40 Rows |
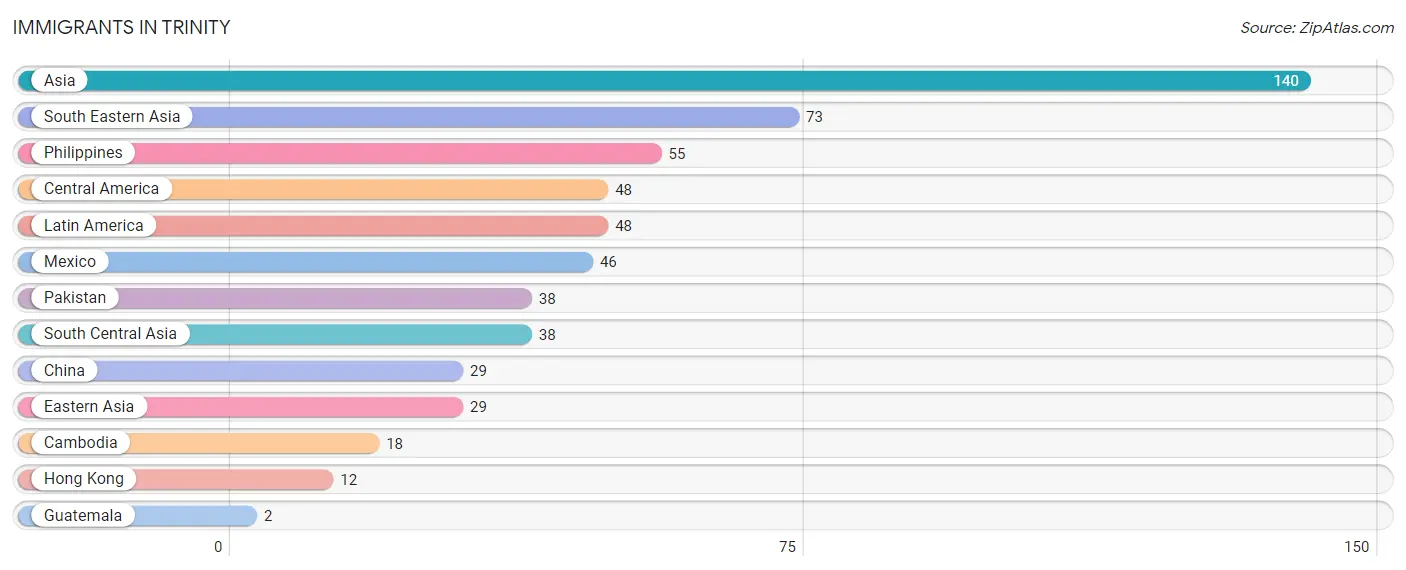
Immigrants in Trinity
The most numerous immigrant groups reported in Trinity came from Asia (140 | 2.0%), South Eastern Asia (73 | 1.0%), Philippines (55 | 0.8%), Central America (48 | 0.7%), and Latin America (48 | 0.7%), together accounting for 5.2% of all Trinity residents.
| Immigration Origin | # Population | % Population |
| Asia | 140 | 2.0% |
| Cambodia | 18 | 0.3% |
| Central America | 48 | 0.7% |
| China | 29 | 0.4% |
| Eastern Asia | 29 | 0.4% |
| Guatemala | 2 | 0.0% |
| Hong Kong | 12 | 0.2% |
| Latin America | 48 | 0.7% |
| Mexico | 46 | 0.7% |
| Pakistan | 38 | 0.5% |
| Philippines | 55 | 0.8% |
| South Central Asia | 38 | 0.5% |
| South Eastern Asia | 73 | 1.0% | View All 13 Rows |
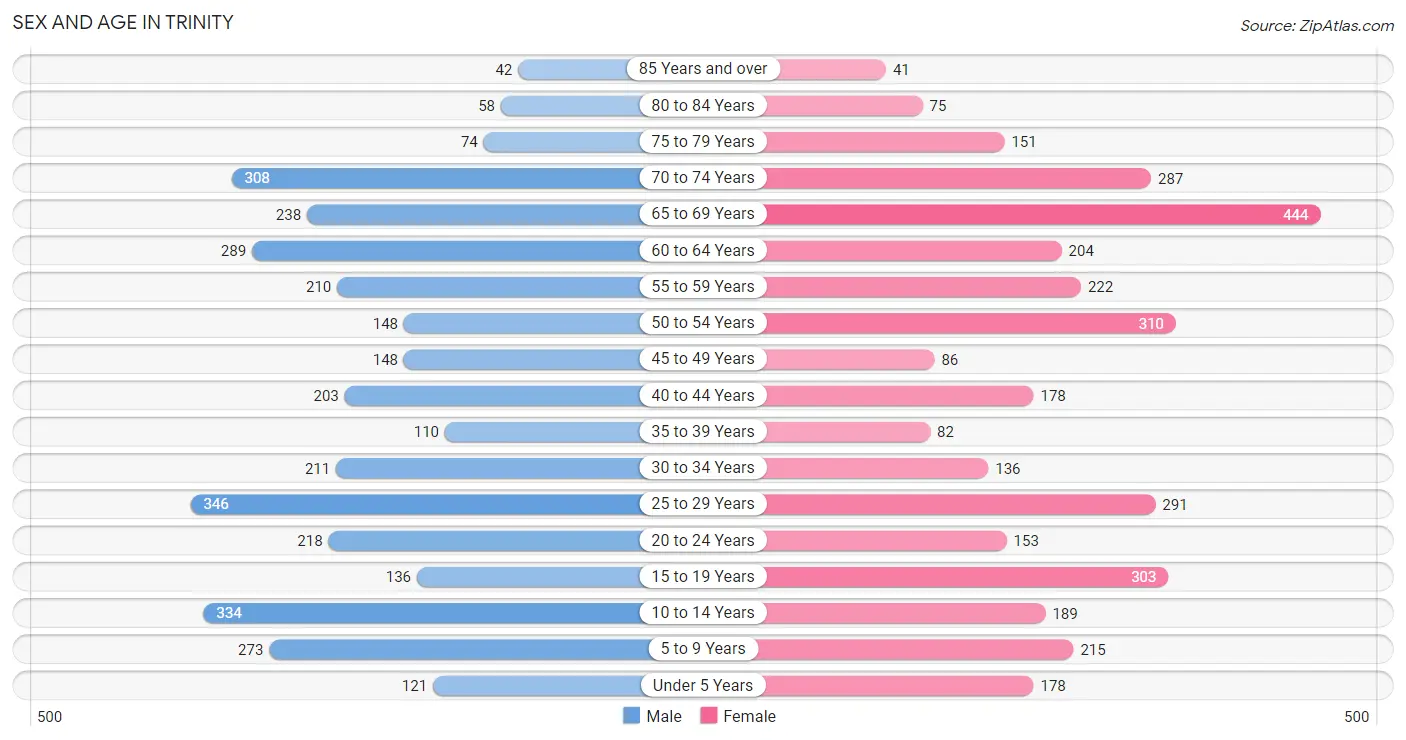
Sex and Age in Trinity
Sex and Age in Trinity
The most populous age groups in Trinity are 25 to 29 Years (346 | 10.0%) for men and 65 to 69 Years (444 | 12.5%) for women.
| Age Bracket | Male | Female |
| Under 5 Years | 121 (3.5%) | 178 (5.0%) |
| 5 to 9 Years | 273 (7.9%) | 215 (6.1%) |
| 10 to 14 Years | 334 (9.6%) | 189 (5.3%) |
| 15 to 19 Years | 136 (3.9%) | 303 (8.6%) |
| 20 to 24 Years | 218 (6.3%) | 153 (4.3%) |
| 25 to 29 Years | 346 (10.0%) | 291 (8.2%) |
| 30 to 34 Years | 211 (6.1%) | 136 (3.8%) |
| 35 to 39 Years | 110 (3.2%) | 82 (2.3%) |
| 40 to 44 Years | 203 (5.9%) | 178 (5.0%) |
| 45 to 49 Years | 148 (4.3%) | 86 (2.4%) |
| 50 to 54 Years | 148 (4.3%) | 310 (8.7%) |
| 55 to 59 Years | 210 (6.1%) | 222 (6.3%) |
| 60 to 64 Years | 289 (8.3%) | 204 (5.8%) |
| 65 to 69 Years | 238 (6.9%) | 444 (12.5%) |
| 70 to 74 Years | 308 (8.9%) | 287 (8.1%) |
| 75 to 79 Years | 74 (2.1%) | 151 (4.3%) |
| 80 to 84 Years | 58 (1.7%) | 75 (2.1%) |
| 85 Years and over | 42 (1.2%) | 41 (1.2%) |
| Total | 3,467 (100.0%) | 3,545 (100.0%) |
Families and Households in Trinity
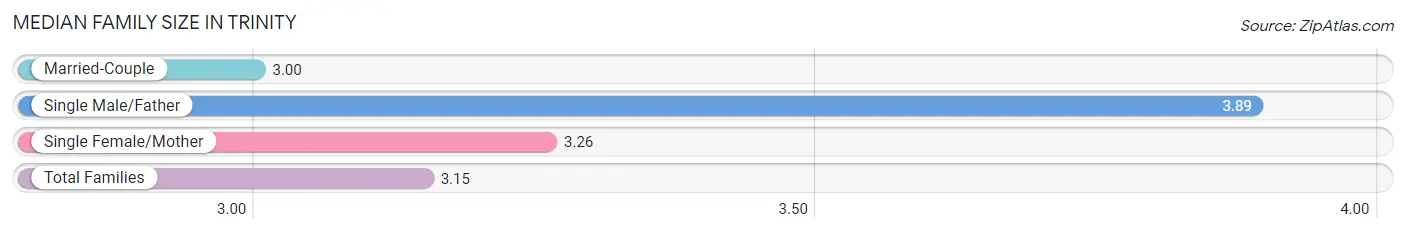
Median Family Size in Trinity
The median family size in Trinity is 3.15 persons per family, with single male/father families (235 | 13.1%) accounting for the largest median family size of 3.89 persons per family. On the other hand, married-couple families (1,315 | 73.2%) represent the smallest median family size with 3.00 persons per family.
| Family Type | # Families | Family Size |
| Married-Couple | 1,315 (73.2%) | 3.00 |
| Single Male/Father | 235 (13.1%) | 3.89 |
| Single Female/Mother | 246 (13.7%) | 3.26 |
| Total Families | 1,796 (100.0%) | 3.15 |
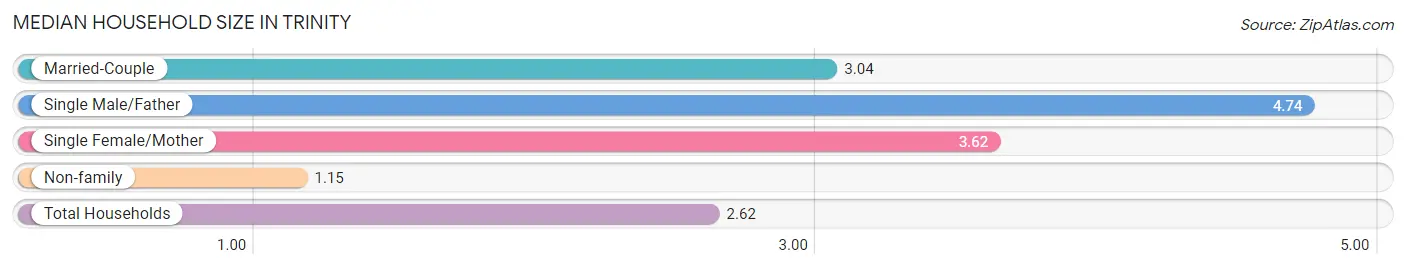
Median Household Size in Trinity
The median household size in Trinity is 2.62 persons per household, with single male/father households (235 | 8.8%) accounting for the largest median household size of 4.74 persons per household. non-family households (880 | 32.9%) represent the smallest median household size with 1.15 persons per household.
| Household Type | # Households | Household Size |
| Married-Couple | 1,315 (49.1%) | 3.04 |
| Single Male/Father | 235 (8.8%) | 4.74 |
| Single Female/Mother | 246 (9.2%) | 3.62 |
| Non-family | 880 (32.9%) | 1.15 |
| Total Households | 2,676 (100.0%) | 2.62 |
Household Size by Marriage Status in Trinity
Out of a total of 2,676 households in Trinity, 1,796 (67.1%) are family households, while 880 (32.9%) are nonfamily households. The most numerous type of family households are 2-person households, comprising 971, and the most common type of nonfamily households are 1-person households, comprising 755.
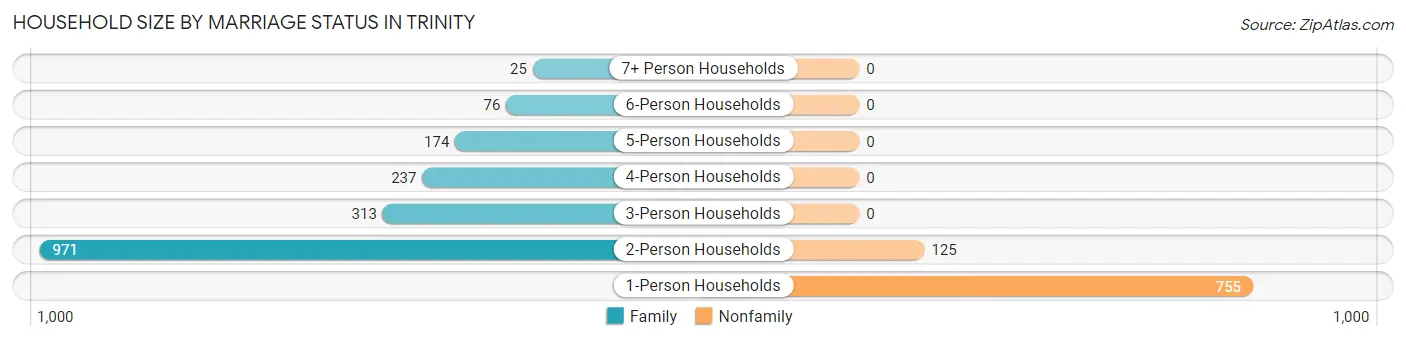
| Household Size | Family Households | Nonfamily Households |
| 1-Person Households | - | 755 (28.2%) |
| 2-Person Households | 971 (36.3%) | 125 (4.7%) |
| 3-Person Households | 313 (11.7%) | 0 (0.0%) |
| 4-Person Households | 237 (8.9%) | 0 (0.0%) |
| 5-Person Households | 174 (6.5%) | 0 (0.0%) |
| 6-Person Households | 76 (2.8%) | 0 (0.0%) |
| 7+ Person Households | 25 (0.9%) | 0 (0.0%) |
| Total | 1,796 (67.1%) | 880 (32.9%) |
Female Fertility in Trinity
Fertility by Age in Trinity
Average fertility rate in Trinity is 94.0 births per 1,000 women. Women in the age bracket of 20 to 34 years have the highest fertility rate with 202.0 births per 1,000 women. Women in the age bracket of 20 to 34 years acount for 94.4% of all women with births.
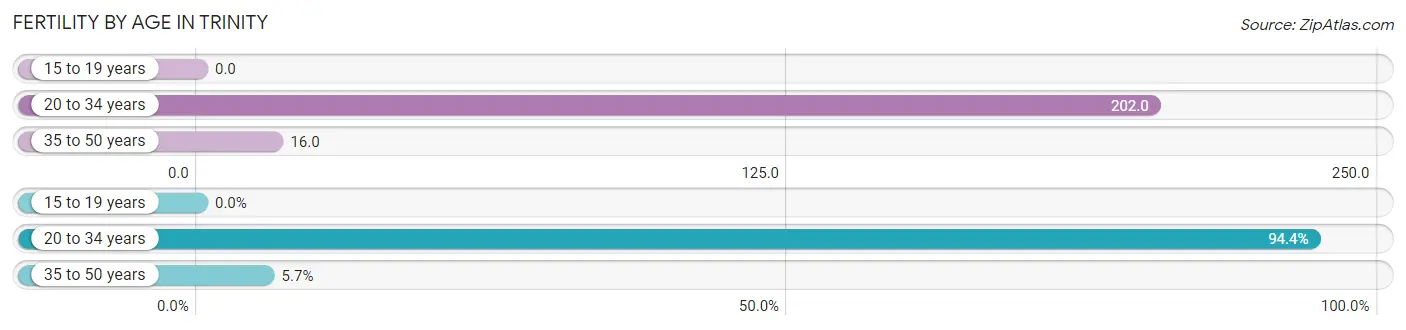
| Age Bracket | Women with Births | Births / 1,000 Women |
| 15 to 19 years | 0 (0.0%) | 0.0 |
| 20 to 34 years | 117 (94.4%) | 202.0 |
| 35 to 50 years | 7 (5.7%) | 16.0 |
| Total | 124 (100.0%) | 94.0 |
Fertility by Age by Marriage Status in Trinity
83.1% of women with births (124) in Trinity are married. The highest percentage of unmarried women with births falls into 20 to 34 years age bracket with 17.9% of them unmarried at the time of birth, while the lowest percentage of unmarried women with births belong to 35 to 50 years age bracket with 0.0% of them unmarried.
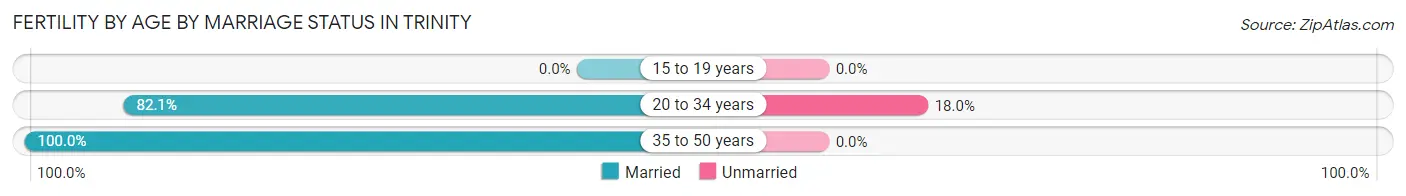
| Age Bracket | Married | Unmarried |
| 15 to 19 years | 0 (0.0%) | 0 (0.0%) |
| 20 to 34 years | 96 (82.1%) | 21 (17.9%) |
| 35 to 50 years | 7 (100.0%) | 0 (0.0%) |
| Total | 103 (83.1%) | 21 (16.9%) |
Fertility by Education in Trinity
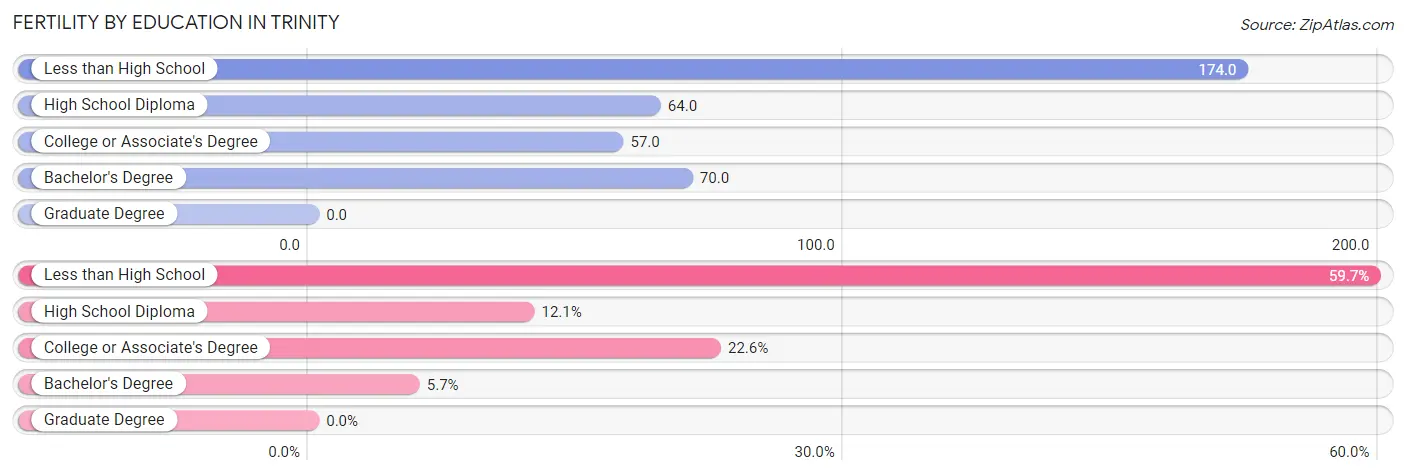
| Educational Attainment | Women with Births | Births / 1,000 Women |
| Less than High School | 74 (59.7%) | 174.0 |
| High School Diploma | 15 (12.1%) | 64.0 |
| College or Associate's Degree | 28 (22.6%) | 57.0 |
| Bachelor's Degree | 7 (5.7%) | 70.0 |
| Graduate Degree | 0 (0.0%) | 0.0 |
| Total | 124 (100.0%) | 94.0 |
Fertility by Education by Marriage Status in Trinity
16.9% of women with births in Trinity are unmarried. Women with the educational attainment of less than high school are most likely to be married with 100.0% of them married at childbirth, while women with the educational attainment of college or associate's degree are least likely to be married with 75.0% of them unmarried at childbirth.
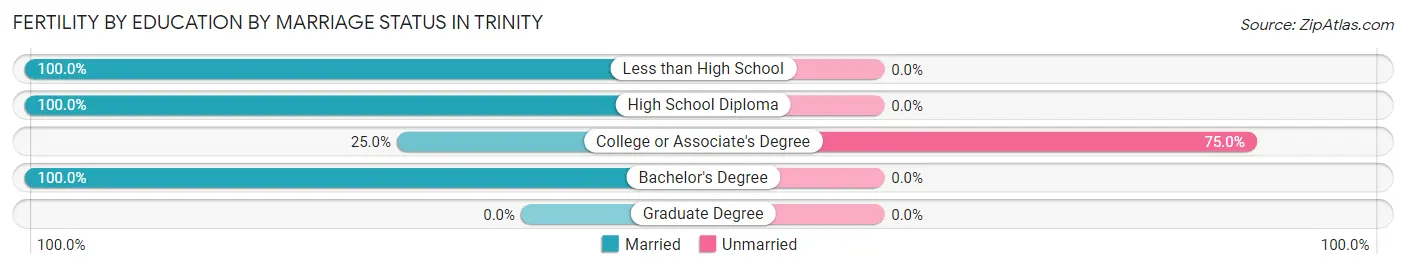
| Educational Attainment | Married | Unmarried |
| Less than High School | 74 (100.0%) | 0 (0.0%) |
| High School Diploma | 15 (100.0%) | 0 (0.0%) |
| College or Associate's Degree | 7 (25.0%) | 21 (75.0%) |
| Bachelor's Degree | 7 (100.0%) | 0 (0.0%) |
| Graduate Degree | 0 (0.0%) | 0 (0.0%) |
| Total | 103 (83.1%) | 21 (16.9%) |
Employment Characteristics in Trinity
Employment by Class of Employer in Trinity
Among the 3,284 employed individuals in Trinity, private company employees (2,651 | 80.7%), not-for-profit organizations (185 | 5.6%), and local government employees (178 | 5.4%) make up the most common classes of employment.
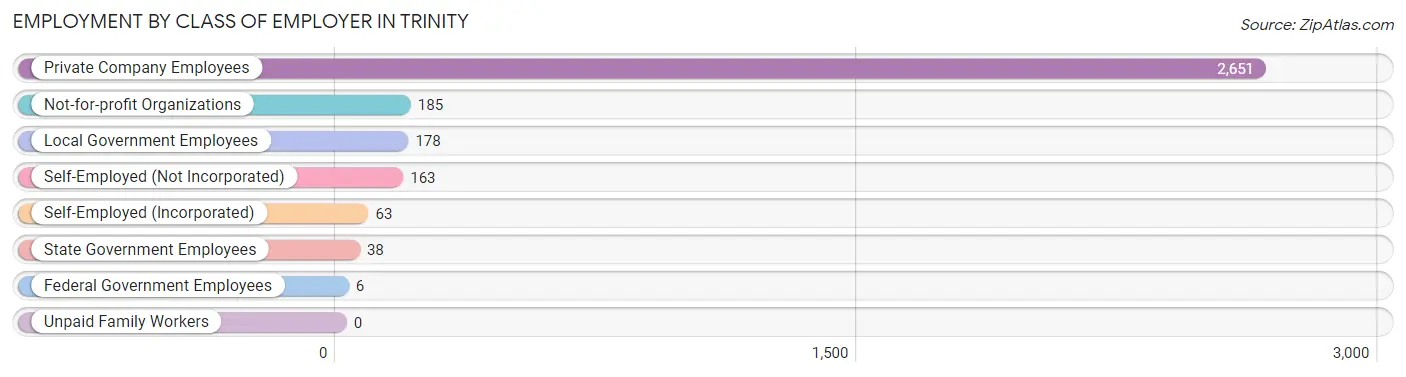
| Employer Class | # Employees | % Employees |
| Private Company Employees | 2,651 | 80.7% |
| Self-Employed (Incorporated) | 63 | 1.9% |
| Self-Employed (Not Incorporated) | 163 | 5.0% |
| Not-for-profit Organizations | 185 | 5.6% |
| Local Government Employees | 178 | 5.4% |
| State Government Employees | 38 | 1.2% |
| Federal Government Employees | 6 | 0.2% |
| Unpaid Family Workers | 0 | 0.0% |
| Total | 3,284 | 100.0% |
Employment Status by Age in Trinity
According to the labor force statistics for Trinity, out of the total population over 16 years of age (5,614), 62.0% or 3,481 individuals are in the labor force, with 3.6% or 125 of them unemployed. The age group with the highest labor force participation rate is 45 to 54 years, with 85.1% or 589 individuals in the labor force. Within the labor force, the 55 to 59 years age range has the highest percentage of unemployed individuals, with 12.3% or 45 of them being unemployed.
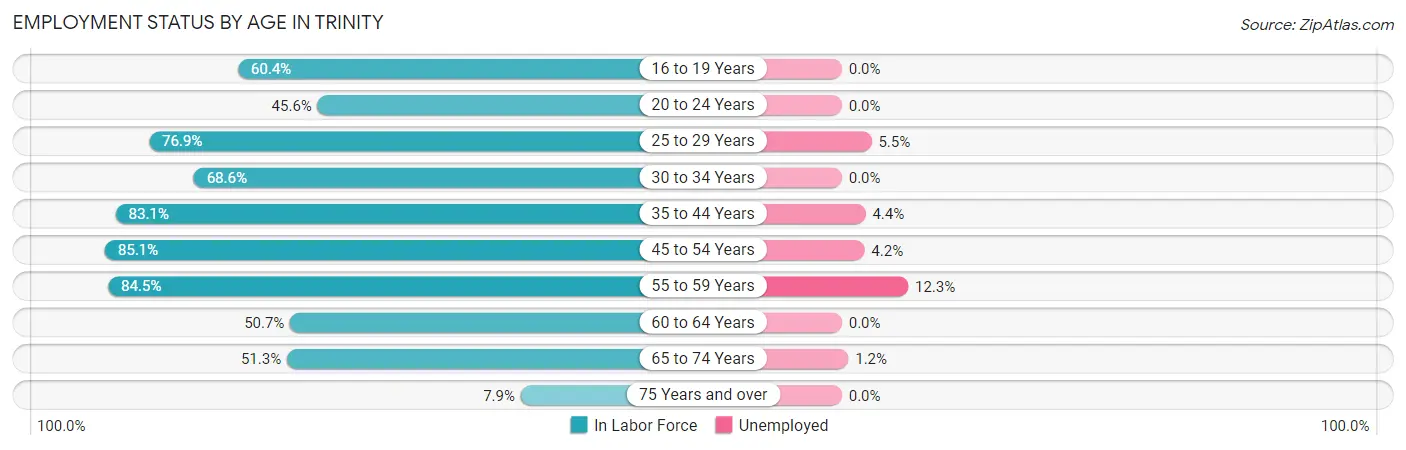
| Age Bracket | In Labor Force | Unemployed |
| 16 to 19 Years | 212 (60.4%) | 0 (0.0%) |
| 20 to 24 Years | 169 (45.6%) | 0 (0.0%) |
| 25 to 29 Years | 490 (76.9%) | 27 (5.5%) |
| 30 to 34 Years | 238 (68.6%) | 0 (0.0%) |
| 35 to 44 Years | 476 (83.1%) | 21 (4.4%) |
| 45 to 54 Years | 589 (85.1%) | 25 (4.2%) |
| 55 to 59 Years | 365 (84.5%) | 45 (12.3%) |
| 60 to 64 Years | 250 (50.7%) | 0 (0.0%) |
| 65 to 74 Years | 655 (51.3%) | 8 (1.2%) |
| 75 Years and over | 35 (7.9%) | 0 (0.0%) |
| Total | 3,481 (62.0%) | 125 (3.6%) |
Employment Status by Educational Attainment in Trinity
According to labor force statistics for Trinity, 75.9% of individuals (2,409) out of the total population between 25 and 64 years of age (3,174) are in the labor force, with 4.9% or 118 of them being unemployed. The group with the highest labor force participation rate are those with the educational attainment of bachelor's degree or higher, with 95.9% or 602 individuals in the labor force. Within the labor force, individuals with high school diploma education have the highest percentage of unemployment, with 7.1% or 69 of them being unemployed.
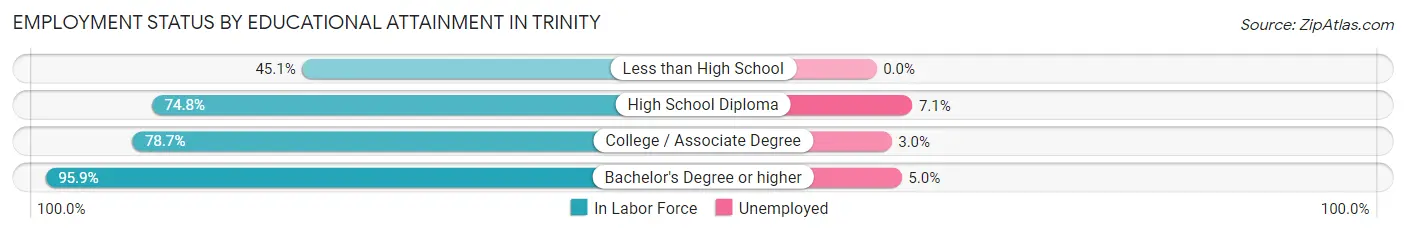
| Educational Attainment | In Labor Force | Unemployed |
| Less than High School | 198 (45.1%) | 0 (0.0%) |
| High School Diploma | 966 (74.8%) | 92 (7.1%) |
| College / Associate Degree | 641 (78.7%) | 24 (3.0%) |
| Bachelor's Degree or higher | 602 (95.9%) | 31 (5.0%) |
| Total | 2,409 (75.9%) | 156 (4.9%) |
Employment Occupations by Sex in Trinity
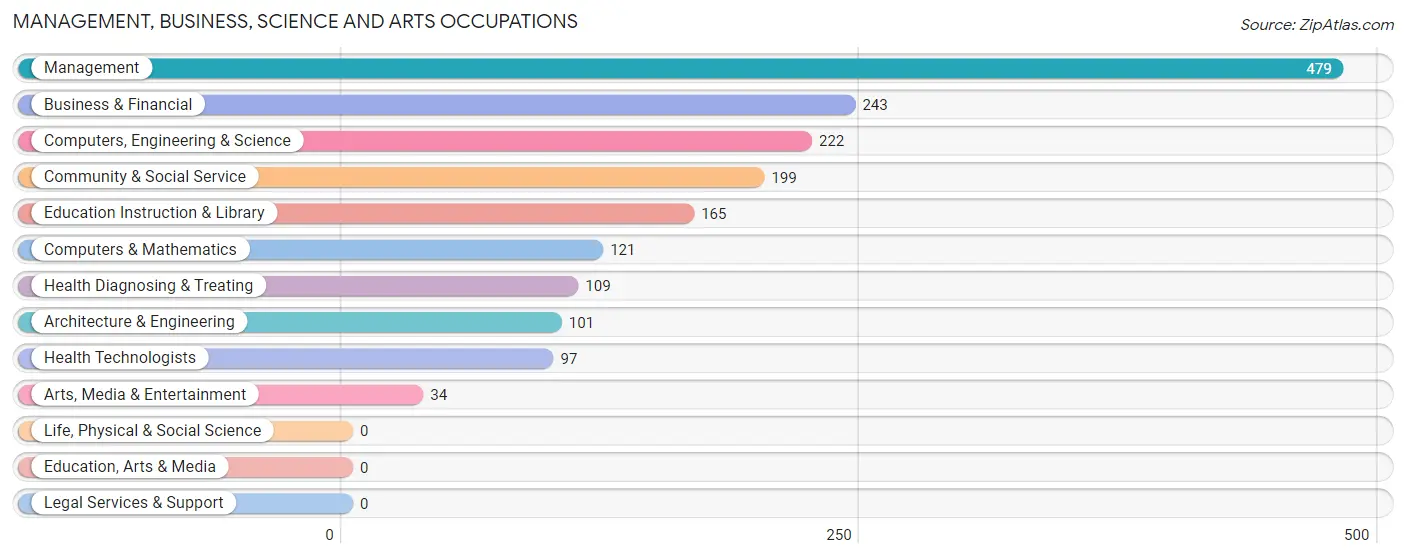
Management, Business, Science and Arts Occupations
The most common Management, Business, Science and Arts occupations in Trinity are Management (479 | 14.3%), Business & Financial (243 | 7.2%), Computers, Engineering & Science (222 | 6.6%), Community & Social Service (199 | 5.9%), and Education Instruction & Library (165 | 4.9%).
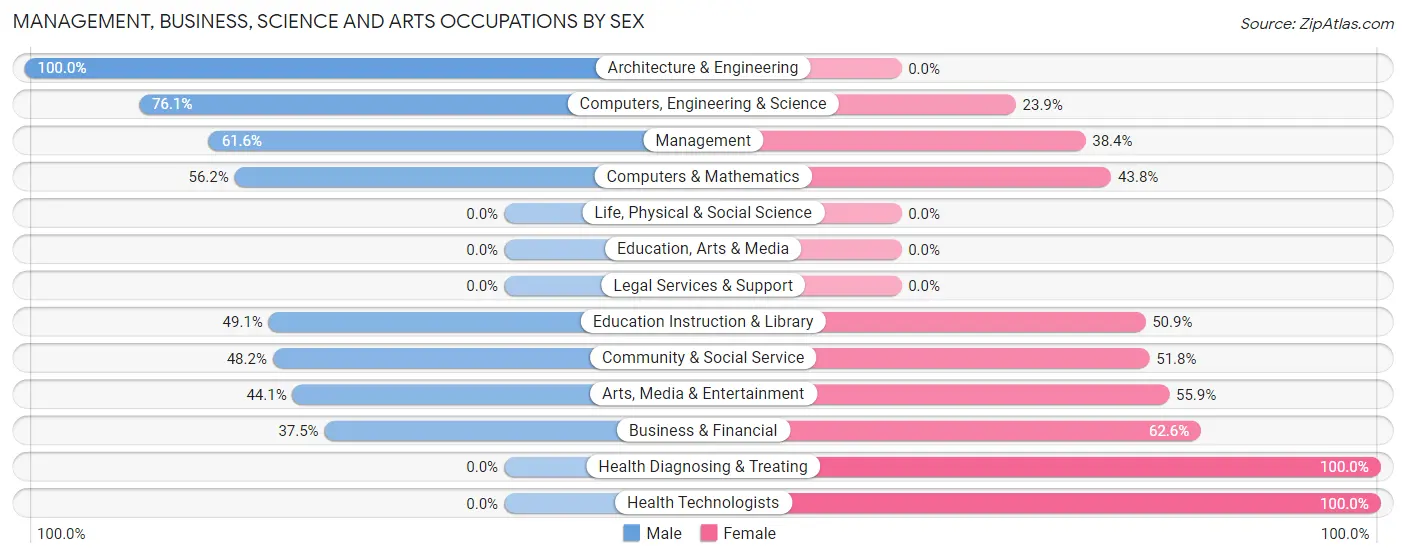
Management, Business, Science and Arts Occupations by Sex
Within the Management, Business, Science and Arts occupations in Trinity, the most male-oriented occupations are Architecture & Engineering (100.0%), Computers, Engineering & Science (76.1%), and Management (61.6%), while the most female-oriented occupations are Health Diagnosing & Treating (100.0%), Health Technologists (100.0%), and Business & Financial (62.5%).
| Occupation | Male | Female |
| Management | 295 (61.6%) | 184 (38.4%) |
| Business & Financial | 91 (37.4%) | 152 (62.5%) |
| Computers, Engineering & Science | 169 (76.1%) | 53 (23.9%) |
| Computers & Mathematics | 68 (56.2%) | 53 (43.8%) |
| Architecture & Engineering | 101 (100.0%) | 0 (0.0%) |
| Life, Physical & Social Science | 0 (0.0%) | 0 (0.0%) |
| Community & Social Service | 96 (48.2%) | 103 (51.8%) |
| Education, Arts & Media | 0 (0.0%) | 0 (0.0%) |
| Legal Services & Support | 0 (0.0%) | 0 (0.0%) |
| Education Instruction & Library | 81 (49.1%) | 84 (50.9%) |
| Arts, Media & Entertainment | 15 (44.1%) | 19 (55.9%) |
| Health Diagnosing & Treating | 0 (0.0%) | 109 (100.0%) |
| Health Technologists | 0 (0.0%) | 97 (100.0%) |
| Total (Category) | 651 (52.0%) | 601 (48.0%) |
| Total (Overall) | 1,810 (54.0%) | 1,543 (46.0%) |
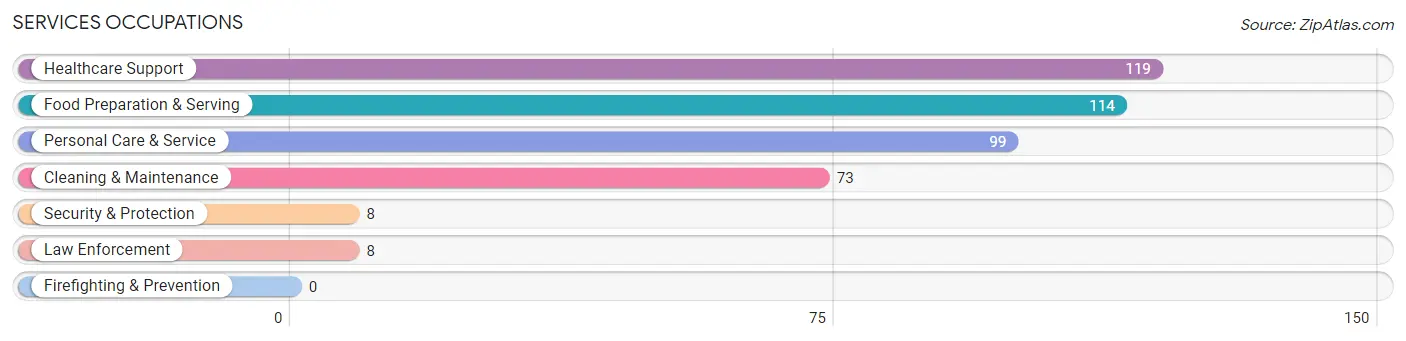
Services Occupations
The most common Services occupations in Trinity are Healthcare Support (119 | 3.5%), Food Preparation & Serving (114 | 3.4%), Personal Care & Service (99 | 2.9%), Cleaning & Maintenance (73 | 2.2%), and Security & Protection (8 | 0.2%).
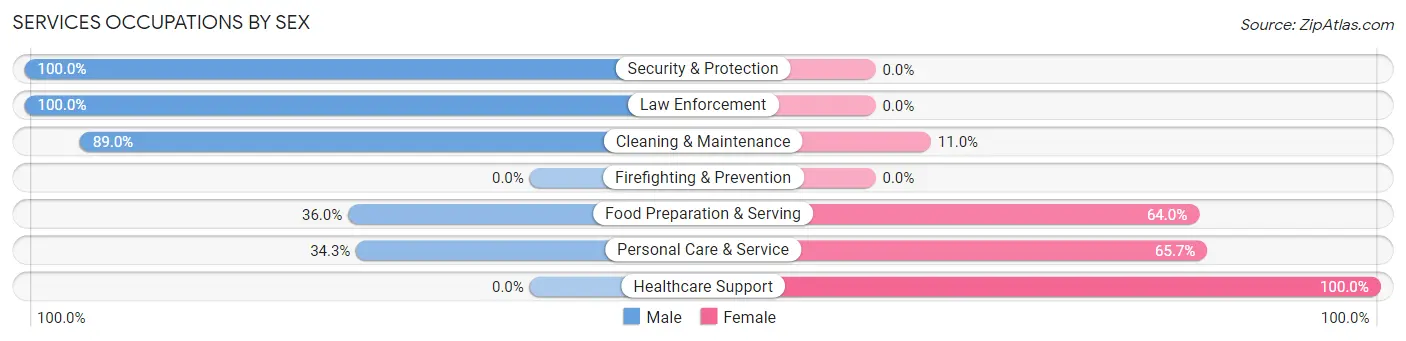
Services Occupations by Sex
Within the Services occupations in Trinity, the most male-oriented occupations are Security & Protection (100.0%), Law Enforcement (100.0%), and Cleaning & Maintenance (89.0%), while the most female-oriented occupations are Healthcare Support (100.0%), Personal Care & Service (65.7%), and Food Preparation & Serving (64.0%).
| Occupation | Male | Female |
| Healthcare Support | 0 (0.0%) | 119 (100.0%) |
| Security & Protection | 8 (100.0%) | 0 (0.0%) |
| Firefighting & Prevention | 0 (0.0%) | 0 (0.0%) |
| Law Enforcement | 8 (100.0%) | 0 (0.0%) |
| Food Preparation & Serving | 41 (36.0%) | 73 (64.0%) |
| Cleaning & Maintenance | 65 (89.0%) | 8 (11.0%) |
| Personal Care & Service | 34 (34.3%) | 65 (65.7%) |
| Total (Category) | 148 (35.8%) | 265 (64.2%) |
| Total (Overall) | 1,810 (54.0%) | 1,543 (46.0%) |
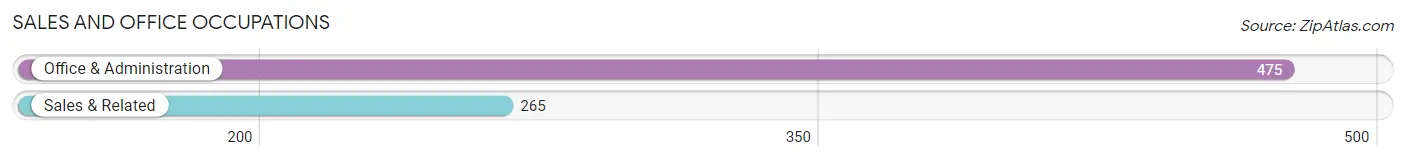
Sales and Office Occupations
The most common Sales and Office occupations in Trinity are Office & Administration (475 | 14.2%), and Sales & Related (265 | 7.9%).
Sales and Office Occupations by Sex
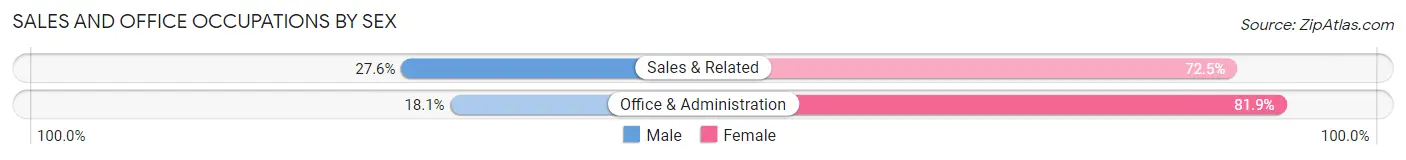
| Occupation | Male | Female |
| Sales & Related | 73 (27.6%) | 192 (72.5%) |
| Office & Administration | 86 (18.1%) | 389 (81.9%) |
| Total (Category) | 159 (21.5%) | 581 (78.5%) |
| Total (Overall) | 1,810 (54.0%) | 1,543 (46.0%) |
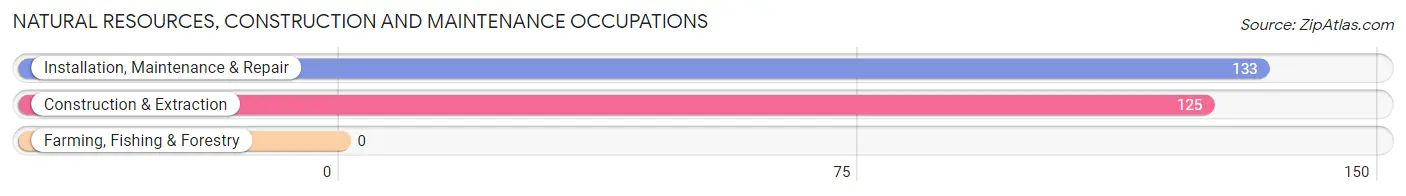
Natural Resources, Construction and Maintenance Occupations
The most common Natural Resources, Construction and Maintenance occupations in Trinity are Installation, Maintenance & Repair (133 | 4.0%), and Construction & Extraction (125 | 3.7%).
Natural Resources, Construction and Maintenance Occupations by Sex
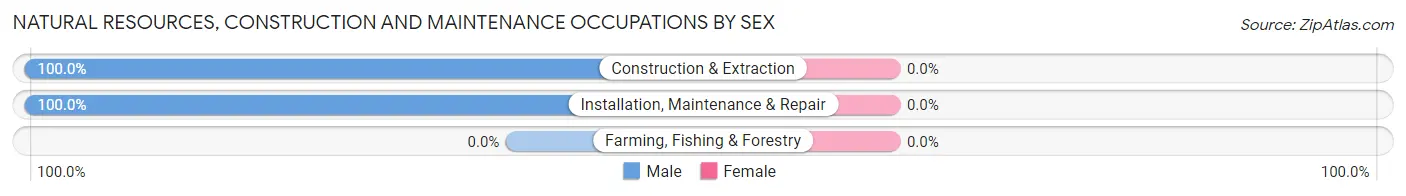
| Occupation | Male | Female |
| Farming, Fishing & Forestry | 0 (0.0%) | 0 (0.0%) |
| Construction & Extraction | 125 (100.0%) | 0 (0.0%) |
| Installation, Maintenance & Repair | 133 (100.0%) | 0 (0.0%) |
| Total (Category) | 258 (100.0%) | 0 (0.0%) |
| Total (Overall) | 1,810 (54.0%) | 1,543 (46.0%) |
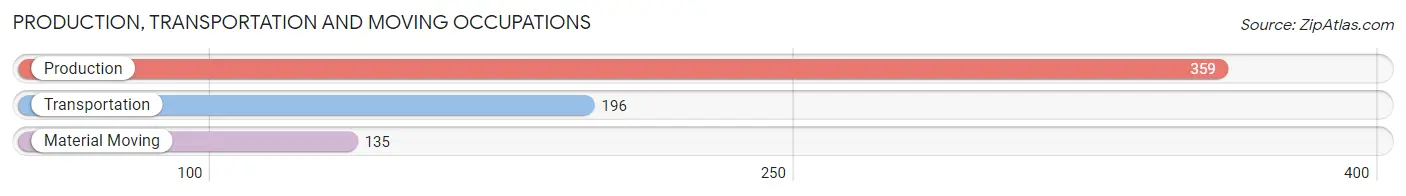
Production, Transportation and Moving Occupations
The most common Production, Transportation and Moving occupations in Trinity are Production (359 | 10.7%), Transportation (196 | 5.9%), and Material Moving (135 | 4.0%).
Production, Transportation and Moving Occupations by Sex
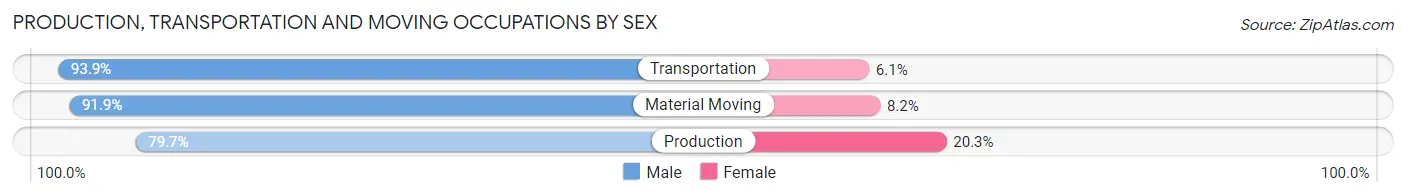
| Occupation | Male | Female |
| Production | 286 (79.7%) | 73 (20.3%) |
| Transportation | 184 (93.9%) | 12 (6.1%) |
| Material Moving | 124 (91.8%) | 11 (8.2%) |
| Total (Category) | 594 (86.1%) | 96 (13.9%) |
| Total (Overall) | 1,810 (54.0%) | 1,543 (46.0%) |
Employment Industries by Sex in Trinity
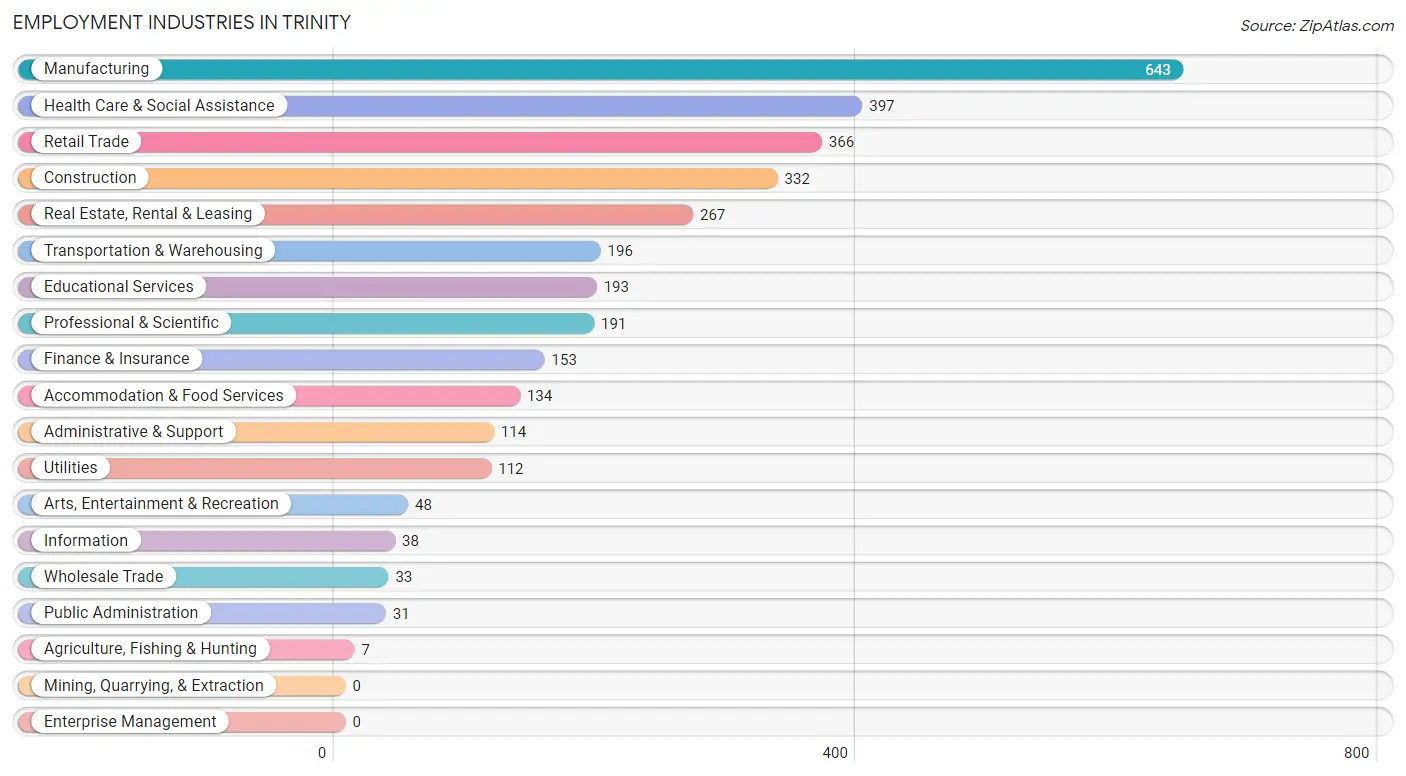
Employment Industries in Trinity
The major employment industries in Trinity include Manufacturing (643 | 19.2%), Health Care & Social Assistance (397 | 11.8%), Retail Trade (366 | 10.9%), Construction (332 | 9.9%), and Real Estate, Rental & Leasing (267 | 8.0%).
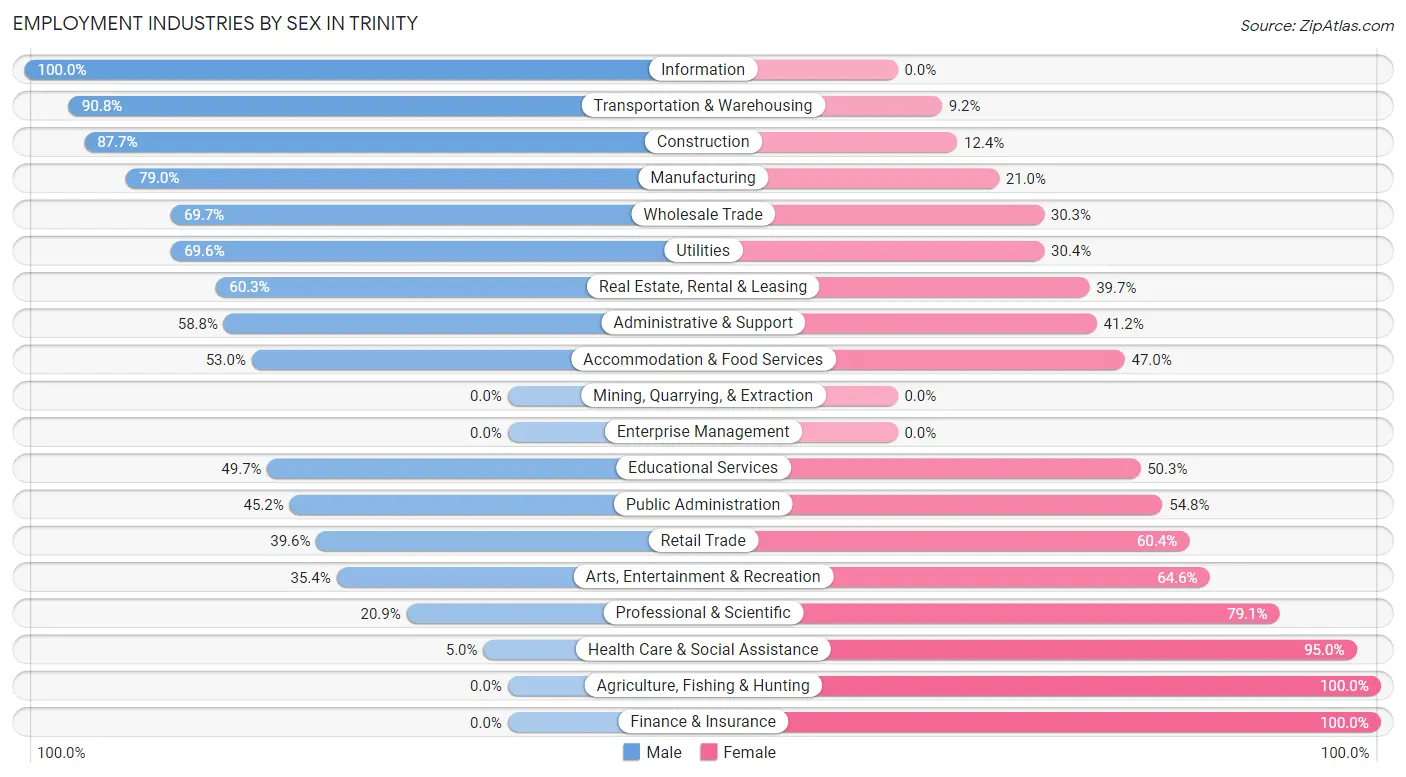
Employment Industries by Sex in Trinity
The Trinity industries that see more men than women are Information (100.0%), Transportation & Warehousing (90.8%), and Construction (87.6%), whereas the industries that tend to have a higher number of women are Agriculture, Fishing & Hunting (100.0%), Finance & Insurance (100.0%), and Health Care & Social Assistance (95.0%).
| Industry | Male | Female |
| Agriculture, Fishing & Hunting | 0 (0.0%) | 7 (100.0%) |
| Mining, Quarrying, & Extraction | 0 (0.0%) | 0 (0.0%) |
| Construction | 291 (87.6%) | 41 (12.3%) |
| Manufacturing | 508 (79.0%) | 135 (21.0%) |
| Wholesale Trade | 23 (69.7%) | 10 (30.3%) |
| Retail Trade | 145 (39.6%) | 221 (60.4%) |
| Transportation & Warehousing | 178 (90.8%) | 18 (9.2%) |
| Utilities | 78 (69.6%) | 34 (30.4%) |
| Information | 38 (100.0%) | 0 (0.0%) |
| Finance & Insurance | 0 (0.0%) | 153 (100.0%) |
| Real Estate, Rental & Leasing | 161 (60.3%) | 106 (39.7%) |
| Professional & Scientific | 40 (20.9%) | 151 (79.1%) |
| Enterprise Management | 0 (0.0%) | 0 (0.0%) |
| Administrative & Support | 67 (58.8%) | 47 (41.2%) |
| Educational Services | 96 (49.7%) | 97 (50.3%) |
| Health Care & Social Assistance | 20 (5.0%) | 377 (95.0%) |
| Arts, Entertainment & Recreation | 17 (35.4%) | 31 (64.6%) |
| Accommodation & Food Services | 71 (53.0%) | 63 (47.0%) |
| Public Administration | 14 (45.2%) | 17 (54.8%) |
| Total | 1,810 (54.0%) | 1,543 (46.0%) |
Education in Trinity
School Enrollment in Trinity
The most common levels of schooling among the 1,579 students in Trinity are elementary school (440 | 27.9%), high school (378 | 23.9%), and middle school (364 | 23.1%).
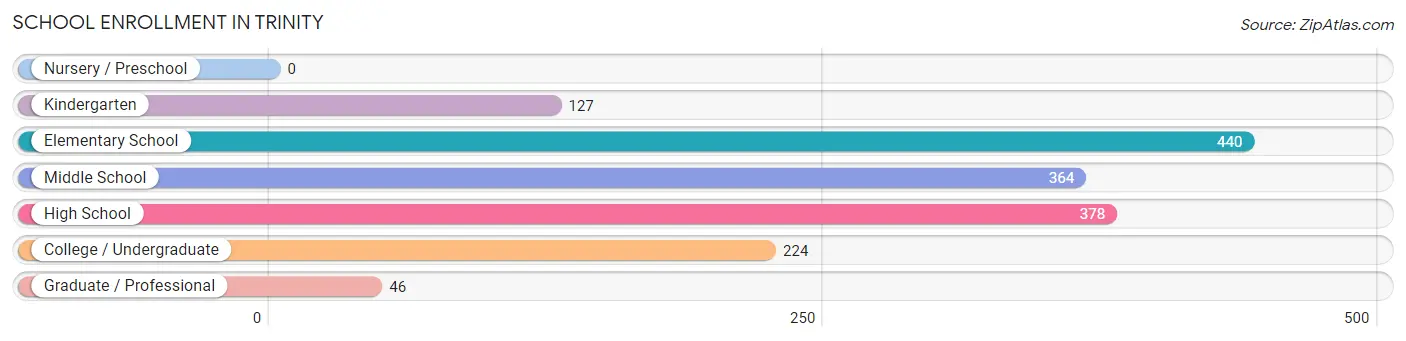
| School Level | # Students | % Students |
| Nursery / Preschool | 0 | 0.0% |
| Kindergarten | 127 | 8.0% |
| Elementary School | 440 | 27.9% |
| Middle School | 364 | 23.1% |
| High School | 378 | 23.9% |
| College / Undergraduate | 224 | 14.2% |
| Graduate / Professional | 46 | 2.9% |
| Total | 1,579 | 100.0% |
School Enrollment by Age by Funding Source in Trinity
Out of a total of 1,579 students who are enrolled in schools in Trinity, 234 (14.8%) attend a private institution, while the remaining 1,345 (85.2%) are enrolled in public schools. The age group of 25 to 34 year olds has the highest likelihood of being enrolled in private schools, with 8 (47.1% in the age bracket) enrolled. Conversely, the age group of 20 to 24 year olds has the lowest likelihood of being enrolled in a private school, with 108 (100.0% in the age bracket) attending a public institution.
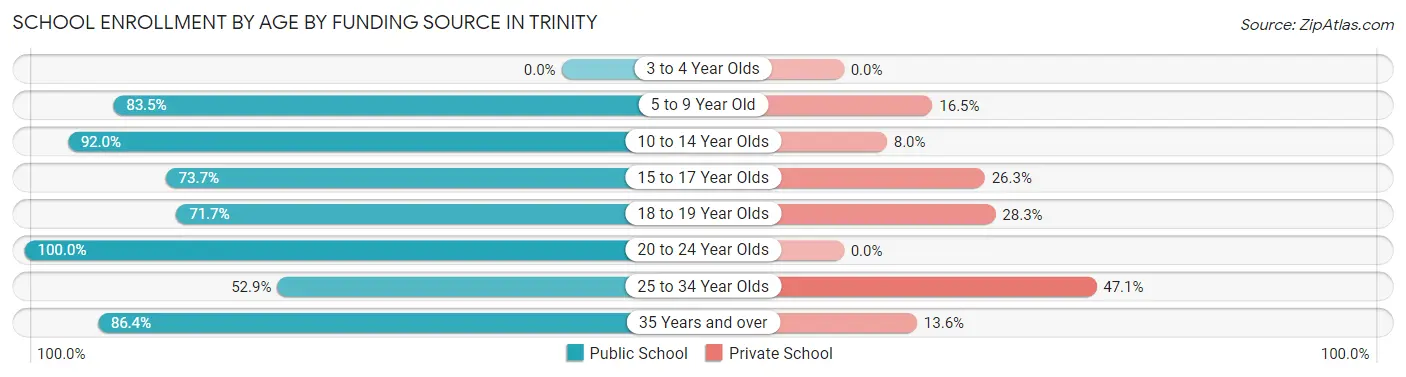
| Age Bracket | Public School | Private School |
| 3 to 4 Year Olds | 0 (0.0%) | 0 (0.0%) |
| 5 to 9 Year Old | 384 (83.5%) | 76 (16.5%) |
| 10 to 14 Year Olds | 481 (92.0%) | 42 (8.0%) |
| 15 to 17 Year Olds | 216 (73.7%) | 77 (26.3%) |
| 18 to 19 Year Olds | 33 (71.7%) | 13 (28.3%) |
| 20 to 24 Year Olds | 108 (100.0%) | 0 (0.0%) |
| 25 to 34 Year Olds | 9 (52.9%) | 8 (47.1%) |
| 35 Years and over | 114 (86.4%) | 18 (13.6%) |
| Total | 1,345 (85.2%) | 234 (14.8%) |
Educational Attainment by Field of Study in Trinity
Education (337 | 33.7%), science & technology (128 | 12.8%), business (106 | 10.6%), engineering (82 | 8.2%), and arts & humanities (70 | 7.0%) are the most common fields of study among 1,000 individuals in Trinity who have obtained a bachelor's degree or higher.
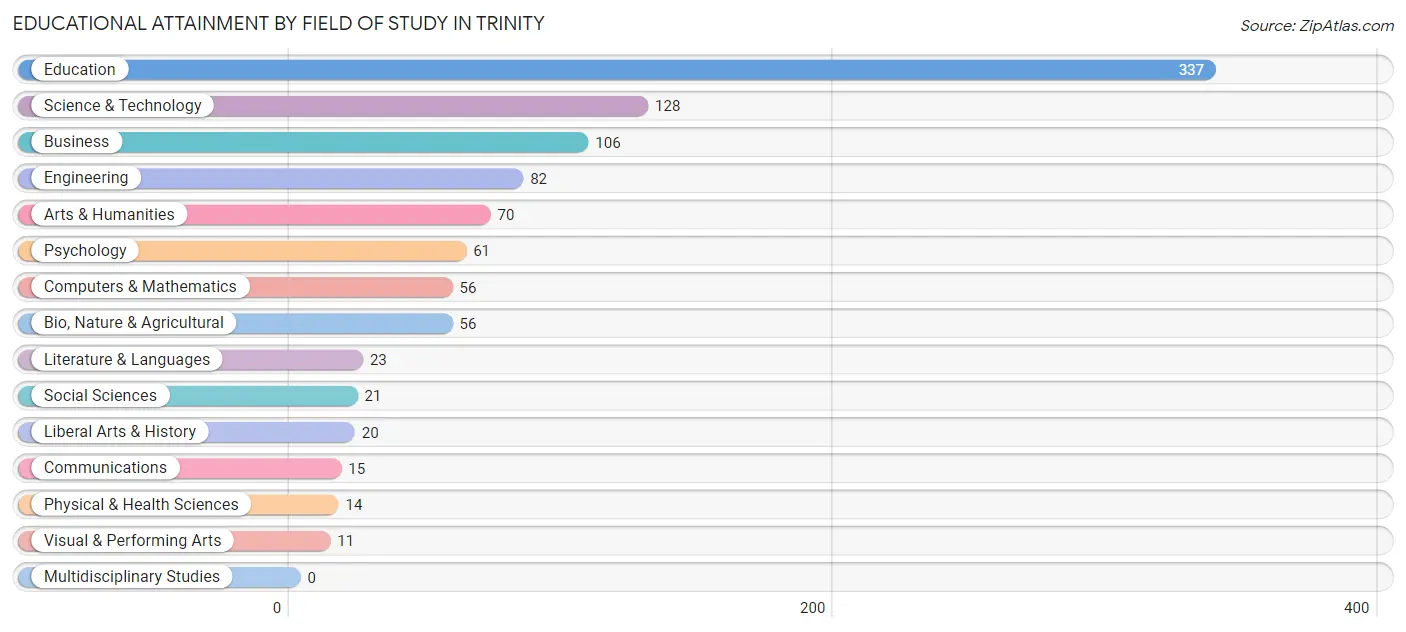
| Field of Study | # Graduates | % Graduates |
| Computers & Mathematics | 56 | 5.6% |
| Bio, Nature & Agricultural | 56 | 5.6% |
| Physical & Health Sciences | 14 | 1.4% |
| Psychology | 61 | 6.1% |
| Social Sciences | 21 | 2.1% |
| Engineering | 82 | 8.2% |
| Multidisciplinary Studies | 0 | 0.0% |
| Science & Technology | 128 | 12.8% |
| Business | 106 | 10.6% |
| Education | 337 | 33.7% |
| Literature & Languages | 23 | 2.3% |
| Liberal Arts & History | 20 | 2.0% |
| Visual & Performing Arts | 11 | 1.1% |
| Communications | 15 | 1.5% |
| Arts & Humanities | 70 | 7.0% |
| Total | 1,000 | 100.0% |
Transportation & Commute in Trinity
Vehicle Availability by Sex in Trinity
The most prevalent vehicle ownership categories in Trinity are males with 3 vehicles (577, accounting for 32.6%) and females with 3 vehicles (394, making up 38.2%).
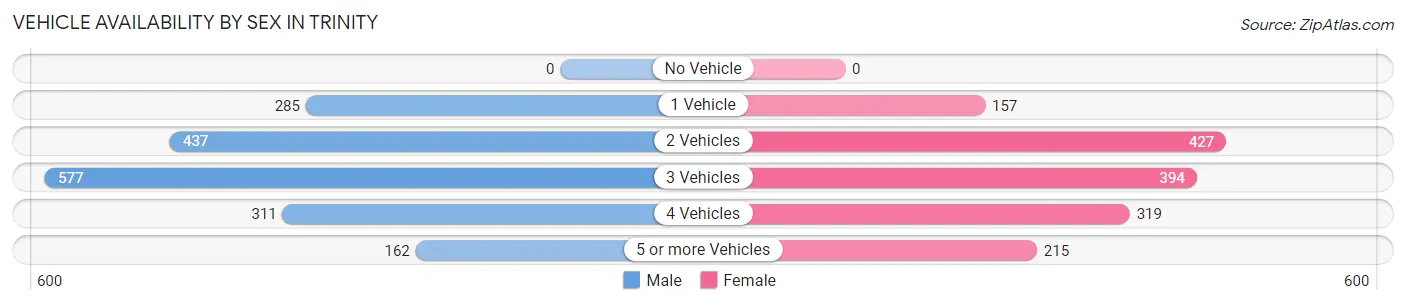
| Vehicles Available | Male | Female |
| No Vehicle | 0 (0.0%) | 0 (0.0%) |
| 1 Vehicle | 285 (16.1%) | 157 (10.4%) |
| 2 Vehicles | 437 (24.7%) | 427 (28.2%) |
| 3 Vehicles | 577 (32.6%) | 394 (26.1%) |
| 4 Vehicles | 311 (17.5%) | 319 (21.1%) |
| 5 or more Vehicles | 162 (9.1%) | 215 (14.2%) |
| Total | 1,772 (100.0%) | 1,512 (100.0%) |
Commute Time in Trinity
The most frequently occuring commute durations in Trinity are 15 to 19 minutes (707 commuters, 24.2%), 20 to 24 minutes (612 commuters, 20.9%), and 30 to 34 minutes (449 commuters, 15.4%).
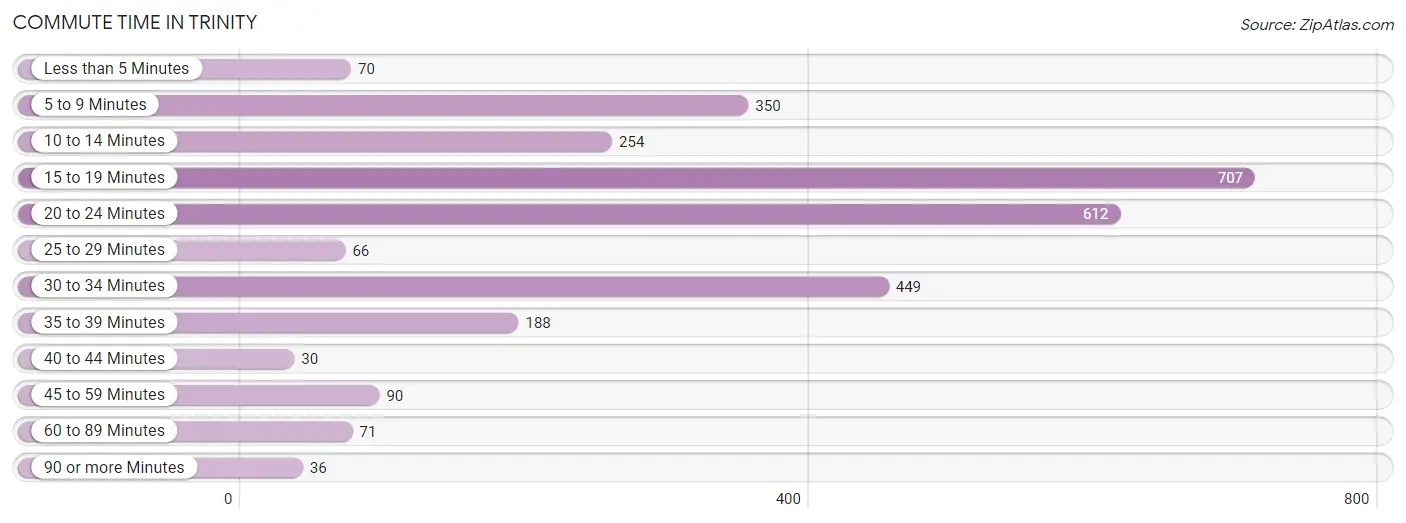
| Commute Time | # Commuters | % Commuters |
| Less than 5 Minutes | 70 | 2.4% |
| 5 to 9 Minutes | 350 | 12.0% |
| 10 to 14 Minutes | 254 | 8.7% |
| 15 to 19 Minutes | 707 | 24.2% |
| 20 to 24 Minutes | 612 | 20.9% |
| 25 to 29 Minutes | 66 | 2.3% |
| 30 to 34 Minutes | 449 | 15.4% |
| 35 to 39 Minutes | 188 | 6.4% |
| 40 to 44 Minutes | 30 | 1.0% |
| 45 to 59 Minutes | 90 | 3.1% |
| 60 to 89 Minutes | 71 | 2.4% |
| 90 or more Minutes | 36 | 1.2% |
Commute Time by Sex in Trinity
The most common commute times in Trinity are 15 to 19 minutes (398 commuters, 25.9%) for males and 20 to 24 minutes (490 commuters, 35.3%) for females.
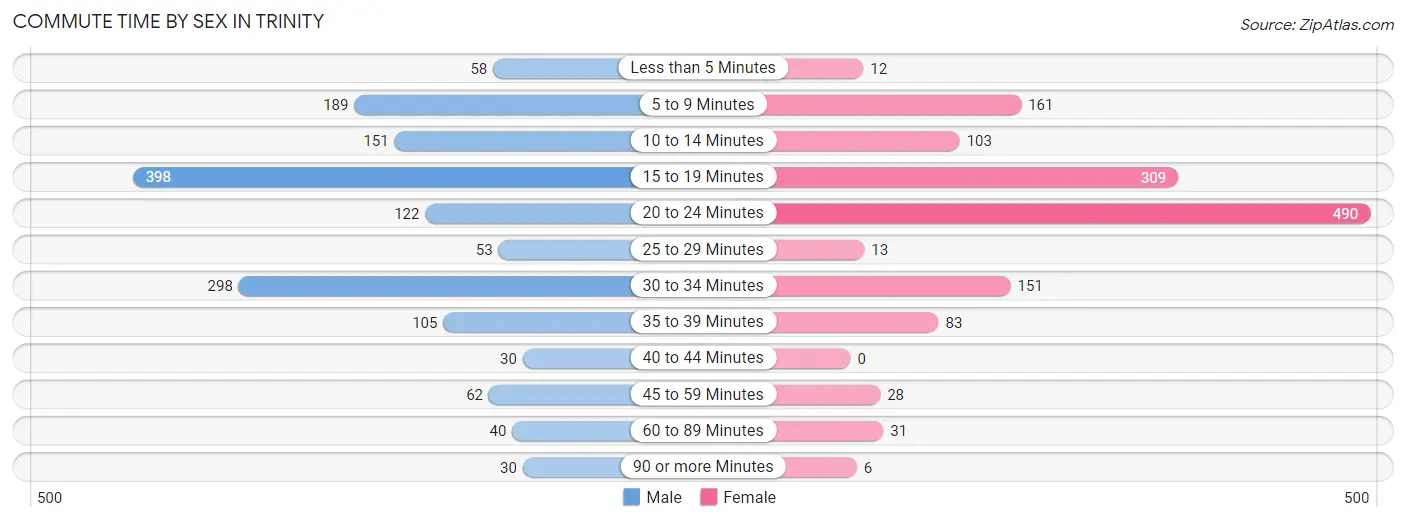
| Commute Time | Male | Female |
| Less than 5 Minutes | 58 (3.8%) | 12 (0.9%) |
| 5 to 9 Minutes | 189 (12.3%) | 161 (11.6%) |
| 10 to 14 Minutes | 151 (9.8%) | 103 (7.4%) |
| 15 to 19 Minutes | 398 (25.9%) | 309 (22.3%) |
| 20 to 24 Minutes | 122 (7.9%) | 490 (35.3%) |
| 25 to 29 Minutes | 53 (3.5%) | 13 (0.9%) |
| 30 to 34 Minutes | 298 (19.4%) | 151 (10.9%) |
| 35 to 39 Minutes | 105 (6.8%) | 83 (6.0%) |
| 40 to 44 Minutes | 30 (1.9%) | 0 (0.0%) |
| 45 to 59 Minutes | 62 (4.0%) | 28 (2.0%) |
| 60 to 89 Minutes | 40 (2.6%) | 31 (2.2%) |
| 90 or more Minutes | 30 (1.9%) | 6 (0.4%) |
Time of Departure to Work by Sex in Trinity
The most frequent times of departure to work in Trinity are 6:30 AM to 6:59 AM (344, 22.4%) for males and 7:00 AM to 7:29 AM (225, 16.2%) for females.
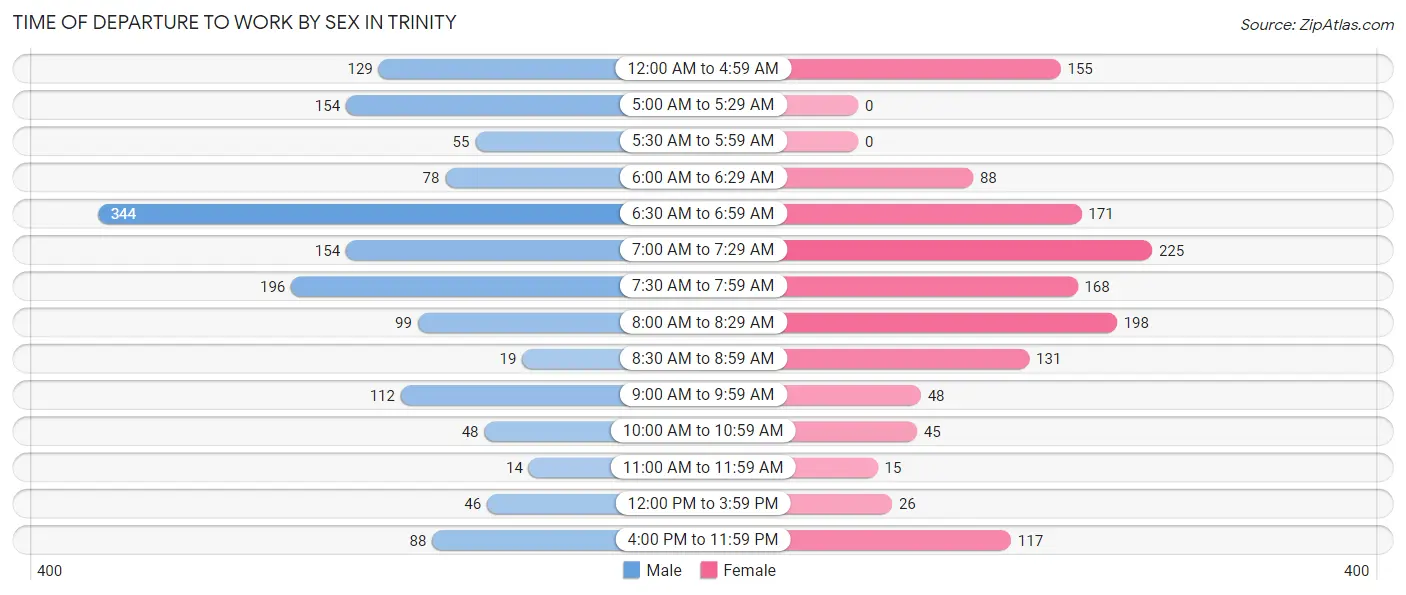
| Time of Departure | Male | Female |
| 12:00 AM to 4:59 AM | 129 (8.4%) | 155 (11.2%) |
| 5:00 AM to 5:29 AM | 154 (10.0%) | 0 (0.0%) |
| 5:30 AM to 5:59 AM | 55 (3.6%) | 0 (0.0%) |
| 6:00 AM to 6:29 AM | 78 (5.1%) | 88 (6.3%) |
| 6:30 AM to 6:59 AM | 344 (22.4%) | 171 (12.3%) |
| 7:00 AM to 7:29 AM | 154 (10.0%) | 225 (16.2%) |
| 7:30 AM to 7:59 AM | 196 (12.8%) | 168 (12.1%) |
| 8:00 AM to 8:29 AM | 99 (6.5%) | 198 (14.3%) |
| 8:30 AM to 8:59 AM | 19 (1.2%) | 131 (9.4%) |
| 9:00 AM to 9:59 AM | 112 (7.3%) | 48 (3.5%) |
| 10:00 AM to 10:59 AM | 48 (3.1%) | 45 (3.2%) |
| 11:00 AM to 11:59 AM | 14 (0.9%) | 15 (1.1%) |
| 12:00 PM to 3:59 PM | 46 (3.0%) | 26 (1.9%) |
| 4:00 PM to 11:59 PM | 88 (5.7%) | 117 (8.4%) |
| Total | 1,536 (100.0%) | 1,387 (100.0%) |
Housing Occupancy in Trinity
Occupancy by Ownership in Trinity
Of the total 2,676 dwellings in Trinity, owner-occupied units account for 2,082 (77.8%), while renter-occupied units make up 594 (22.2%).
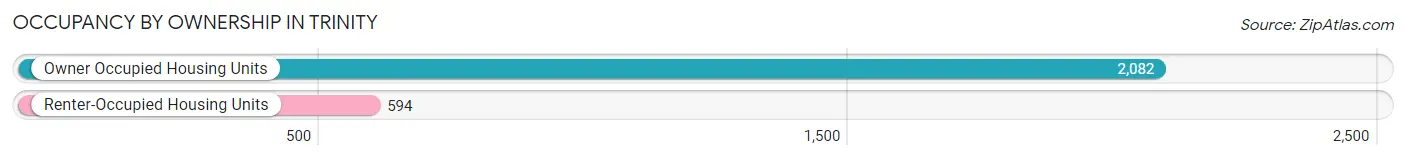
| Occupancy | # Housing Units | % Housing Units |
| Owner Occupied Housing Units | 2,082 | 77.8% |
| Renter-Occupied Housing Units | 594 | 22.2% |
| Total Occupied Housing Units | 2,676 | 100.0% |
Occupancy by Household Size in Trinity
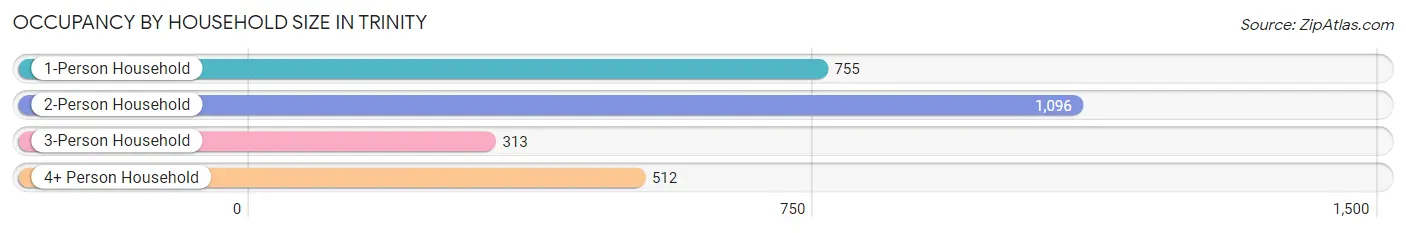
| Household Size | # Housing Units | % Housing Units |
| 1-Person Household | 755 | 28.2% |
| 2-Person Household | 1,096 | 41.0% |
| 3-Person Household | 313 | 11.7% |
| 4+ Person Household | 512 | 19.1% |
| Total Housing Units | 2,676 | 100.0% |
Occupancy by Ownership by Household Size in Trinity
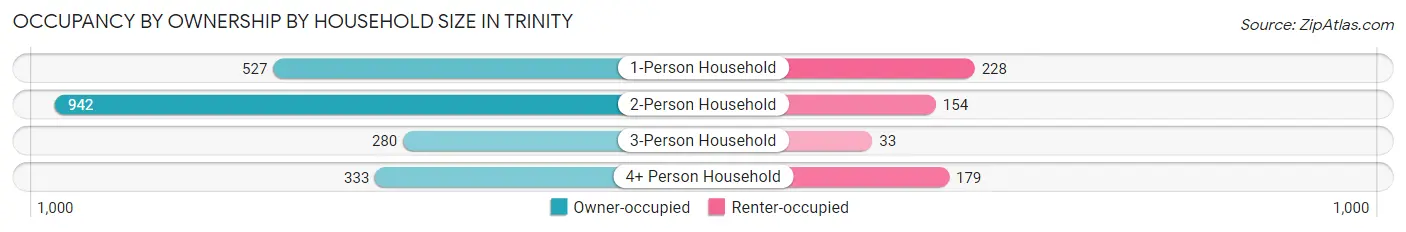
| Household Size | Owner-occupied | Renter-occupied |
| 1-Person Household | 527 (69.8%) | 228 (30.2%) |
| 2-Person Household | 942 (86.0%) | 154 (14.1%) |
| 3-Person Household | 280 (89.5%) | 33 (10.5%) |
| 4+ Person Household | 333 (65.0%) | 179 (35.0%) |
| Total Housing Units | 2,082 (77.8%) | 594 (22.2%) |
Occupancy by Educational Attainment in Trinity
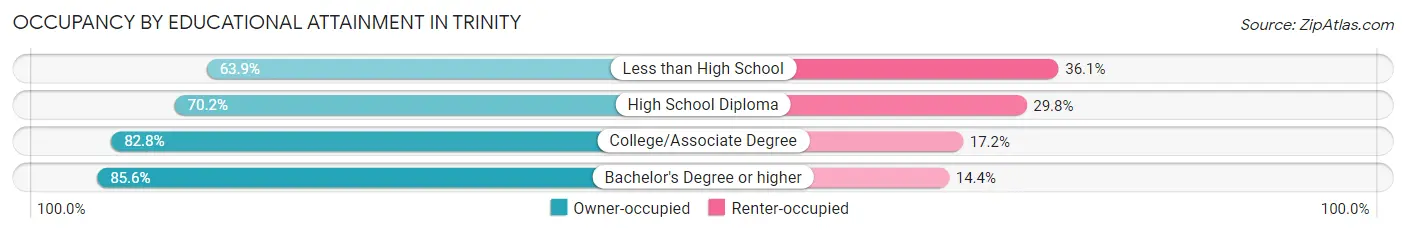
| Household Size | Owner-occupied | Renter-occupied |
| Less than High School | 138 (63.9%) | 78 (36.1%) |
| High School Diploma | 616 (70.2%) | 261 (29.8%) |
| College/Associate Degree | 805 (82.8%) | 167 (17.2%) |
| Bachelor's Degree or higher | 523 (85.6%) | 88 (14.4%) |
Occupancy by Age of Householder in Trinity
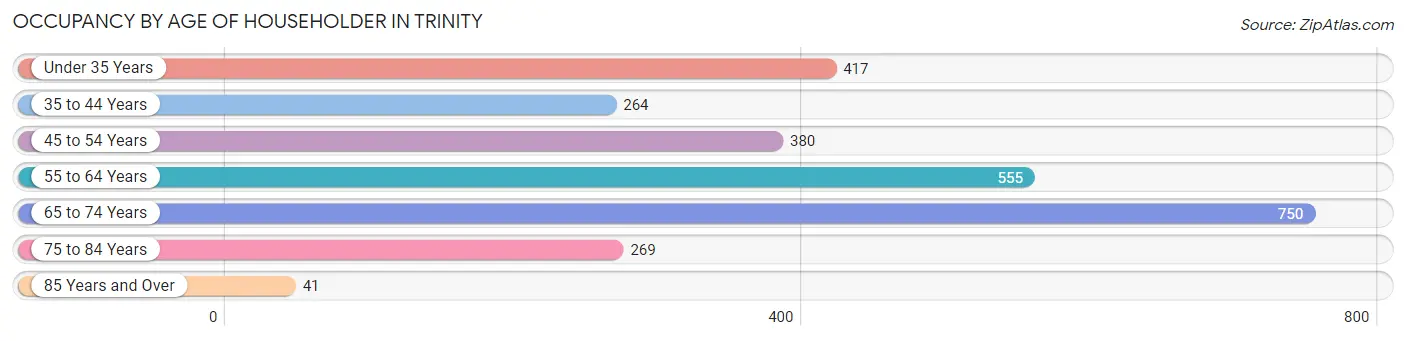
| Age Bracket | # Households | % Households |
| Under 35 Years | 417 | 15.6% |
| 35 to 44 Years | 264 | 9.9% |
| 45 to 54 Years | 380 | 14.2% |
| 55 to 64 Years | 555 | 20.7% |
| 65 to 74 Years | 750 | 28.0% |
| 75 to 84 Years | 269 | 10.1% |
| 85 Years and Over | 41 | 1.5% |
| Total | 2,676 | 100.0% |
Housing Finances in Trinity
Median Income by Occupancy in Trinity
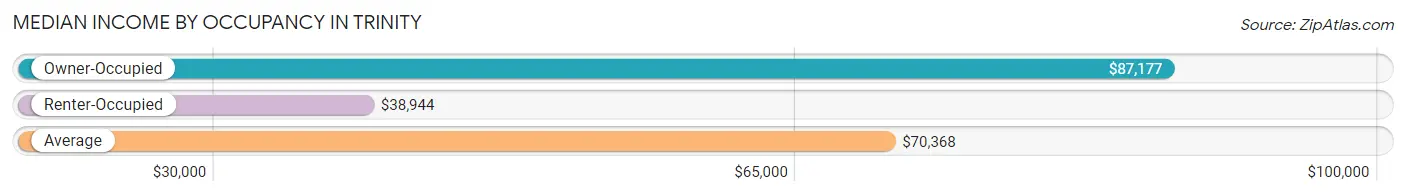
| Occupancy Type | # Households | Median Income |
| Owner-Occupied | 2,082 (77.8%) | $87,177 |
| Renter-Occupied | 594 (22.2%) | $38,944 |
| Average | 2,676 (100.0%) | $70,368 |
Occupancy by Householder Income Bracket in Trinity
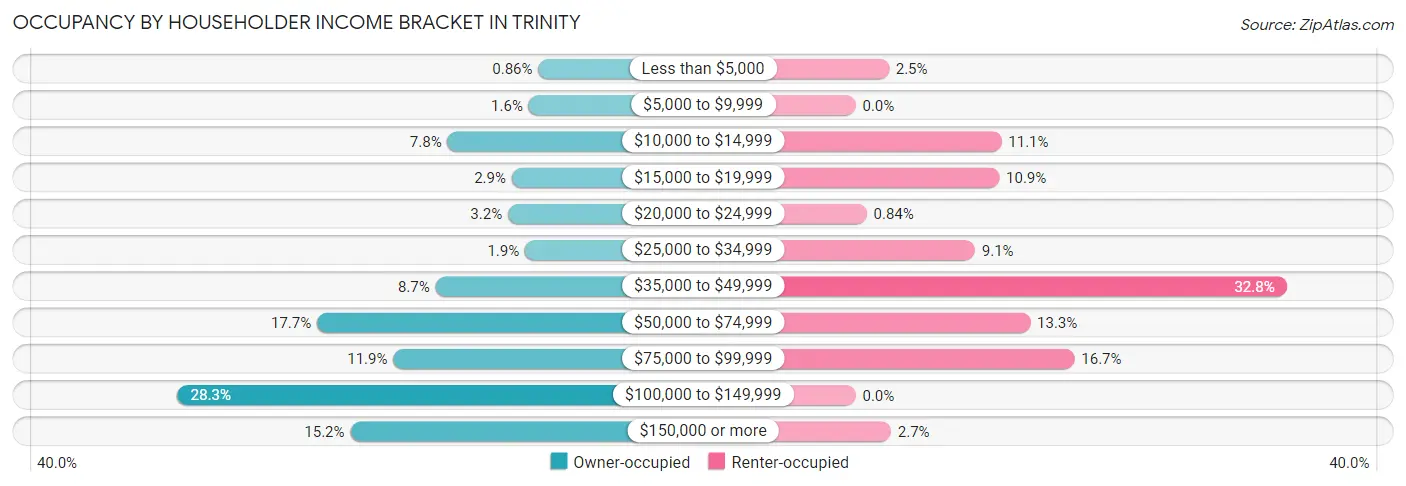
| Income Bracket | Owner-occupied | Renter-occupied |
| Less than $5,000 | 18 (0.9%) | 15 (2.5%) |
| $5,000 to $9,999 | 33 (1.6%) | 0 (0.0%) |
| $10,000 to $14,999 | 162 (7.8%) | 66 (11.1%) |
| $15,000 to $19,999 | 60 (2.9%) | 65 (10.9%) |
| $20,000 to $24,999 | 66 (3.2%) | 5 (0.8%) |
| $25,000 to $34,999 | 39 (1.9%) | 54 (9.1%) |
| $35,000 to $49,999 | 181 (8.7%) | 195 (32.8%) |
| $50,000 to $74,999 | 369 (17.7%) | 79 (13.3%) |
| $75,000 to $99,999 | 248 (11.9%) | 99 (16.7%) |
| $100,000 to $149,999 | 590 (28.3%) | 0 (0.0%) |
| $150,000 or more | 316 (15.2%) | 16 (2.7%) |
| Total | 2,082 (100.0%) | 594 (100.0%) |
Monthly Housing Cost Tiers in Trinity
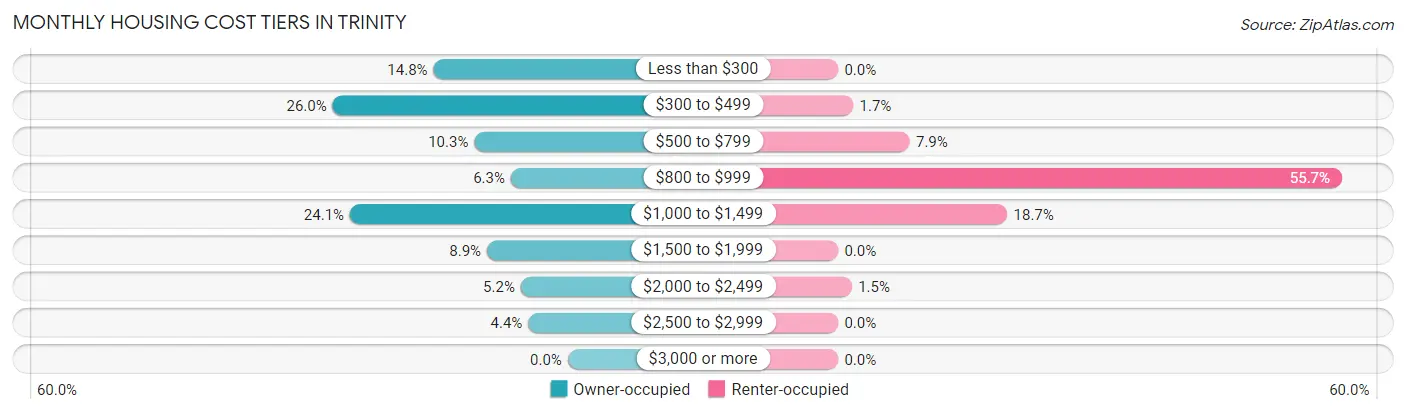
| Monthly Cost | Owner-occupied | Renter-occupied |
| Less than $300 | 309 (14.8%) | 0 (0.0%) |
| $300 to $499 | 541 (26.0%) | 10 (1.7%) |
| $500 to $799 | 215 (10.3%) | 47 (7.9%) |
| $800 to $999 | 131 (6.3%) | 331 (55.7%) |
| $1,000 to $1,499 | 501 (24.1%) | 111 (18.7%) |
| $1,500 to $1,999 | 186 (8.9%) | 0 (0.0%) |
| $2,000 to $2,499 | 108 (5.2%) | 9 (1.5%) |
| $2,500 to $2,999 | 91 (4.4%) | 0 (0.0%) |
| $3,000 or more | 0 (0.0%) | 0 (0.0%) |
| Total | 2,082 (100.0%) | 594 (100.0%) |
Physical Housing Characteristics in Trinity
Housing Structures in Trinity
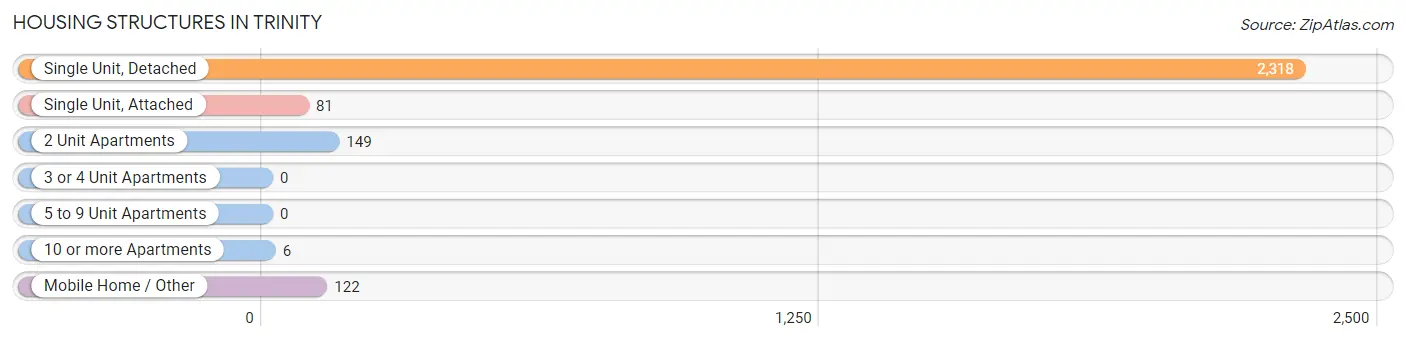
| Structure Type | # Housing Units | % Housing Units |
| Single Unit, Detached | 2,318 | 86.6% |
| Single Unit, Attached | 81 | 3.0% |
| 2 Unit Apartments | 149 | 5.6% |
| 3 or 4 Unit Apartments | 0 | 0.0% |
| 5 to 9 Unit Apartments | 0 | 0.0% |
| 10 or more Apartments | 6 | 0.2% |
| Mobile Home / Other | 122 | 4.6% |
| Total | 2,676 | 100.0% |
Housing Structures by Occupancy in Trinity
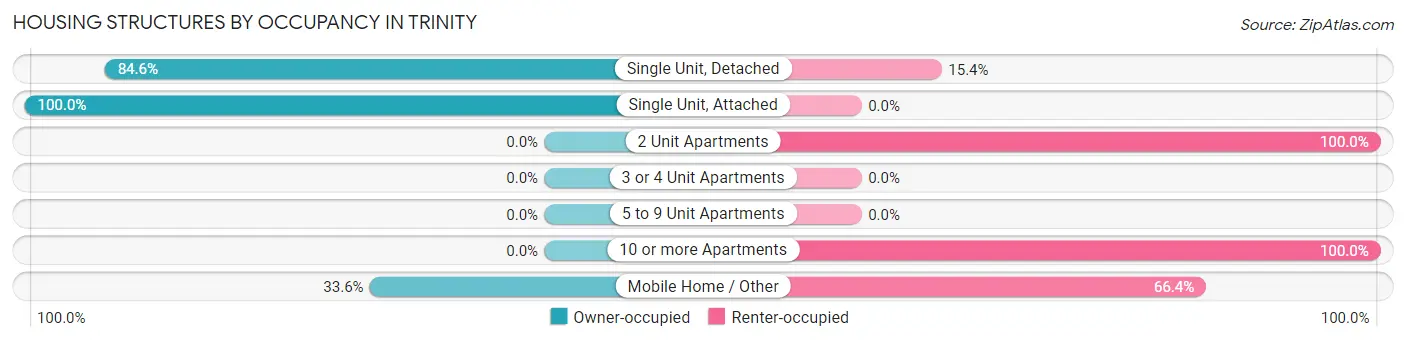
| Structure Type | Owner-occupied | Renter-occupied |
| Single Unit, Detached | 1,960 (84.6%) | 358 (15.4%) |
| Single Unit, Attached | 81 (100.0%) | 0 (0.0%) |
| 2 Unit Apartments | 0 (0.0%) | 149 (100.0%) |
| 3 or 4 Unit Apartments | 0 (0.0%) | 0 (0.0%) |
| 5 to 9 Unit Apartments | 0 (0.0%) | 0 (0.0%) |
| 10 or more Apartments | 0 (0.0%) | 6 (100.0%) |
| Mobile Home / Other | 41 (33.6%) | 81 (66.4%) |
| Total | 2,082 (77.8%) | 594 (22.2%) |
Housing Structures by Number of Rooms in Trinity
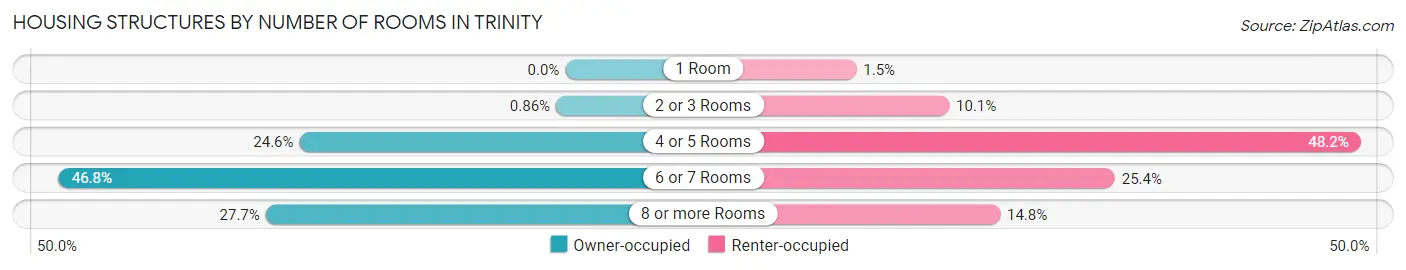
| Number of Rooms | Owner-occupied | Renter-occupied |
| 1 Room | 0 (0.0%) | 9 (1.5%) |
| 2 or 3 Rooms | 18 (0.9%) | 60 (10.1%) |
| 4 or 5 Rooms | 512 (24.6%) | 286 (48.1%) |
| 6 or 7 Rooms | 975 (46.8%) | 151 (25.4%) |
| 8 or more Rooms | 577 (27.7%) | 88 (14.8%) |
| Total | 2,082 (100.0%) | 594 (100.0%) |
Housing Structure by Heating Type in Trinity
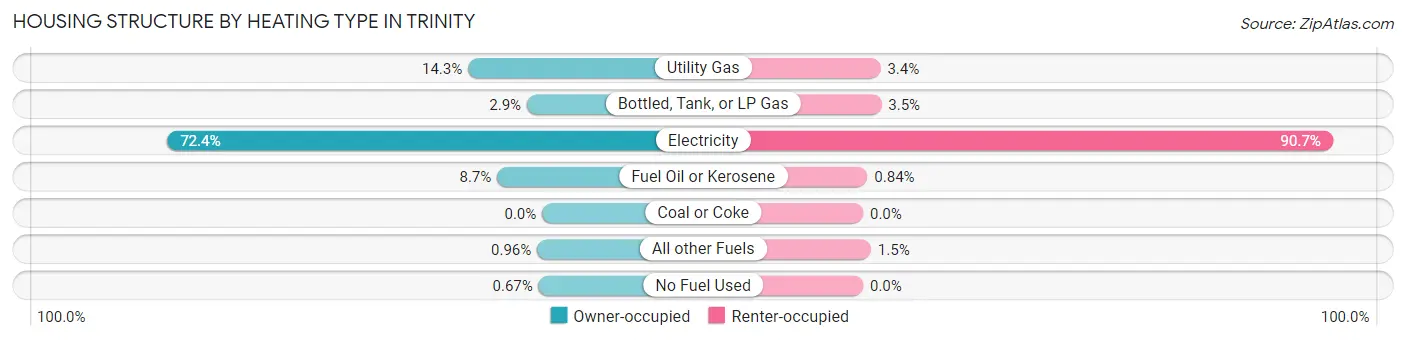
| Heating Type | Owner-occupied | Renter-occupied |
| Utility Gas | 298 (14.3%) | 20 (3.4%) |
| Bottled, Tank, or LP Gas | 61 (2.9%) | 21 (3.5%) |
| Electricity | 1,508 (72.4%) | 539 (90.7%) |
| Fuel Oil or Kerosene | 181 (8.7%) | 5 (0.8%) |
| Coal or Coke | 0 (0.0%) | 0 (0.0%) |
| All other Fuels | 20 (1.0%) | 9 (1.5%) |
| No Fuel Used | 14 (0.7%) | 0 (0.0%) |
| Total | 2,082 (100.0%) | 594 (100.0%) |
Household Vehicle Usage in Trinity
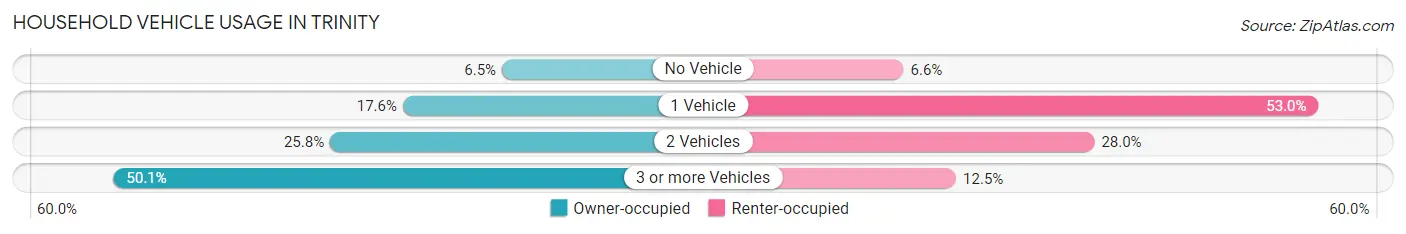
| Vehicles per Household | Owner-occupied | Renter-occupied |
| No Vehicle | 136 (6.5%) | 39 (6.6%) |
| 1 Vehicle | 367 (17.6%) | 315 (53.0%) |
| 2 Vehicles | 537 (25.8%) | 166 (28.0%) |
| 3 or more Vehicles | 1,042 (50.0%) | 74 (12.5%) |
| Total | 2,082 (100.0%) | 594 (100.0%) |
Real Estate & Mortgages in Trinity
Real Estate and Mortgage Overview in Trinity
| Characteristic | Without Mortgage | With Mortgage |
| Housing Units | 919 | 1,163 |
| Median Property Value | $151,400 | $189,600 |
| Median Household Income | $58,798 | $178 |
| Monthly Housing Costs | $373 | $0 |
| Real Estate Taxes | $1,166 | $0 |
Property Value by Mortgage Status in Trinity
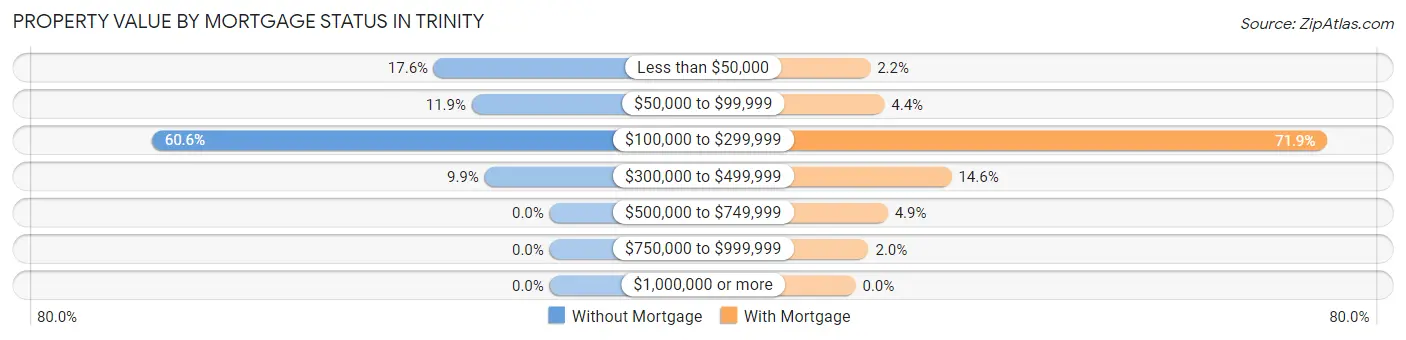
| Property Value | Without Mortgage | With Mortgage |
| Less than $50,000 | 162 (17.6%) | 26 (2.2%) |
| $50,000 to $99,999 | 109 (11.9%) | 51 (4.4%) |
| $100,000 to $299,999 | 557 (60.6%) | 836 (71.9%) |
| $300,000 to $499,999 | 91 (9.9%) | 170 (14.6%) |
| $500,000 to $749,999 | 0 (0.0%) | 57 (4.9%) |
| $750,000 to $999,999 | 0 (0.0%) | 23 (2.0%) |
| $1,000,000 or more | 0 (0.0%) | 0 (0.0%) |
| Total | 919 (100.0%) | 1,163 (100.0%) |
Household Income by Mortgage Status in Trinity
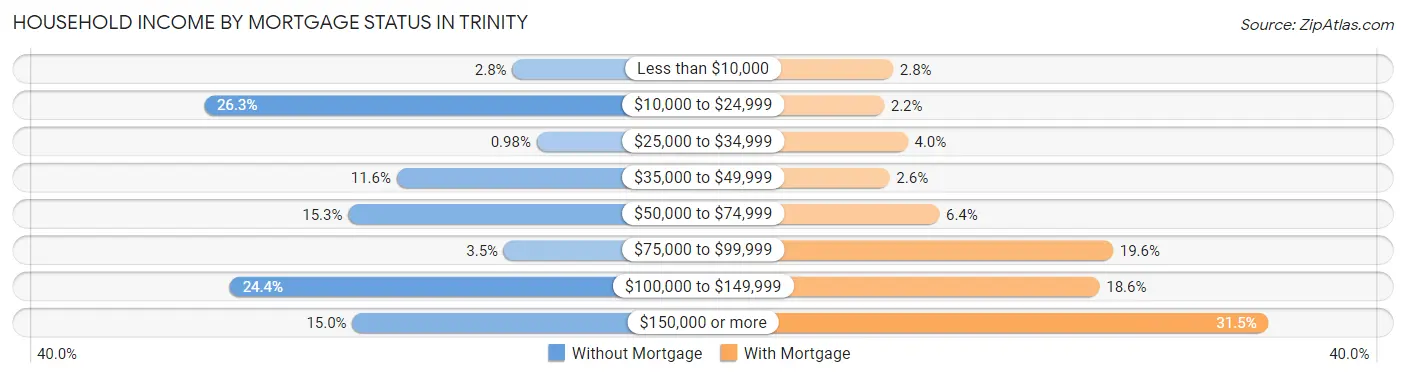
| Household Income | Without Mortgage | With Mortgage |
| Less than $10,000 | 26 (2.8%) | 33 (2.8%) |
| $10,000 to $24,999 | 242 (26.3%) | 25 (2.1%) |
| $25,000 to $34,999 | 9 (1.0%) | 46 (4.0%) |
| $35,000 to $49,999 | 107 (11.6%) | 30 (2.6%) |
| $50,000 to $74,999 | 141 (15.3%) | 74 (6.4%) |
| $75,000 to $99,999 | 32 (3.5%) | 228 (19.6%) |
| $100,000 to $149,999 | 224 (24.4%) | 216 (18.6%) |
| $150,000 or more | 138 (15.0%) | 366 (31.5%) |
| Total | 919 (100.0%) | 1,163 (100.0%) |
Property Value to Household Income Ratio in Trinity
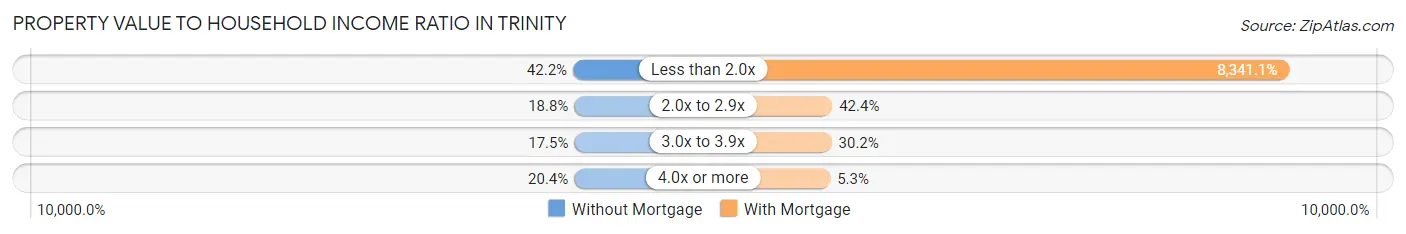
| Value-to-Income Ratio | Without Mortgage | With Mortgage |
| Less than 2.0x | 388 (42.2%) | 97,007 (8,341.1%) |
| 2.0x to 2.9x | 173 (18.8%) | 493 (42.4%) |
| 3.0x to 3.9x | 161 (17.5%) | 351 (30.2%) |
| 4.0x or more | 187 (20.3%) | 62 (5.3%) |
| Total | 919 (100.0%) | 1,163 (100.0%) |
Real Estate Taxes by Mortgage Status in Trinity
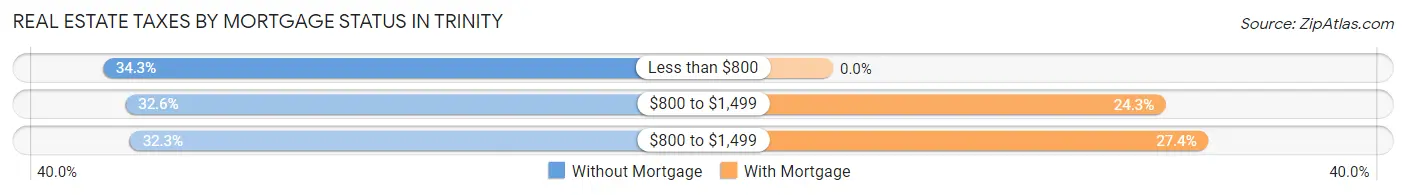
| Property Taxes | Without Mortgage | With Mortgage |
| Less than $800 | 315 (34.3%) | 0 (0.0%) |
| $800 to $1,499 | 300 (32.6%) | 283 (24.3%) |
| $800 to $1,499 | 297 (32.3%) | 319 (27.4%) |
| Total | 919 (100.0%) | 1,163 (100.0%) |
Health & Disability in Trinity
Health Insurance Coverage by Age in Trinity
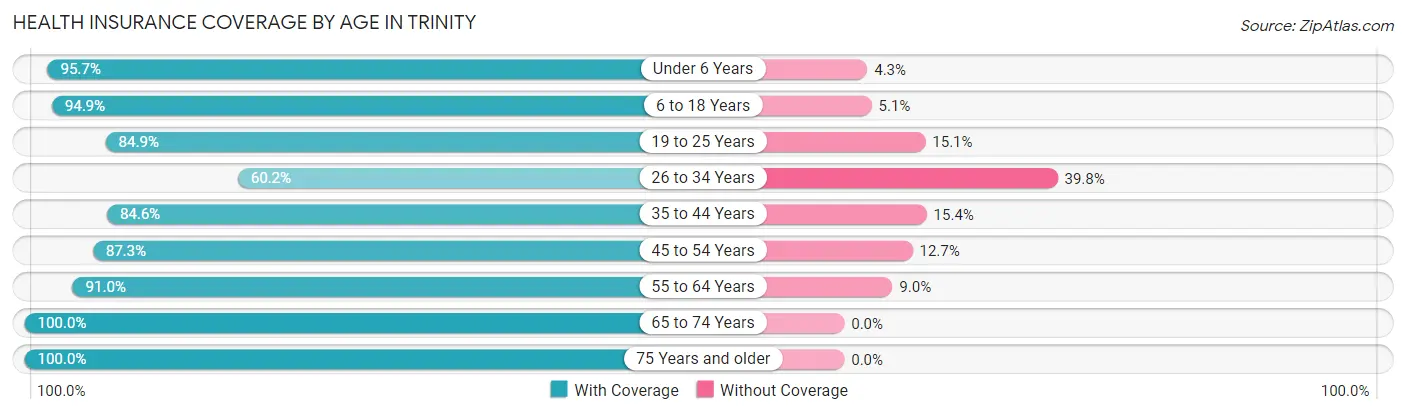
| Age Bracket | With Coverage | Without Coverage |
| Under 6 Years | 290 (95.7%) | 13 (4.3%) |
| 6 to 18 Years | 1,249 (94.9%) | 67 (5.1%) |
| 19 to 25 Years | 477 (84.9%) | 85 (15.1%) |
| 26 to 34 Years | 556 (60.2%) | 367 (39.8%) |
| 35 to 44 Years | 485 (84.6%) | 88 (15.4%) |
| 45 to 54 Years | 604 (87.3%) | 88 (12.7%) |
| 55 to 64 Years | 842 (91.0%) | 83 (9.0%) |
| 65 to 74 Years | 1,277 (100.0%) | 0 (0.0%) |
| 75 Years and older | 441 (100.0%) | 0 (0.0%) |
| Total | 6,221 (88.7%) | 791 (11.3%) |
Health Insurance Coverage by Citizenship Status in Trinity
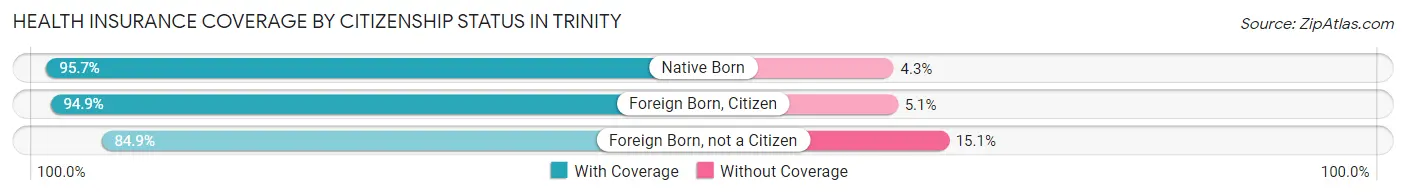
| Citizenship Status | With Coverage | Without Coverage |
| Native Born | 290 (95.7%) | 13 (4.3%) |
| Foreign Born, Citizen | 1,249 (94.9%) | 67 (5.1%) |
| Foreign Born, not a Citizen | 477 (84.9%) | 85 (15.1%) |
Health Insurance Coverage by Household Income in Trinity
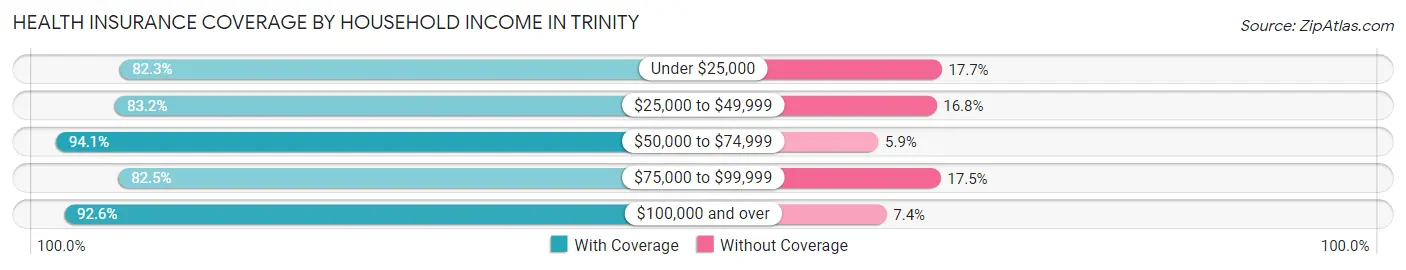
| Household Income | With Coverage | Without Coverage |
| Under $25,000 | 617 (82.3%) | 133 (17.7%) |
| $25,000 to $49,999 | 794 (83.2%) | 160 (16.8%) |
| $50,000 to $74,999 | 1,253 (94.1%) | 78 (5.9%) |
| $75,000 to $99,999 | 1,020 (82.5%) | 217 (17.5%) |
| $100,000 and over | 2,537 (92.6%) | 203 (7.4%) |
Public vs Private Health Insurance Coverage by Age in Trinity
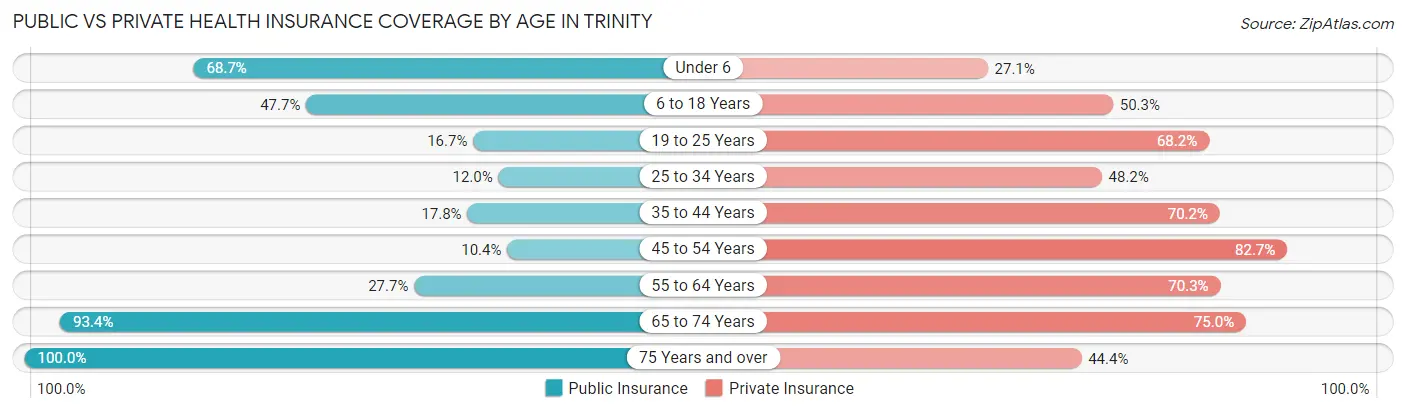
| Age Bracket | Public Insurance | Private Insurance |
| Under 6 | 208 (68.6%) | 82 (27.1%) |
| 6 to 18 Years | 628 (47.7%) | 662 (50.3%) |
| 19 to 25 Years | 94 (16.7%) | 383 (68.1%) |
| 25 to 34 Years | 111 (12.0%) | 445 (48.2%) |
| 35 to 44 Years | 102 (17.8%) | 402 (70.2%) |
| 45 to 54 Years | 72 (10.4%) | 572 (82.7%) |
| 55 to 64 Years | 256 (27.7%) | 650 (70.3%) |
| 65 to 74 Years | 1,193 (93.4%) | 958 (75.0%) |
| 75 Years and over | 441 (100.0%) | 196 (44.4%) |
| Total | 3,105 (44.3%) | 4,350 (62.0%) |
Disability Status by Sex by Age in Trinity
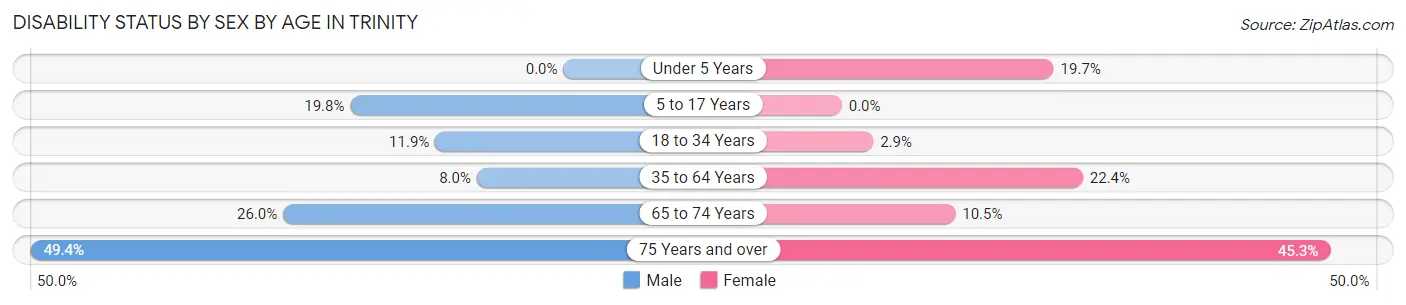
| Age Bracket | Male | Female |
| Under 5 Years | 0 (0.0%) | 35 (19.7%) |
| 5 to 17 Years | 139 (19.8%) | 0 (0.0%) |
| 18 to 34 Years | 97 (11.9%) | 20 (2.9%) |
| 35 to 64 Years | 89 (8.0%) | 242 (22.4%) |
| 65 to 74 Years | 142 (26.0%) | 77 (10.5%) |
| 75 Years and over | 86 (49.4%) | 121 (45.3%) |
Disability Class by Sex by Age in Trinity
Disability Class: Hearing Difficulty
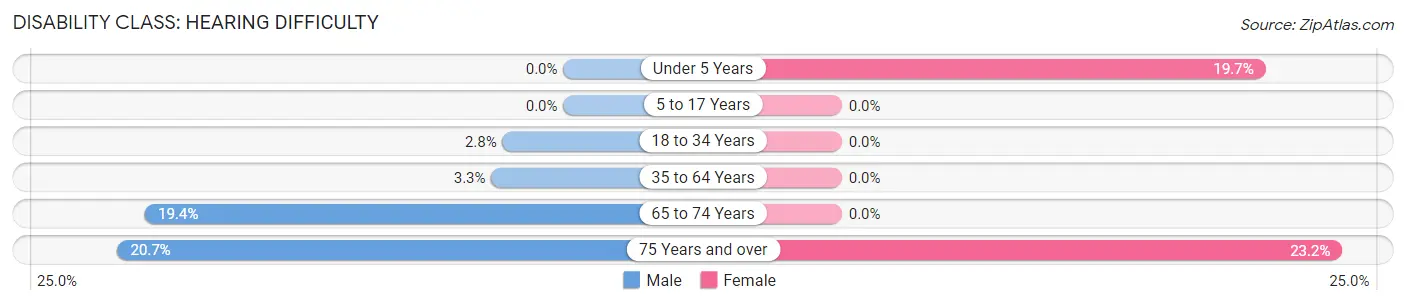
| Age Bracket | Male | Female |
| Under 5 Years | 0 (0.0%) | 35 (19.7%) |
| 5 to 17 Years | 0 (0.0%) | 0 (0.0%) |
| 18 to 34 Years | 23 (2.8%) | 0 (0.0%) |
| 35 to 64 Years | 37 (3.3%) | 0 (0.0%) |
| 65 to 74 Years | 106 (19.4%) | 0 (0.0%) |
| 75 Years and over | 36 (20.7%) | 62 (23.2%) |
Disability Class: Vision Difficulty
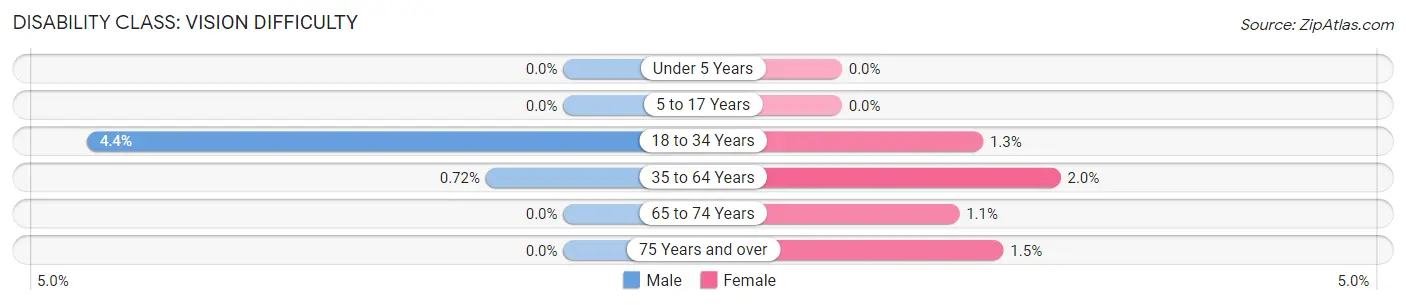
| Age Bracket | Male | Female |
| Under 5 Years | 0 (0.0%) | 0 (0.0%) |
| 5 to 17 Years | 0 (0.0%) | 0 (0.0%) |
| 18 to 34 Years | 36 (4.4%) | 9 (1.3%) |
| 35 to 64 Years | 8 (0.7%) | 22 (2.0%) |
| 65 to 74 Years | 0 (0.0%) | 8 (1.1%) |
| 75 Years and over | 0 (0.0%) | 4 (1.5%) |
Disability Class: Cognitive Difficulty
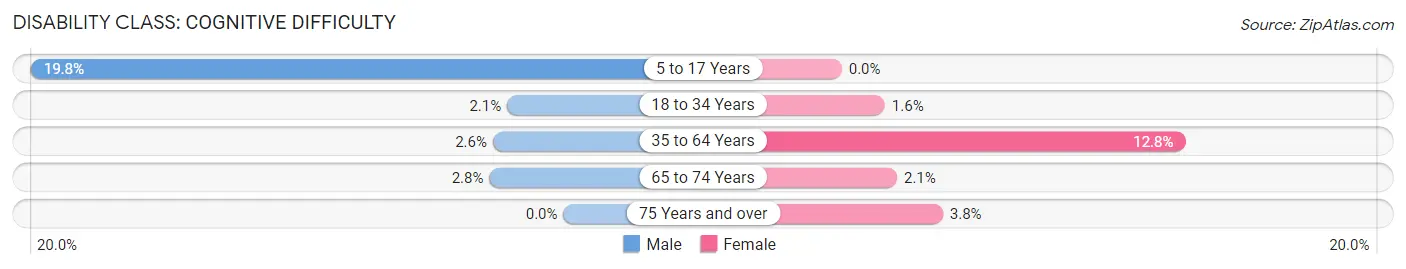
| Age Bracket | Male | Female |
| 5 to 17 Years | 139 (19.8%) | 0 (0.0%) |
| 18 to 34 Years | 17 (2.1%) | 11 (1.6%) |
| 35 to 64 Years | 29 (2.6%) | 138 (12.8%) |
| 65 to 74 Years | 15 (2.8%) | 15 (2.1%) |
| 75 Years and over | 0 (0.0%) | 10 (3.7%) |
Disability Class: Ambulatory Difficulty
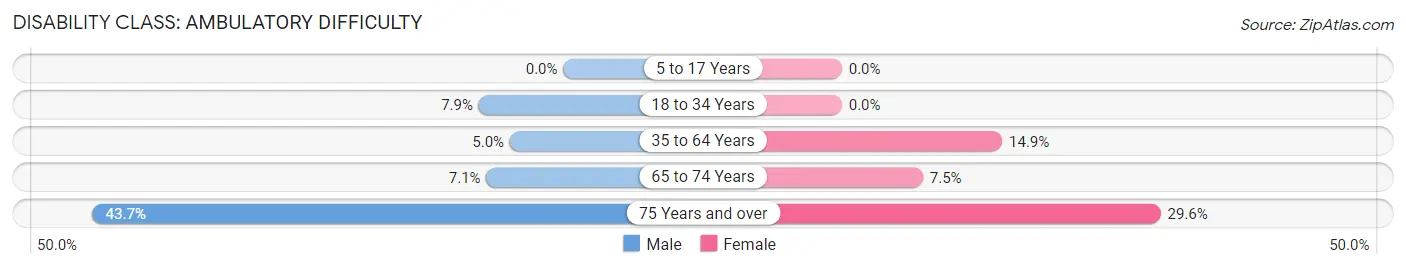
| Age Bracket | Male | Female |
| 5 to 17 Years | 0 (0.0%) | 0 (0.0%) |
| 18 to 34 Years | 64 (7.9%) | 0 (0.0%) |
| 35 to 64 Years | 55 (5.0%) | 161 (14.9%) |
| 65 to 74 Years | 39 (7.1%) | 55 (7.5%) |
| 75 Years and over | 76 (43.7%) | 79 (29.6%) |
Disability Class: Self-Care Difficulty
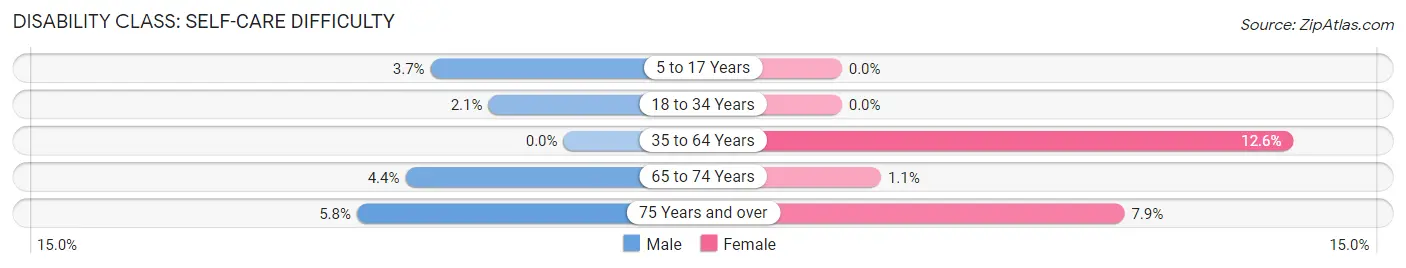
| Age Bracket | Male | Female |
| 5 to 17 Years | 26 (3.7%) | 0 (0.0%) |
| 18 to 34 Years | 17 (2.1%) | 0 (0.0%) |
| 35 to 64 Years | 0 (0.0%) | 136 (12.6%) |
| 65 to 74 Years | 24 (4.4%) | 8 (1.1%) |
| 75 Years and over | 10 (5.8%) | 21 (7.9%) |
Technology Access in Trinity
Computing Device Access in Trinity
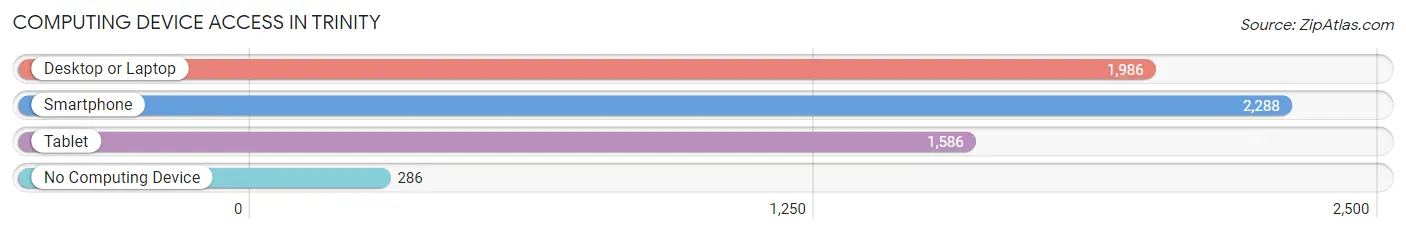
| Device Type | # Households | % Households |
| Desktop or Laptop | 1,986 | 74.2% |
| Smartphone | 2,288 | 85.5% |
| Tablet | 1,586 | 59.3% |
| No Computing Device | 286 | 10.7% |
| Total | 2,676 | 100.0% |
Internet Access in Trinity
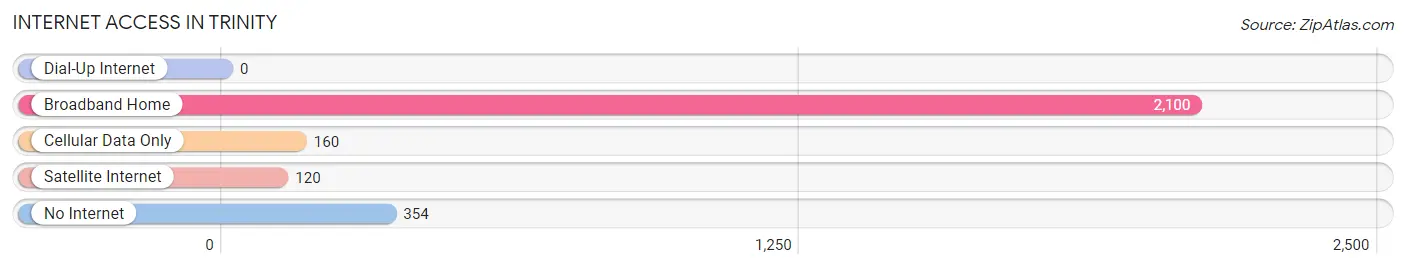
| Internet Type | # Households | % Households |
| Dial-Up Internet | 0 | 0.0% |
| Broadband Home | 2,100 | 78.5% |
| Cellular Data Only | 160 | 6.0% |
| Satellite Internet | 120 | 4.5% |
| No Internet | 354 | 13.2% |
| Total | 2,676 | 100.0% |
Trinity Summary
Trinity, North Carolina is a small town located in Randolph County, North Carolina. It is situated in the foothills of the Blue Ridge Mountains, about 25 miles south of Greensboro. The town was founded in 1845 and has a population of approximately 1,500 people.
Geography
Trinity is located in the Piedmont region of North Carolina, which is characterized by rolling hills and valleys. The town is situated in the Uwharrie Mountains, which are part of the Appalachian Mountains. The town is located at an elevation of 890 feet above sea level. The town is located on the banks of the Deep River, which is a tributary of the Cape Fear River. The town is surrounded by forests and is home to a variety of wildlife, including deer, wild turkeys, and black bears.
Economy
Trinity’s economy is largely based on agriculture and manufacturing. The town is home to several small businesses, including a furniture factory, a sawmill, and a feed mill. The town is also home to several farms, which produce a variety of crops, including corn, soybeans, and tobacco. The town is also home to several small retail stores, including a grocery store, a hardware store, and a pharmacy.
Demographics
As of the 2010 census, the population of Trinity was 1,521. The racial makeup of the town was 94.3% White, 2.7% African American, 0.3% Native American, 0.3% Asian, 0.1% Pacific Islander, 1.2% from other races, and 1.3% from two or more races. Hispanic or Latino of any race were 2.7% of the population.
The median income for a household in Trinity was $35,938, and the median income for a family was $41,250. The per capita income for the town was $17,845. About 11.2% of families and 14.2% of the population were below the poverty line, including 18.2% of those under age 18 and 11.2% of those age 65 or over.
History
Trinity was founded in 1845 by a group of settlers from Randolph County. The town was named after the Trinity Church, which was built in 1846. The town was incorporated in 1887 and has remained a small, rural community ever since. The town was home to several mills, including a cotton mill, a sawmill, and a gristmill. The town was also home to several stores, including a general store, a drug store, and a hardware store.
Trinity has a rich history of education. The town was home to several schools, including the Trinity Academy, which was founded in 1845. The school was later renamed the Trinity High School and was the first public high school in Randolph County. The school was closed in the 1970s and is now a museum.
Trinity is also home to several historic sites, including the Trinity Presbyterian Church, which was built in 1845, and the Trinity United Methodist Church, which was built in 1871. The town is also home to several historic homes, including the John A. and Mary E. Smith House, which was built in 1875, and the William and Mary Smith House, which was built in 1885.
Common Questions
What is Per Capita Income in Trinity?
Per Capita income in Trinity is $32,062.
What is the Median Family Income in Trinity?
Median Family Income in Trinity is $94,091.
What is the Median Household income in Trinity?
Median Household Income in Trinity is $70,368.
What is Income or Wage Gap in Trinity?
Income or Wage Gap in Trinity is 28.0%.
Women in Trinity earn 72.0 cents for every dollar earned by a man.
What is Inequality or Gini Index in Trinity?
Inequality or Gini Index in Trinity is 0.39.
What is the Total Population of Trinity?
Total Population of Trinity is 7,012.
What is the Total Male Population of Trinity?
Total Male Population of Trinity is 3,467.
What is the Total Female Population of Trinity?
Total Female Population of Trinity is 3,545.
What is the Ratio of Males per 100 Females in Trinity?
There are 97.80 Males per 100 Females in Trinity.
What is the Ratio of Females per 100 Males in Trinity?
There are 102.25 Females per 100 Males in Trinity.
What is the Median Population Age in Trinity?
Median Population Age in Trinity is 42.2 Years.
What is the Average Family Size in Trinity
Average Family Size in Trinity is 3.1 People.
What is the Average Household Size in Trinity
Average Household Size in Trinity is 2.6 People.
How Large is the Labor Force in Trinity?
There are 3,481 People in the Labor Forcein in Trinity.
What is the Percentage of People in the Labor Force in Trinity?
62.0% of People are in the Labor Force in Trinity.
What is the Unemployment Rate in Trinity?
Unemployment Rate in Trinity is 3.6%.