Kernersville, NC Map & Demographics
Kernersville Map
Kernersville Overview
$38,019
PER CAPITA INCOME
$93,786
AVG FAMILY INCOME
$66,151
AVG HOUSEHOLD INCOME
0.8%
WAGE / INCOME GAP [ % ]
99.2¢/ $1
WAGE / INCOME GAP [ $ ]
$7,748
FAMILY INCOME DEFICIT
0.45
INEQUALITY / GINI INDEX
27,177
TOTAL POPULATION
12,795
MALE POPULATION
14,382
FEMALE POPULATION
88.97
MALES / 100 FEMALES
112.40
FEMALES / 100 MALES
39.0
MEDIAN AGE
3.0
AVG FAMILY SIZE
2.3
AVG HOUSEHOLD SIZE
14,733
LABOR FORCE [ PEOPLE ]
66.0%
PERCENT IN LABOR FORCE
3.0%
UNEMPLOYMENT RATE
Kernersville Zip Codes
Kernersville Area Codes
Income in Kernersville
Income Overview in Kernersville
Per Capita Income in Kernersville is $38,019, while median incomes of families and households are $93,786 and $66,151 respectively.
| Characteristic | Number | Measure |
| Per Capita Income | 27,177 | $38,019 |
| Median Family Income | 6,704 | $93,786 |
| Mean Family Income | 6,704 | $111,848 |
| Median Household Income | 11,953 | $66,151 |
| Mean Household Income | 11,953 | $84,809 |
| Income Deficit | 6,704 | $7,748 |
| Wage / Income Gap (%) | 27,177 | 0.78% |
| Wage / Income Gap ($) | 27,177 | 99.22¢ per $1 |
| Gini / Inequality Index | 27,177 | 0.45 |
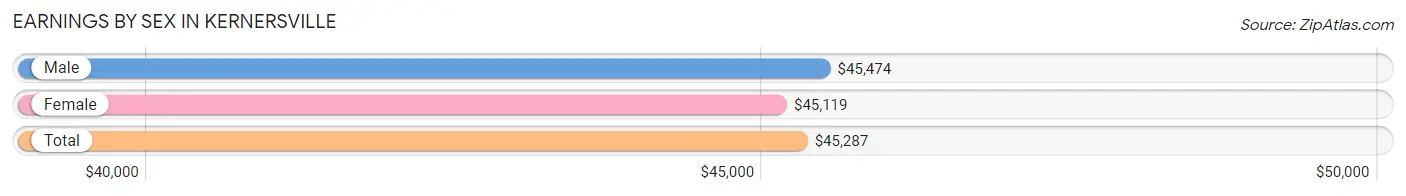
Earnings by Sex in Kernersville
Average Earnings in Kernersville are $45,287, $45,474 for men and $45,119 for women, a difference of 0.8%.
| Sex | Number | Average Earnings |
| Male | 8,297 (54.0%) | $45,474 |
| Female | 7,064 (46.0%) | $45,119 |
| Total | 15,361 (100.0%) | $45,287 |
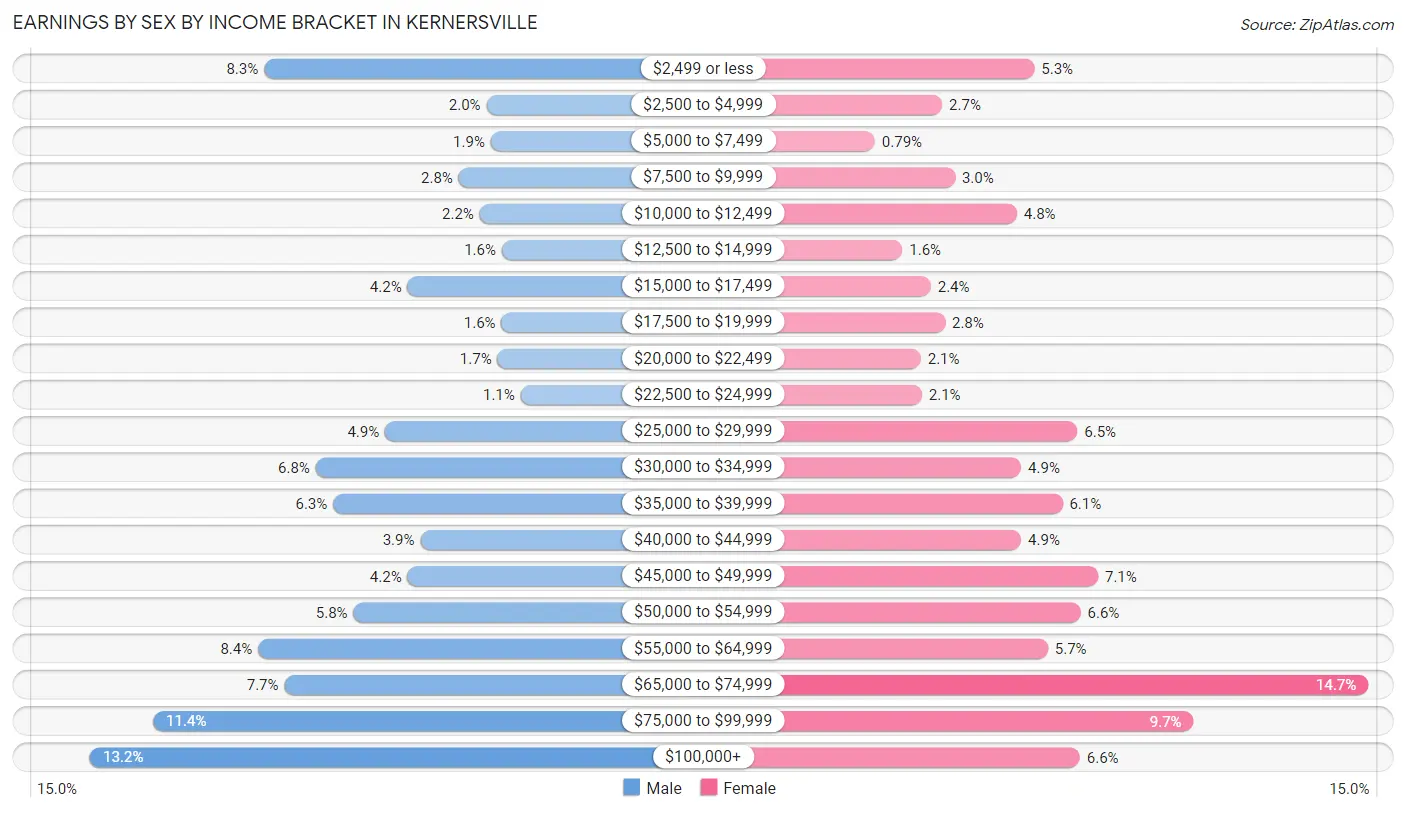
Earnings by Sex by Income Bracket in Kernersville
The most common earnings brackets in Kernersville are $100,000+ for men (1,092 | 13.2%) and $65,000 to $74,999 for women (1,035 | 14.6%).
| Income | Male | Female |
| $2,499 or less | 686 (8.3%) | 372 (5.3%) |
| $2,500 to $4,999 | 168 (2.0%) | 189 (2.7%) |
| $5,000 to $7,499 | 158 (1.9%) | 56 (0.8%) |
| $7,500 to $9,999 | 232 (2.8%) | 215 (3.0%) |
| $10,000 to $12,499 | 183 (2.2%) | 338 (4.8%) |
| $12,500 to $14,999 | 132 (1.6%) | 110 (1.6%) |
| $15,000 to $17,499 | 352 (4.2%) | 167 (2.4%) |
| $17,500 to $19,999 | 133 (1.6%) | 195 (2.8%) |
| $20,000 to $22,499 | 142 (1.7%) | 147 (2.1%) |
| $22,500 to $24,999 | 88 (1.1%) | 149 (2.1%) |
| $25,000 to $29,999 | 404 (4.9%) | 458 (6.5%) |
| $30,000 to $34,999 | 566 (6.8%) | 346 (4.9%) |
| $35,000 to $39,999 | 525 (6.3%) | 428 (6.1%) |
| $40,000 to $44,999 | 322 (3.9%) | 346 (4.9%) |
| $45,000 to $49,999 | 352 (4.2%) | 499 (7.1%) |
| $50,000 to $54,999 | 478 (5.8%) | 464 (6.6%) |
| $55,000 to $64,999 | 700 (8.4%) | 399 (5.7%) |
| $65,000 to $74,999 | 639 (7.7%) | 1,035 (14.6%) |
| $75,000 to $99,999 | 945 (11.4%) | 688 (9.7%) |
| $100,000+ | 1,092 (13.2%) | 463 (6.6%) |
| Total | 8,297 (100.0%) | 7,064 (100.0%) |
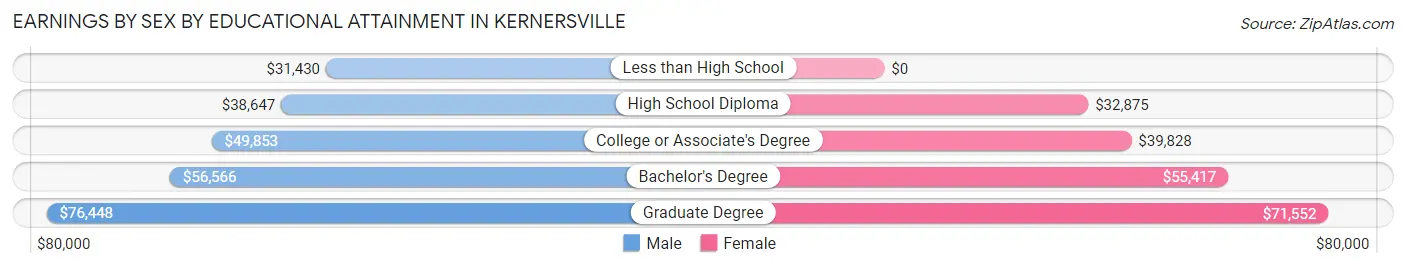
Earnings by Sex by Educational Attainment in Kernersville
Average earnings in Kernersville are $52,410 for men and $49,753 for women, a difference of 5.1%. Men with an educational attainment of graduate degree enjoy the highest average annual earnings of $76,448, while those with less than high school education earn the least with $31,430. Women with an educational attainment of graduate degree earn the most with the average annual earnings of $71,552, while those with high school diploma education have the smallest earnings of $32,875.
| Educational Attainment | Male Income | Female Income |
| Less than High School | $31,430 | $0 |
| High School Diploma | $38,647 | $32,875 |
| College or Associate's Degree | $49,853 | $39,828 |
| Bachelor's Degree | $56,566 | $55,417 |
| Graduate Degree | $76,448 | $71,552 |
| Total | $52,410 | $49,753 |
Family Income in Kernersville
Family Income Brackets in Kernersville
According to the Kernersville family income data, there are 1,562 families falling into the $100,000 to $149,999 income range, which is the most common income bracket and makes up 23.3% of all families. Conversely, the less than $10,000 income bracket is the least frequent group with only 94 families (1.4%) belonging to this category.
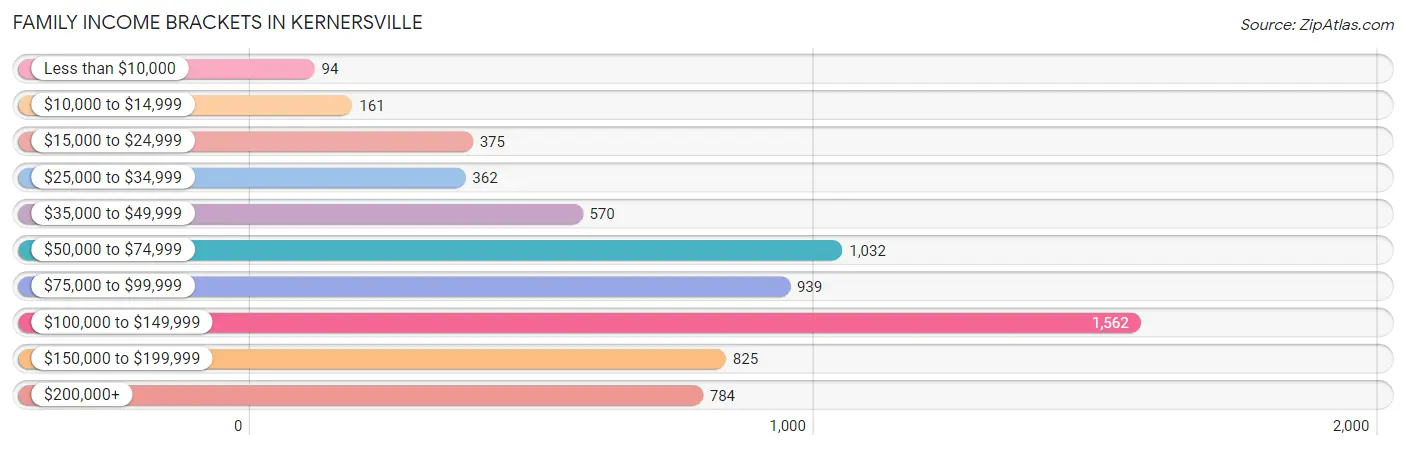
| Income Bracket | # Families | % Families |
| Less than $10,000 | 94 | 1.4% |
| $10,000 to $14,999 | 161 | 2.4% |
| $15,000 to $24,999 | 375 | 5.6% |
| $25,000 to $34,999 | 362 | 5.4% |
| $35,000 to $49,999 | 570 | 8.5% |
| $50,000 to $74,999 | 1,032 | 15.4% |
| $75,000 to $99,999 | 939 | 14.0% |
| $100,000 to $149,999 | 1,562 | 23.3% |
| $150,000 to $199,999 | 825 | 12.3% |
| $200,000+ | 784 | 11.7% |
Family Income by Famaliy Size in Kernersville
5-person families (324 | 4.8%) account for the highest median family income in Kernersville with $121,429 per family, while 2-person families (3,424 | 51.1%) have the highest median income of $42,140 per family member.
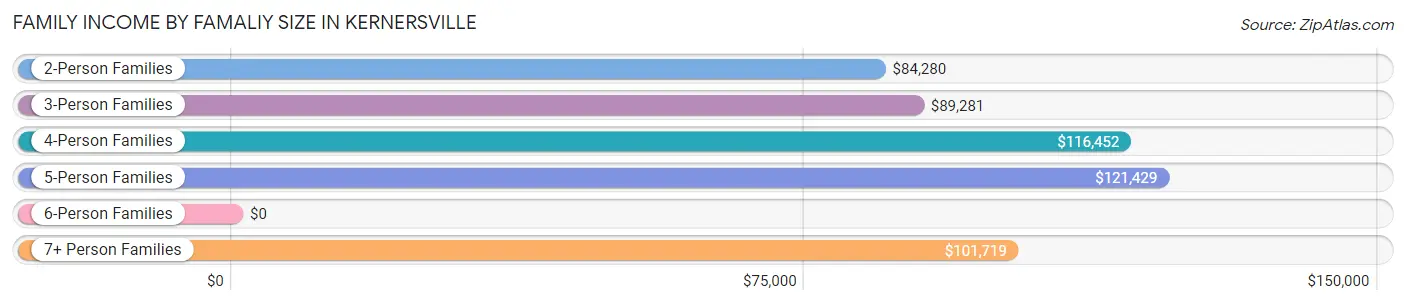
| Income Bracket | # Families | Median Income |
| 2-Person Families | 3,424 (51.1%) | $84,280 |
| 3-Person Families | 1,413 (21.1%) | $89,281 |
| 4-Person Families | 1,400 (20.9%) | $116,452 |
| 5-Person Families | 324 (4.8%) | $121,429 |
| 6-Person Families | 58 (0.9%) | $0 |
| 7+ Person Families | 85 (1.3%) | $101,719 |
| Total | 6,704 (100.0%) | $93,786 |
Family Income by Number of Earners in Kernersville
The median family income in Kernersville is $93,786, with families comprising 3+ earners (682) having the highest median family income of $150,481, while families with no earners (1,039) have the lowest median family income of $50,559, accounting for 10.2% and 15.5% of families, respectively.
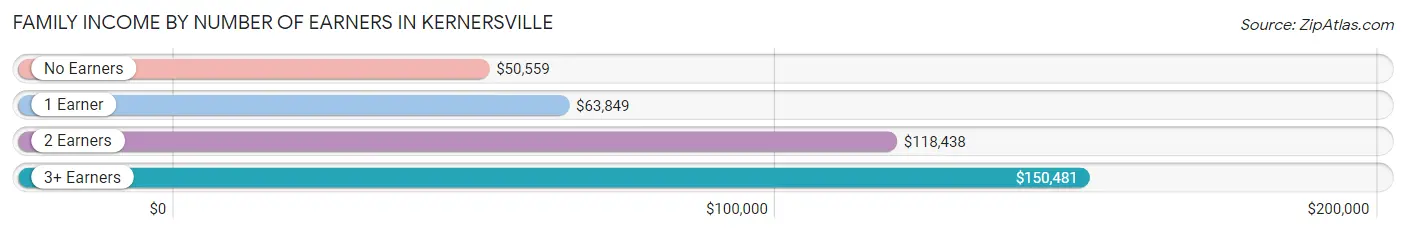
| Number of Earners | # Families | Median Income |
| No Earners | 1,039 (15.5%) | $50,559 |
| 1 Earner | 1,720 (25.7%) | $63,849 |
| 2 Earners | 3,263 (48.7%) | $118,438 |
| 3+ Earners | 682 (10.2%) | $150,481 |
| Total | 6,704 (100.0%) | $93,786 |
Household Income in Kernersville
Household Income Brackets in Kernersville
With 2,080 households falling in the category, the $50,000 to $74,999 income range is the most frequent in Kernersville, accounting for 17.4% of all households. In contrast, only 538 households (4.5%) fall into the less than $10,000 income bracket, making it the least populous group.
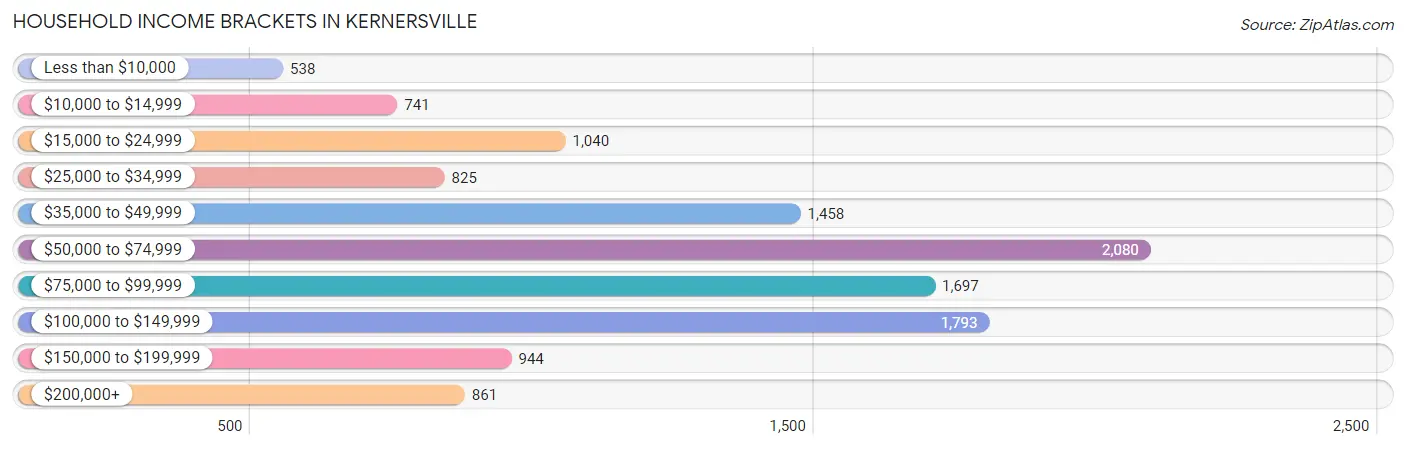
| Income Bracket | # Households | % Households |
| Less than $10,000 | 538 | 4.5% |
| $10,000 to $14,999 | 741 | 6.2% |
| $15,000 to $24,999 | 1,040 | 8.7% |
| $25,000 to $34,999 | 825 | 6.9% |
| $35,000 to $49,999 | 1,458 | 12.2% |
| $50,000 to $74,999 | 2,080 | 17.4% |
| $75,000 to $99,999 | 1,697 | 14.2% |
| $100,000 to $149,999 | 1,793 | 15.0% |
| $150,000 to $199,999 | 944 | 7.9% |
| $200,000+ | 861 | 7.2% |
Household Income by Householder Age in Kernersville
The median household income in Kernersville is $66,151, with the highest median household income of $89,860 found in the 45 to 64 years age bracket for the primary householder. A total of 3,797 households (31.8%) fall into this category. Meanwhile, the 65+ years age bracket for the primary householder has the lowest median household income of $39,918, with 3,328 households (27.8%) in this group.
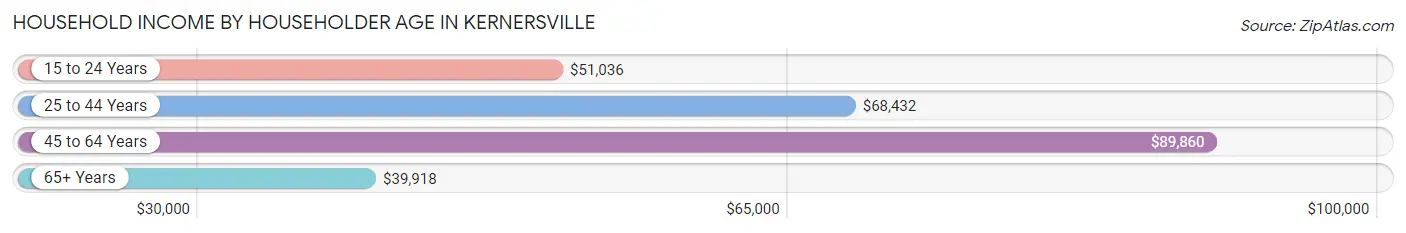
| Income Bracket | # Households | Median Income |
| 15 to 24 Years | 667 (5.6%) | $51,036 |
| 25 to 44 Years | 4,161 (34.8%) | $68,432 |
| 45 to 64 Years | 3,797 (31.8%) | $89,860 |
| 65+ Years | 3,328 (27.8%) | $39,918 |
| Total | 11,953 (100.0%) | $66,151 |
Poverty in Kernersville
Income Below Poverty by Sex and Age in Kernersville
With 9.0% poverty level for males and 15.0% for females among the residents of Kernersville, 16 and 17 year old males and 12 to 14 year old females are the most vulnerable to poverty, with 59 males (20.8%) and 264 females (40.4%) in their respective age groups living below the poverty level.
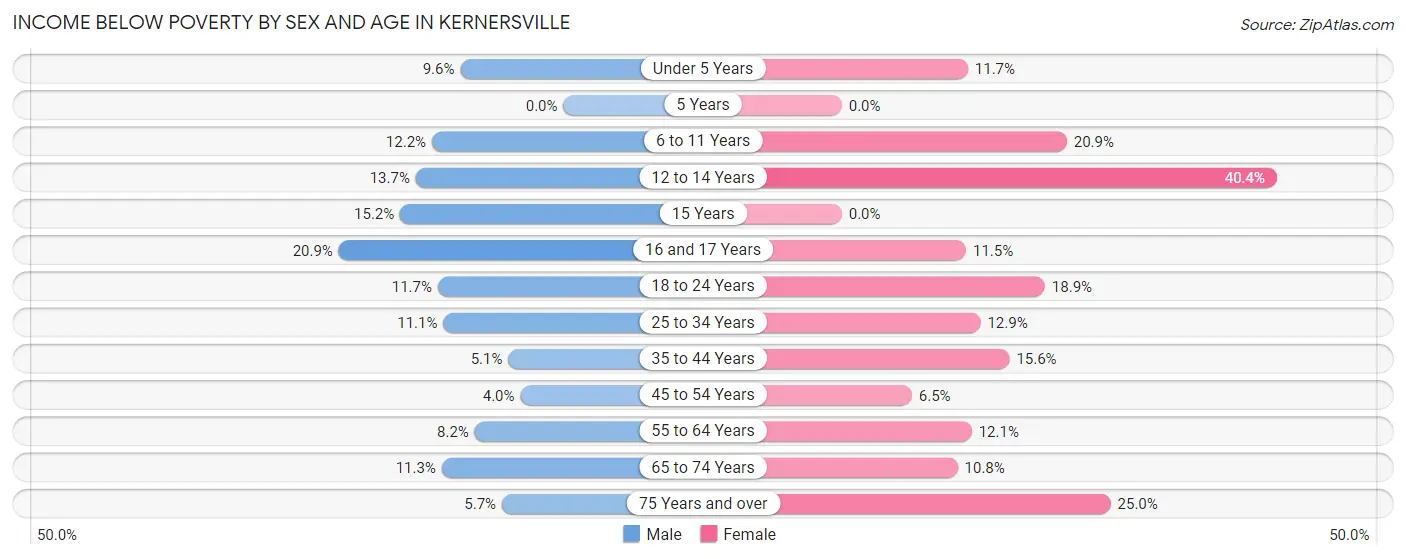
| Age Bracket | Male | Female |
| Under 5 Years | 58 (9.6%) | 100 (11.7%) |
| 5 Years | 0 (0.0%) | 0 (0.0%) |
| 6 to 11 Years | 105 (12.2%) | 213 (20.9%) |
| 12 to 14 Years | 57 (13.7%) | 264 (40.4%) |
| 15 Years | 10 (15.1%) | 0 (0.0%) |
| 16 and 17 Years | 59 (20.8%) | 64 (11.5%) |
| 18 to 24 Years | 169 (11.7%) | 253 (18.9%) |
| 25 to 34 Years | 222 (11.1%) | 220 (12.9%) |
| 35 to 44 Years | 89 (5.1%) | 267 (15.6%) |
| 45 to 54 Years | 70 (4.0%) | 109 (6.5%) |
| 55 to 64 Years | 132 (8.2%) | 197 (12.1%) |
| 65 to 74 Years | 137 (11.3%) | 207 (10.7%) |
| 75 Years and over | 33 (5.7%) | 246 (24.9%) |
| Total | 1,141 (9.0%) | 2,140 (15.0%) |
Income Above Poverty by Sex and Age in Kernersville
According to the poverty statistics in Kernersville, males aged 5 years and females aged 5 years are the age groups that are most secure financially, with 100.0% of males and 100.0% of females in these age groups living above the poverty line.
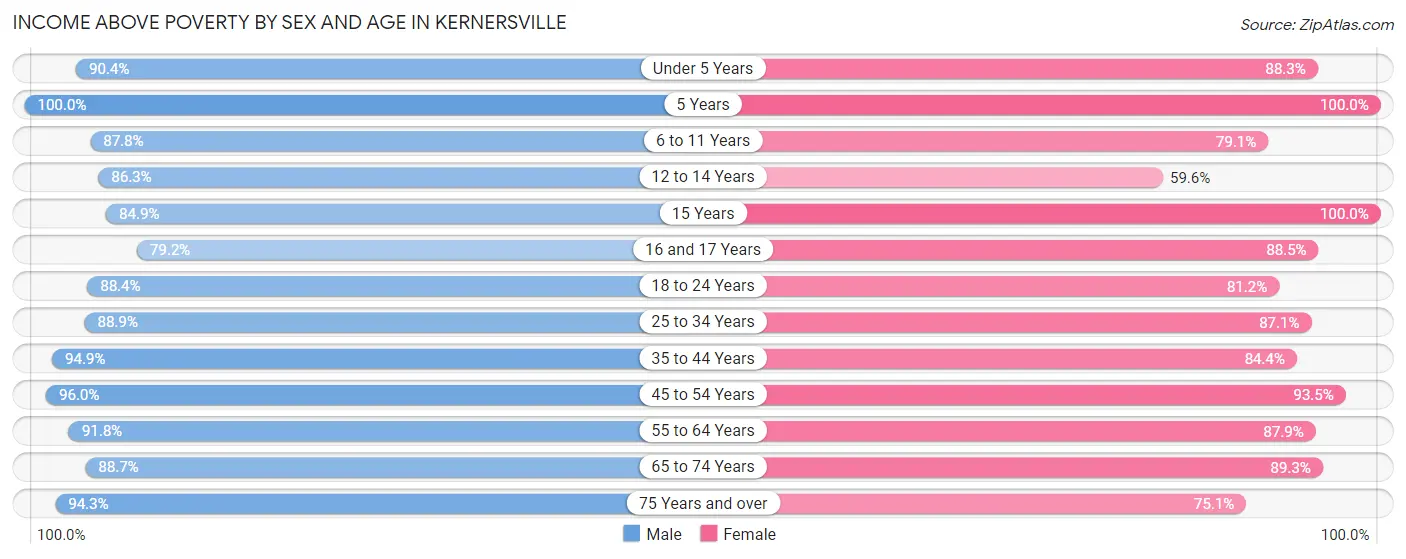
| Age Bracket | Male | Female |
| Under 5 Years | 549 (90.4%) | 755 (88.3%) |
| 5 Years | 116 (100.0%) | 102 (100.0%) |
| 6 to 11 Years | 756 (87.8%) | 807 (79.1%) |
| 12 to 14 Years | 359 (86.3%) | 390 (59.6%) |
| 15 Years | 56 (84.9%) | 96 (100.0%) |
| 16 and 17 Years | 224 (79.1%) | 491 (88.5%) |
| 18 to 24 Years | 1,282 (88.3%) | 1,089 (81.1%) |
| 25 to 34 Years | 1,771 (88.9%) | 1,489 (87.1%) |
| 35 to 44 Years | 1,654 (94.9%) | 1,449 (84.4%) |
| 45 to 54 Years | 1,683 (96.0%) | 1,569 (93.5%) |
| 55 to 64 Years | 1,472 (91.8%) | 1,436 (87.9%) |
| 65 to 74 Years | 1,077 (88.7%) | 1,718 (89.2%) |
| 75 Years and over | 546 (94.3%) | 740 (75.0%) |
| Total | 11,545 (91.0%) | 12,131 (85.0%) |
Income Below Poverty Among Married-Couple Families in Kernersville
The poverty statistics for married-couple families in Kernersville show that 4.5% or 232 of the total 5,097 families live below the poverty line. Families with no children have the highest poverty rate of 4.9%, comprising of 164 families. On the other hand, families with 3 or 4 children have the lowest poverty rate of 0.0%, which includes 0 families.
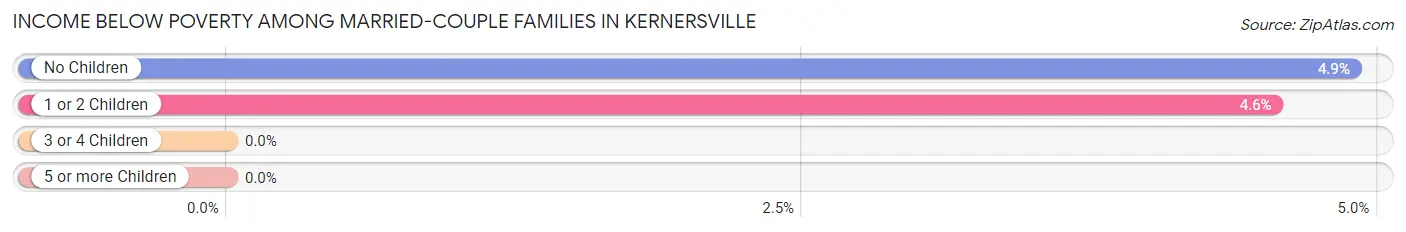
| Children | Above Poverty | Below Poverty |
| No Children | 3,189 (95.1%) | 164 (4.9%) |
| 1 or 2 Children | 1,427 (95.5%) | 68 (4.5%) |
| 3 or 4 Children | 249 (100.0%) | 0 (0.0%) |
| 5 or more Children | 0 (0.0%) | 0 (0.0%) |
| Total | 4,865 (95.5%) | 232 (4.5%) |
Income Below Poverty Among Single-Parent Households in Kernersville
According to the poverty data in Kernersville, 17.4% or 82 single-father households and 17.8% or 202 single-mother households are living below the poverty line. Among single-father households, those with 5 or more children have the highest poverty rate, with 26 households (100.0%) experiencing poverty. Likewise, among single-mother households, those with 1 or 2 children have the highest poverty rate, with 154 households (23.7%) falling below the poverty line.
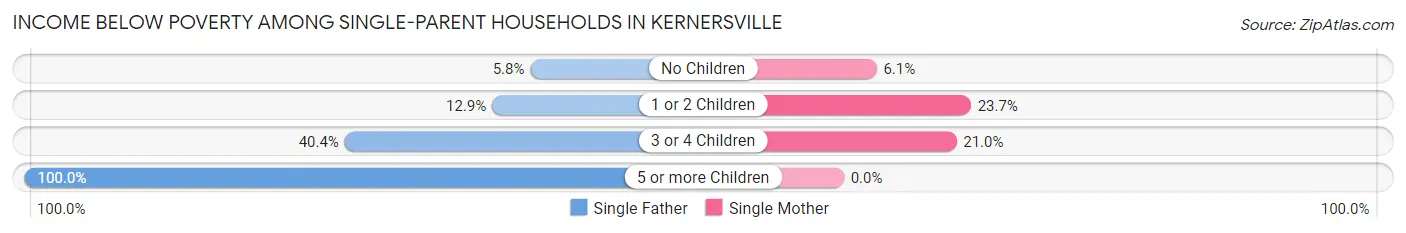
| Children | Single Father | Single Mother |
| No Children | 13 (5.8%) | 22 (6.1%) |
| 1 or 2 Children | 22 (12.9%) | 154 (23.7%) |
| 3 or 4 Children | 21 (40.4%) | 26 (21.0%) |
| 5 or more Children | 26 (100.0%) | 0 (0.0%) |
| Total | 82 (17.4%) | 202 (17.8%) |
Income Below Poverty Among Married-Couple vs Single-Parent Households in Kernersville
The poverty data for Kernersville shows that 232 of the married-couple family households (4.5%) and 284 of the single-parent households (17.7%) are living below the poverty level. Within the married-couple family households, those with no children have the highest poverty rate, with 164 households (4.9%) falling below the poverty line. Among the single-parent households, those with 5 or more children have the highest poverty rate, with 26 household (100.0%) living below poverty.
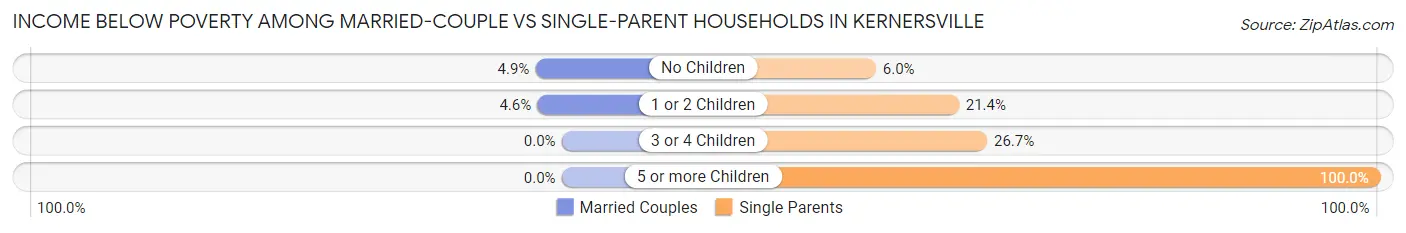
| Children | Married-Couple Families | Single-Parent Households |
| No Children | 164 (4.9%) | 35 (6.0%) |
| 1 or 2 Children | 68 (4.5%) | 176 (21.4%) |
| 3 or 4 Children | 0 (0.0%) | 47 (26.7%) |
| 5 or more Children | 0 (0.0%) | 26 (100.0%) |
| Total | 232 (4.5%) | 284 (17.7%) |
Race in Kernersville
The most populous races in Kernersville are White / Caucasian (19,545 | 71.9%), Black / African American (4,628 | 17.0%), and Hispanic or Latino (3,105 | 11.4%).
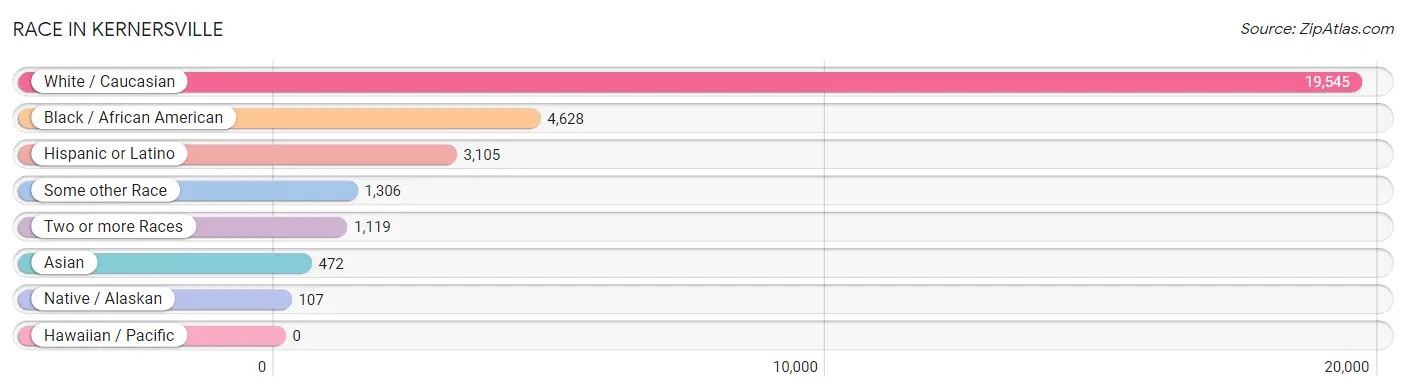
| Race | # Population | % Population |
| Asian | 472 | 1.7% |
| Black / African American | 4,628 | 17.0% |
| Hawaiian / Pacific | 0 | 0.0% |
| Hispanic or Latino | 3,105 | 11.4% |
| Native / Alaskan | 107 | 0.4% |
| White / Caucasian | 19,545 | 71.9% |
| Two or more Races | 1,119 | 4.1% |
| Some other Race | 1,306 | 4.8% |
| Total | 27,177 | 100.0% |
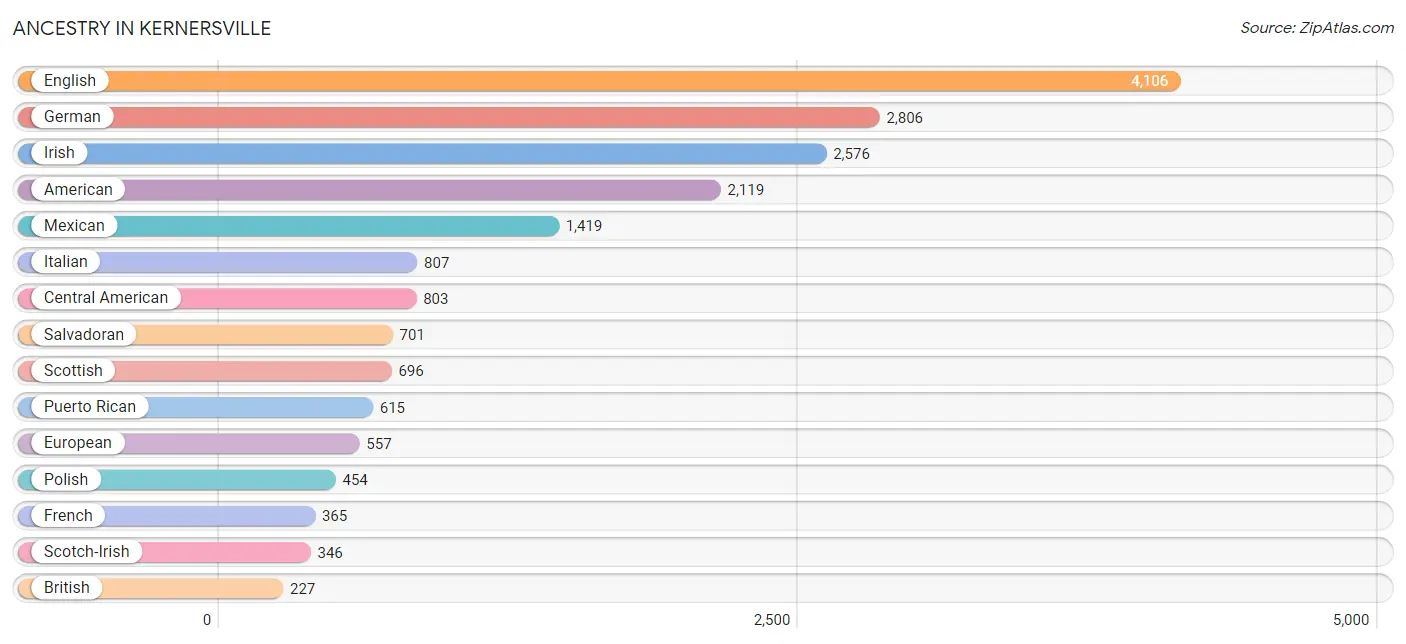
Ancestry in Kernersville
The most populous ancestries reported in Kernersville are English (4,106 | 15.1%), German (2,806 | 10.3%), Irish (2,576 | 9.5%), American (2,119 | 7.8%), and Mexican (1,419 | 5.2%), together accounting for 47.9% of all Kernersville residents.
| Ancestry | # Population | % Population |
| African | 86 | 0.3% |
| American | 2,119 | 7.8% |
| Arab | 12 | 0.0% |
| Armenian | 11 | 0.0% |
| Assyrian / Chaldean / Syriac | 27 | 0.1% |
| Austrian | 36 | 0.1% |
| Belgian | 10 | 0.0% |
| Bhutanese | 58 | 0.2% |
| Blackfeet | 8 | 0.0% |
| British | 227 | 0.8% |
| Burmese | 55 | 0.2% |
| Cajun | 9 | 0.0% |
| Canadian | 5 | 0.0% |
| Central American | 803 | 2.9% |
| Central American Indian | 92 | 0.3% |
| Cherokee | 110 | 0.4% |
| Choctaw | 20 | 0.1% |
| Colombian | 35 | 0.1% |
| Costa Rican | 18 | 0.1% |
| Croatian | 18 | 0.1% |
| Cuban | 72 | 0.3% |
| Czech | 8 | 0.0% |
| Czechoslovakian | 1 | 0.0% |
| Danish | 85 | 0.3% |
| Dominican | 21 | 0.1% |
| Dutch | 86 | 0.3% |
| Eastern European | 1 | 0.0% |
| Ecuadorian | 22 | 0.1% |
| English | 4,106 | 15.1% |
| Ethiopian | 30 | 0.1% |
| European | 557 | 2.1% |
| Finnish | 28 | 0.1% |
| French | 365 | 1.3% |
| French Canadian | 52 | 0.2% |
| German | 2,806 | 10.3% |
| German Russian | 33 | 0.1% |
| Greek | 22 | 0.1% |
| Guatemalan | 33 | 0.1% |
| Honduran | 28 | 0.1% |
| Hungarian | 59 | 0.2% |
| Indian (Asian) | 122 | 0.4% |
| Iranian | 15 | 0.1% |
| Irish | 2,576 | 9.5% |
| Iroquois | 1 | 0.0% |
| Italian | 807 | 3.0% |
| Jamaican | 11 | 0.0% |
| Korean | 46 | 0.2% |
| Latvian | 25 | 0.1% |
| Lithuanian | 15 | 0.1% |
| Lumbee | 5 | 0.0% |
| Mexican | 1,419 | 5.2% |
| Mexican American Indian | 2 | 0.0% |
| Mongolian | 40 | 0.2% |
| Native Hawaiian | 22 | 0.1% |
| Northern European | 81 | 0.3% |
| Norwegian | 152 | 0.6% |
| Palestinian | 12 | 0.0% |
| Panamanian | 23 | 0.1% |
| Polish | 454 | 1.7% |
| Portuguese | 34 | 0.1% |
| Puerto Rican | 615 | 2.3% |
| Russian | 82 | 0.3% |
| Salvadoran | 701 | 2.6% |
| Scandinavian | 37 | 0.1% |
| Scotch-Irish | 346 | 1.3% |
| Scottish | 696 | 2.6% |
| Slavic | 41 | 0.2% |
| Slovak | 17 | 0.1% |
| Slovene | 24 | 0.1% |
| South American | 57 | 0.2% |
| Spaniard | 70 | 0.3% |
| Spanish | 48 | 0.2% |
| Sri Lankan | 47 | 0.2% |
| Subsaharan African | 132 | 0.5% |
| Swedish | 93 | 0.3% |
| Swiss | 20 | 0.1% |
| Thai | 94 | 0.4% |
| Welsh | 184 | 0.7% | View All 78 Rows |
Immigrants in Kernersville
The most numerous immigrant groups reported in Kernersville came from Latin America (862 | 3.2%), Central America (735 | 2.7%), Asia (426 | 1.6%), El Salvador (368 | 1.3%), and Europe (348 | 1.3%), together accounting for 10.1% of all Kernersville residents.
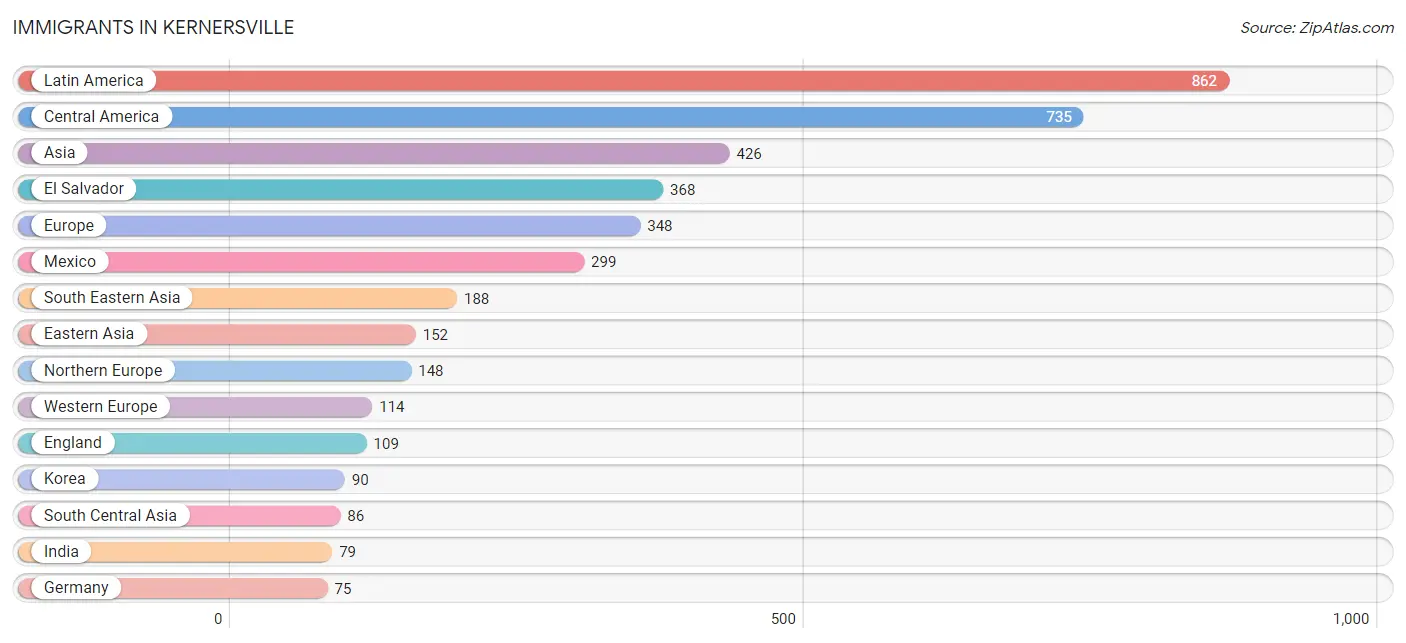
| Immigration Origin | # Population | % Population |
| Africa | 46 | 0.2% |
| Asia | 426 | 1.6% |
| Austria | 8 | 0.0% |
| Belarus | 21 | 0.1% |
| Canada | 19 | 0.1% |
| Caribbean | 53 | 0.2% |
| Central America | 735 | 2.7% |
| China | 36 | 0.1% |
| Colombia | 39 | 0.1% |
| Cuba | 32 | 0.1% |
| Dominican Republic | 21 | 0.1% |
| Eastern Africa | 30 | 0.1% |
| Eastern Asia | 152 | 0.6% |
| Eastern Europe | 62 | 0.2% |
| Ecuador | 22 | 0.1% |
| El Salvador | 368 | 1.3% |
| England | 109 | 0.4% |
| Ethiopia | 30 | 0.1% |
| Europe | 348 | 1.3% |
| France | 17 | 0.1% |
| Germany | 75 | 0.3% |
| Guatemala | 40 | 0.2% |
| Guyana | 13 | 0.1% |
| Honduras | 28 | 0.1% |
| Hong Kong | 18 | 0.1% |
| India | 79 | 0.3% |
| Iran | 7 | 0.0% |
| Japan | 26 | 0.1% |
| Korea | 90 | 0.3% |
| Latin America | 862 | 3.2% |
| Malaysia | 23 | 0.1% |
| Mexico | 299 | 1.1% |
| Netherlands | 14 | 0.1% |
| Northern Europe | 148 | 0.5% |
| Philippines | 22 | 0.1% |
| Russia | 41 | 0.2% |
| Singapore | 17 | 0.1% |
| South America | 74 | 0.3% |
| South Central Asia | 86 | 0.3% |
| South Eastern Asia | 188 | 0.7% |
| Southern Europe | 24 | 0.1% |
| Spain | 24 | 0.1% |
| Sweden | 9 | 0.0% |
| Western Africa | 16 | 0.1% |
| Western Europe | 114 | 0.4% | View All 45 Rows |
Sex and Age in Kernersville
Sex and Age in Kernersville
The most populous age groups in Kernersville are 20 to 24 Years (1,235 | 9.7%) for men and 65 to 69 Years (1,162 | 8.1%) for women.
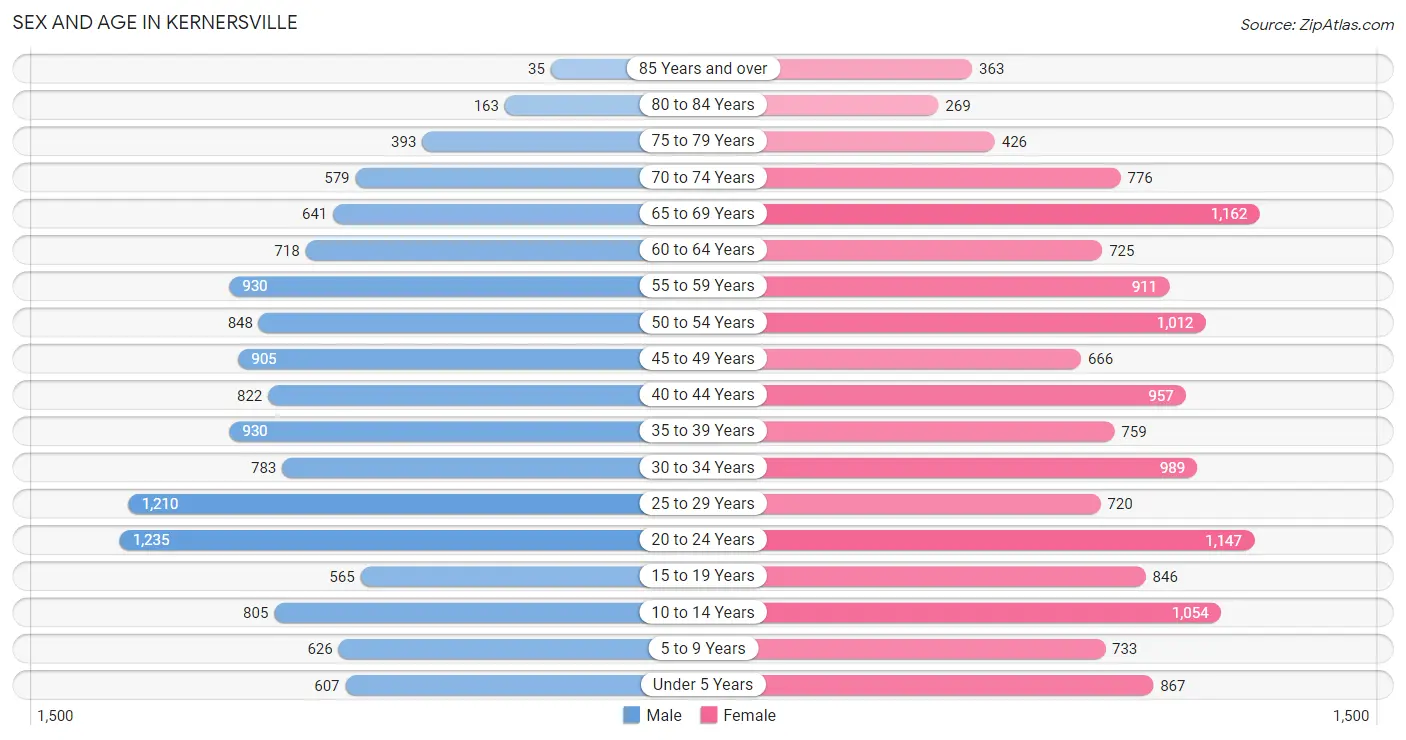
| Age Bracket | Male | Female |
| Under 5 Years | 607 (4.7%) | 867 (6.0%) |
| 5 to 9 Years | 626 (4.9%) | 733 (5.1%) |
| 10 to 14 Years | 805 (6.3%) | 1,054 (7.3%) |
| 15 to 19 Years | 565 (4.4%) | 846 (5.9%) |
| 20 to 24 Years | 1,235 (9.7%) | 1,147 (8.0%) |
| 25 to 29 Years | 1,210 (9.5%) | 720 (5.0%) |
| 30 to 34 Years | 783 (6.1%) | 989 (6.9%) |
| 35 to 39 Years | 930 (7.3%) | 759 (5.3%) |
| 40 to 44 Years | 822 (6.4%) | 957 (6.7%) |
| 45 to 49 Years | 905 (7.1%) | 666 (4.6%) |
| 50 to 54 Years | 848 (6.6%) | 1,012 (7.0%) |
| 55 to 59 Years | 930 (7.3%) | 911 (6.3%) |
| 60 to 64 Years | 718 (5.6%) | 725 (5.0%) |
| 65 to 69 Years | 641 (5.0%) | 1,162 (8.1%) |
| 70 to 74 Years | 579 (4.5%) | 776 (5.4%) |
| 75 to 79 Years | 393 (3.1%) | 426 (3.0%) |
| 80 to 84 Years | 163 (1.3%) | 269 (1.9%) |
| 85 Years and over | 35 (0.3%) | 363 (2.5%) |
| Total | 12,795 (100.0%) | 14,382 (100.0%) |
Families and Households in Kernersville
Median Family Size in Kernersville
The median family size in Kernersville is 3.04 persons per family, with single female/mother families (1,135 | 16.9%) accounting for the largest median family size of 3.36 persons per family. On the other hand, married-couple families (5,097 | 76.0%) represent the smallest median family size with 2.96 persons per family.
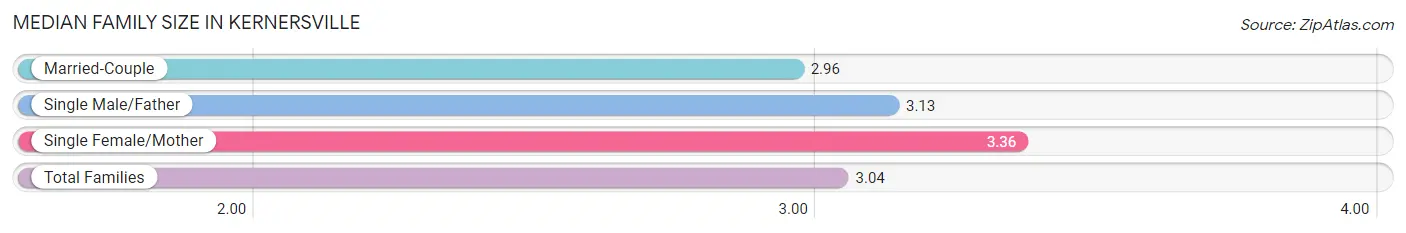
| Family Type | # Families | Family Size |
| Married-Couple | 5,097 (76.0%) | 2.96 |
| Single Male/Father | 472 (7.0%) | 3.13 |
| Single Female/Mother | 1,135 (16.9%) | 3.36 |
| Total Families | 6,704 (100.0%) | 3.04 |
Median Household Size in Kernersville
The median household size in Kernersville is 2.26 persons per household, with single male/father households (472 | 4.0%) accounting for the largest median household size of 3.55 persons per household. non-family households (5,249 | 43.9%) represent the smallest median household size with 1.17 persons per household.
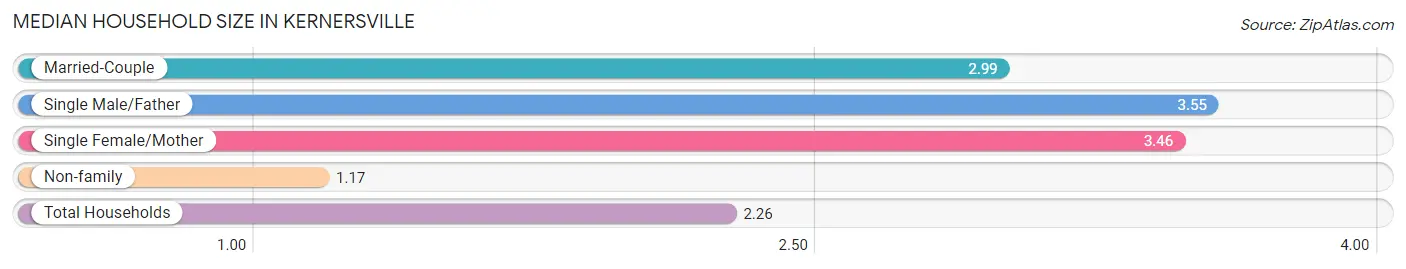
| Household Type | # Households | Household Size |
| Married-Couple | 5,097 (42.6%) | 2.99 |
| Single Male/Father | 472 (4.0%) | 3.55 |
| Single Female/Mother | 1,135 (9.5%) | 3.46 |
| Non-family | 5,249 (43.9%) | 1.17 |
| Total Households | 11,953 (100.0%) | 2.26 |
Household Size by Marriage Status in Kernersville
Out of a total of 11,953 households in Kernersville, 6,704 (56.1%) are family households, while 5,249 (43.9%) are nonfamily households. The most numerous type of family households are 2-person households, comprising 3,273, and the most common type of nonfamily households are 1-person households, comprising 4,585.
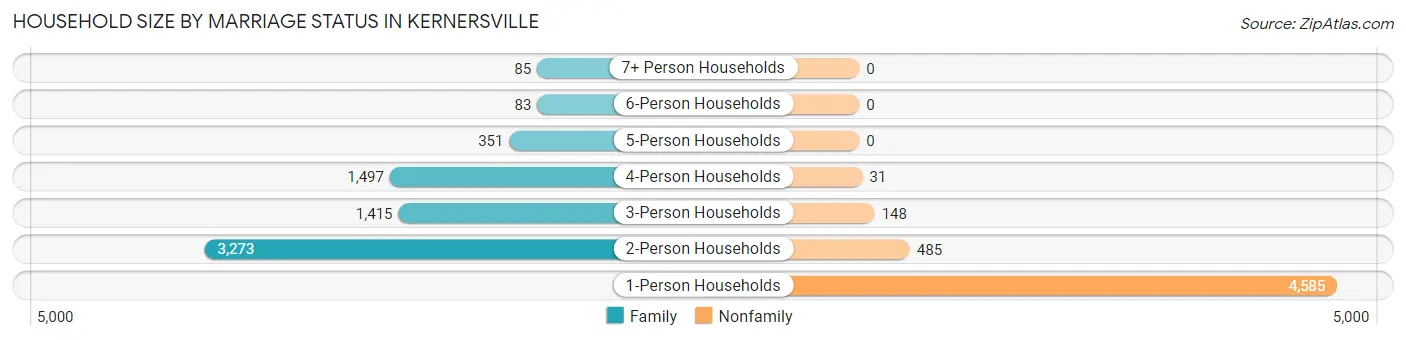
| Household Size | Family Households | Nonfamily Households |
| 1-Person Households | - | 4,585 (38.4%) |
| 2-Person Households | 3,273 (27.4%) | 485 (4.1%) |
| 3-Person Households | 1,415 (11.8%) | 148 (1.2%) |
| 4-Person Households | 1,497 (12.5%) | 31 (0.3%) |
| 5-Person Households | 351 (2.9%) | 0 (0.0%) |
| 6-Person Households | 83 (0.7%) | 0 (0.0%) |
| 7+ Person Households | 85 (0.7%) | 0 (0.0%) |
| Total | 6,704 (56.1%) | 5,249 (43.9%) |
Female Fertility in Kernersville
Fertility by Age in Kernersville
Average fertility rate in Kernersville is 53.0 births per 1,000 women. Women in the age bracket of 20 to 34 years have the highest fertility rate with 82.0 births per 1,000 women. Women in the age bracket of 20 to 34 years acount for 70.5% of all women with births.
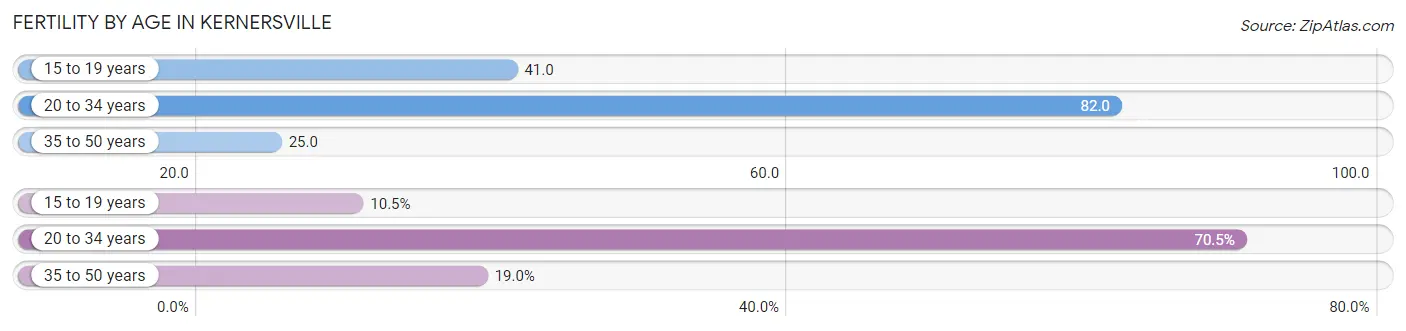
| Age Bracket | Women with Births | Births / 1,000 Women |
| 15 to 19 years | 35 (10.5%) | 41.0 |
| 20 to 34 years | 234 (70.5%) | 82.0 |
| 35 to 50 years | 63 (19.0%) | 25.0 |
| Total | 332 (100.0%) | 53.0 |
Fertility by Age by Marriage Status in Kernersville
80.7% of women with births (332) in Kernersville are married. The highest percentage of unmarried women with births falls into 15 to 19 years age bracket with 100.0% of them unmarried at the time of birth, while the lowest percentage of unmarried women with births belong to 35 to 50 years age bracket with 0.0% of them unmarried.
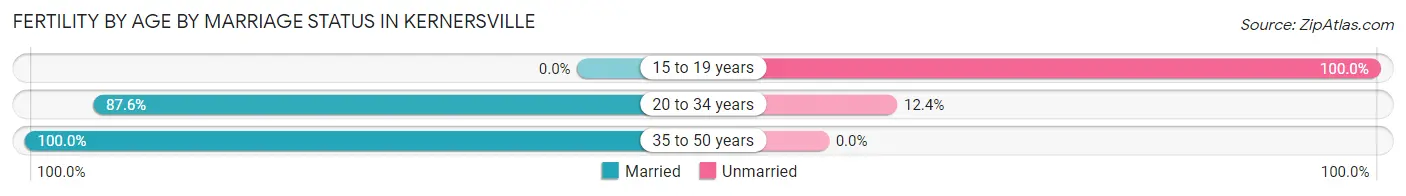
| Age Bracket | Married | Unmarried |
| 15 to 19 years | 0 (0.0%) | 35 (100.0%) |
| 20 to 34 years | 205 (87.6%) | 29 (12.4%) |
| 35 to 50 years | 63 (100.0%) | 0 (0.0%) |
| Total | 268 (80.7%) | 64 (19.3%) |
Fertility by Education in Kernersville
Average fertility rate in Kernersville is 53.0 births per 1,000 women. Women with the education attainment of bachelor's degree have the highest fertility rate of 95.0 births per 1,000 women, while women with the education attainment of college or associate's degree have the lowest fertility at 24.0 births per 1,000 women. Women with the education attainment of bachelor's degree represent 38.0% of all women with births.
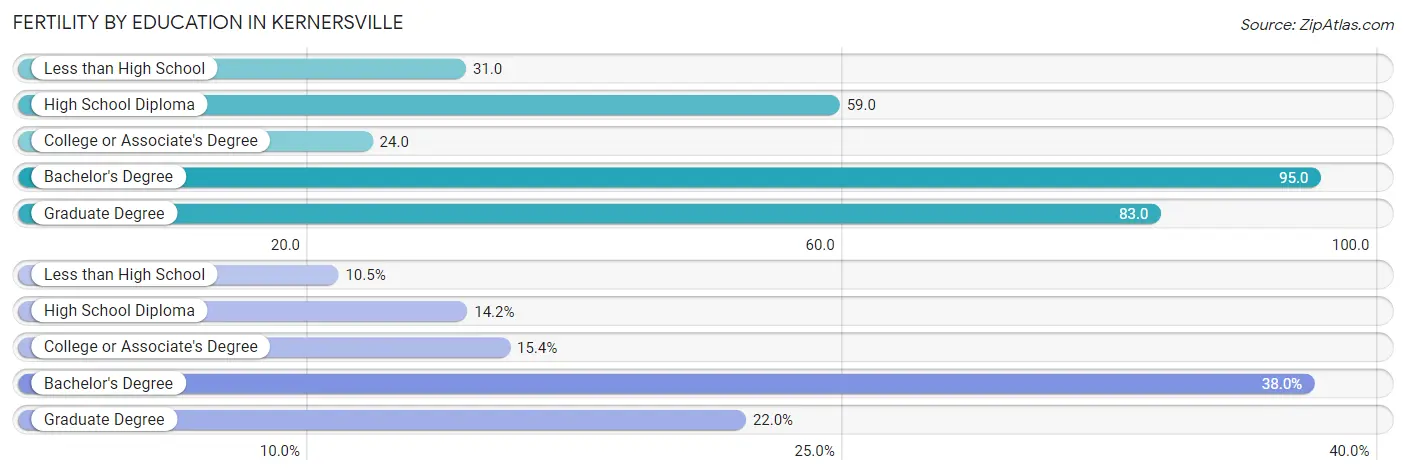
| Educational Attainment | Women with Births | Births / 1,000 Women |
| Less than High School | 35 (10.5%) | 31.0 |
| High School Diploma | 47 (14.2%) | 59.0 |
| College or Associate's Degree | 51 (15.4%) | 24.0 |
| Bachelor's Degree | 126 (38.0%) | 95.0 |
| Graduate Degree | 73 (22.0%) | 83.0 |
| Total | 332 (100.0%) | 53.0 |
Fertility by Education by Marriage Status in Kernersville
19.3% of women with births in Kernersville are unmarried. Women with the educational attainment of high school diploma are most likely to be married with 100.0% of them married at childbirth, while women with the educational attainment of less than high school are least likely to be married with 100.0% of them unmarried at childbirth.
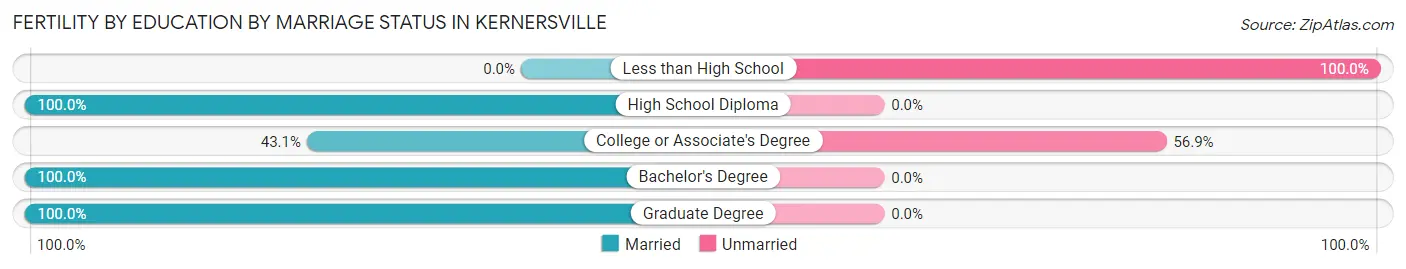
| Educational Attainment | Married | Unmarried |
| Less than High School | 0 (0.0%) | 35 (100.0%) |
| High School Diploma | 47 (100.0%) | 0 (0.0%) |
| College or Associate's Degree | 22 (43.1%) | 29 (56.9%) |
| Bachelor's Degree | 126 (100.0%) | 0 (0.0%) |
| Graduate Degree | 73 (100.0%) | 0 (0.0%) |
| Total | 268 (80.7%) | 64 (19.3%) |
Employment Characteristics in Kernersville
Employment by Class of Employer in Kernersville
Among the 14,046 employed individuals in Kernersville, private company employees (10,233 | 72.9%), not-for-profit organizations (1,618 | 11.5%), and local government employees (657 | 4.7%) make up the most common classes of employment.
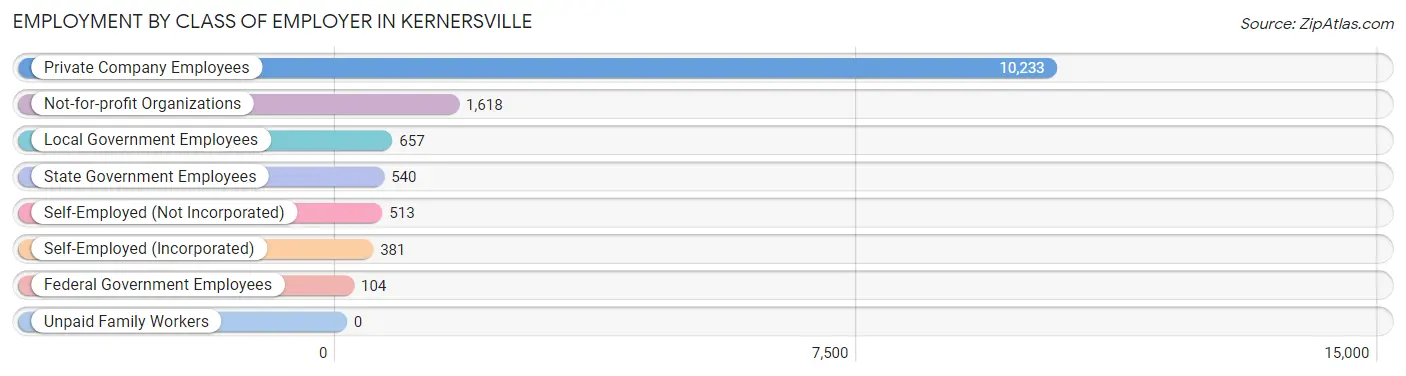
| Employer Class | # Employees | % Employees |
| Private Company Employees | 10,233 | 72.9% |
| Self-Employed (Incorporated) | 381 | 2.7% |
| Self-Employed (Not Incorporated) | 513 | 3.6% |
| Not-for-profit Organizations | 1,618 | 11.5% |
| Local Government Employees | 657 | 4.7% |
| State Government Employees | 540 | 3.8% |
| Federal Government Employees | 104 | 0.7% |
| Unpaid Family Workers | 0 | 0.0% |
| Total | 14,046 | 100.0% |
Employment Status by Age in Kernersville
According to the labor force statistics for Kernersville, out of the total population over 16 years of age (22,323), 66.0% or 14,733 individuals are in the labor force, with 3.0% or 442 of them unemployed. The age group with the highest labor force participation rate is 30 to 34 years, with 90.0% or 1,595 individuals in the labor force. Within the labor force, the 16 to 19 years age range has the highest percentage of unemployed individuals, with 19.3% or 110 of them being unemployed.
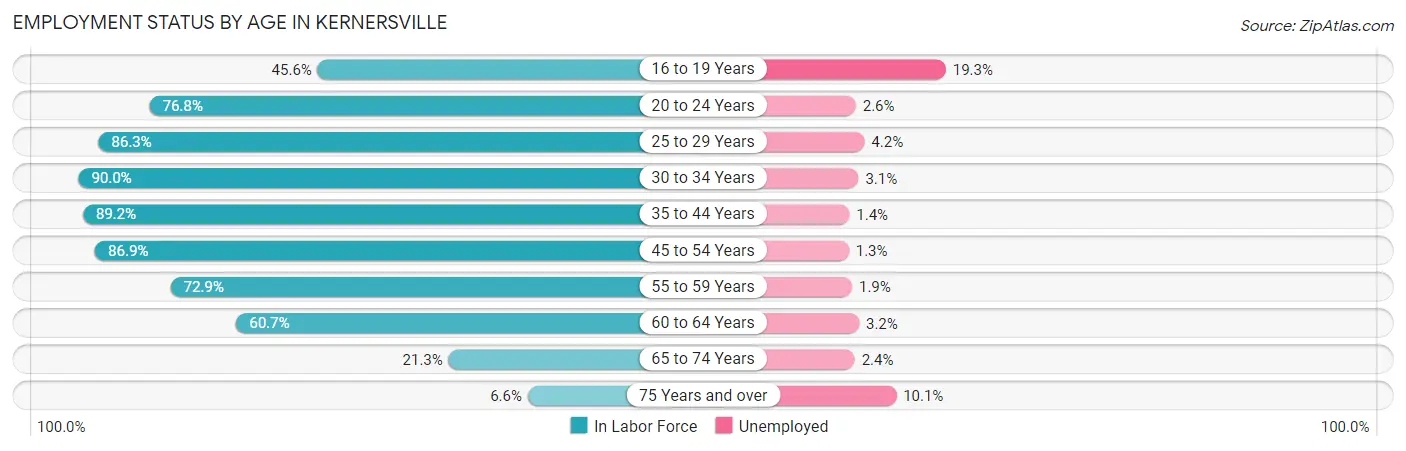
| Age Bracket | In Labor Force | Unemployed |
| 16 to 19 Years | 570 (45.6%) | 110 (19.3%) |
| 20 to 24 Years | 1,829 (76.8%) | 48 (2.6%) |
| 25 to 29 Years | 1,666 (86.3%) | 70 (4.2%) |
| 30 to 34 Years | 1,595 (90.0%) | 49 (3.1%) |
| 35 to 44 Years | 3,093 (89.2%) | 43 (1.4%) |
| 45 to 54 Years | 2,982 (86.9%) | 39 (1.3%) |
| 55 to 59 Years | 1,342 (72.9%) | 25 (1.9%) |
| 60 to 64 Years | 876 (60.7%) | 28 (3.2%) |
| 65 to 74 Years | 673 (21.3%) | 16 (2.4%) |
| 75 Years and over | 109 (6.6%) | 11 (10.1%) |
| Total | 14,733 (66.0%) | 442 (3.0%) |
Employment Status by Educational Attainment in Kernersville
According to labor force statistics for Kernersville, 83.2% of individuals (11,552) out of the total population between 25 and 64 years of age (13,885) are in the labor force, with 2.2% or 254 of them being unemployed. The group with the highest labor force participation rate are those with the educational attainment of bachelor's degree or higher, with 90.5% or 4,924 individuals in the labor force. Within the labor force, individuals with less than high school education have the highest percentage of unemployment, with 13.9% or 84 of them being unemployed.
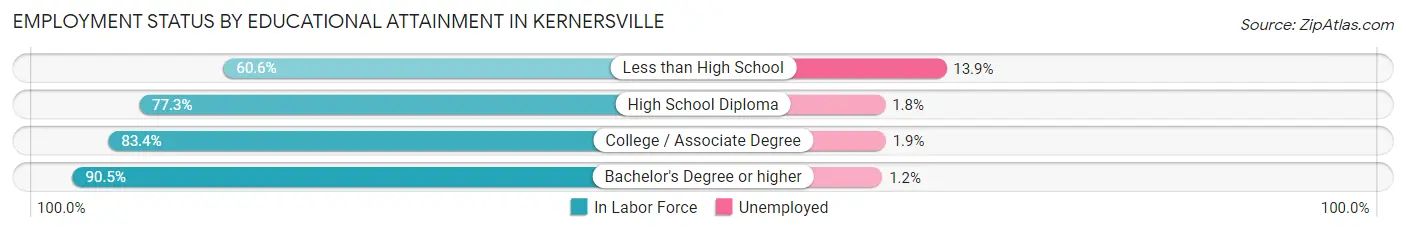
| Educational Attainment | In Labor Force | Unemployed |
| Less than High School | 604 (60.6%) | 139 (13.9%) |
| High School Diploma | 2,409 (77.3%) | 56 (1.8%) |
| College / Associate Degree | 3,612 (83.4%) | 82 (1.9%) |
| Bachelor's Degree or higher | 4,924 (90.5%) | 65 (1.2%) |
| Total | 11,552 (83.2%) | 305 (2.2%) |
Employment Occupations by Sex in Kernersville
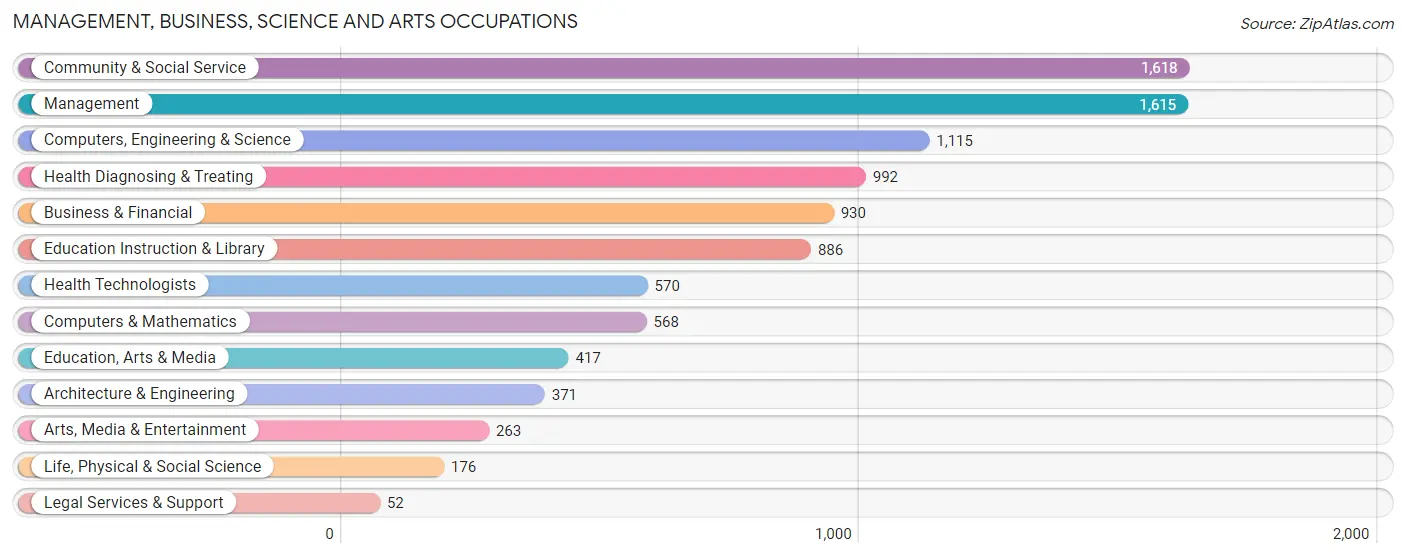
Management, Business, Science and Arts Occupations
The most common Management, Business, Science and Arts occupations in Kernersville are Community & Social Service (1,618 | 11.3%), Management (1,615 | 11.3%), Computers, Engineering & Science (1,115 | 7.8%), Health Diagnosing & Treating (992 | 7.0%), and Business & Financial (930 | 6.5%).
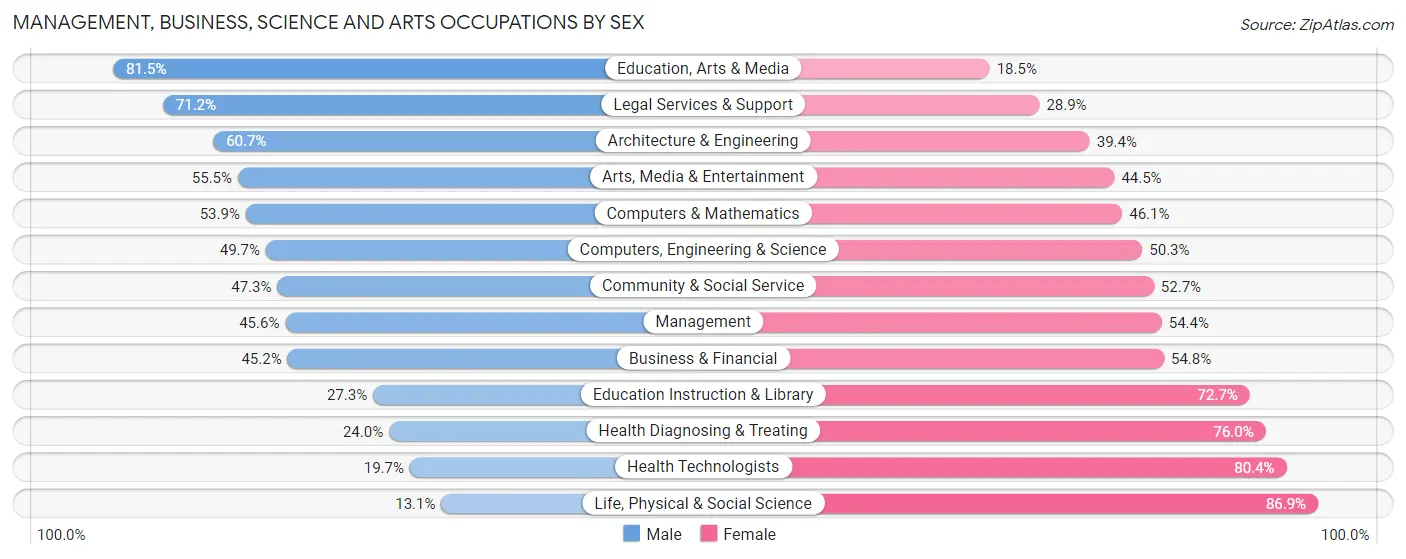
Management, Business, Science and Arts Occupations by Sex
Within the Management, Business, Science and Arts occupations in Kernersville, the most male-oriented occupations are Education, Arts & Media (81.5%), Legal Services & Support (71.2%), and Architecture & Engineering (60.7%), while the most female-oriented occupations are Life, Physical & Social Science (86.9%), Health Technologists (80.3%), and Health Diagnosing & Treating (76.0%).
| Occupation | Male | Female |
| Management | 737 (45.6%) | 878 (54.4%) |
| Business & Financial | 420 (45.2%) | 510 (54.8%) |
| Computers, Engineering & Science | 554 (49.7%) | 561 (50.3%) |
| Computers & Mathematics | 306 (53.9%) | 262 (46.1%) |
| Architecture & Engineering | 225 (60.7%) | 146 (39.4%) |
| Life, Physical & Social Science | 23 (13.1%) | 153 (86.9%) |
| Community & Social Service | 765 (47.3%) | 853 (52.7%) |
| Education, Arts & Media | 340 (81.5%) | 77 (18.5%) |
| Legal Services & Support | 37 (71.2%) | 15 (28.8%) |
| Education Instruction & Library | 242 (27.3%) | 644 (72.7%) |
| Arts, Media & Entertainment | 146 (55.5%) | 117 (44.5%) |
| Health Diagnosing & Treating | 238 (24.0%) | 754 (76.0%) |
| Health Technologists | 112 (19.7%) | 458 (80.3%) |
| Total (Category) | 2,714 (43.3%) | 3,556 (56.7%) |
| Total (Overall) | 7,616 (53.3%) | 6,667 (46.7%) |
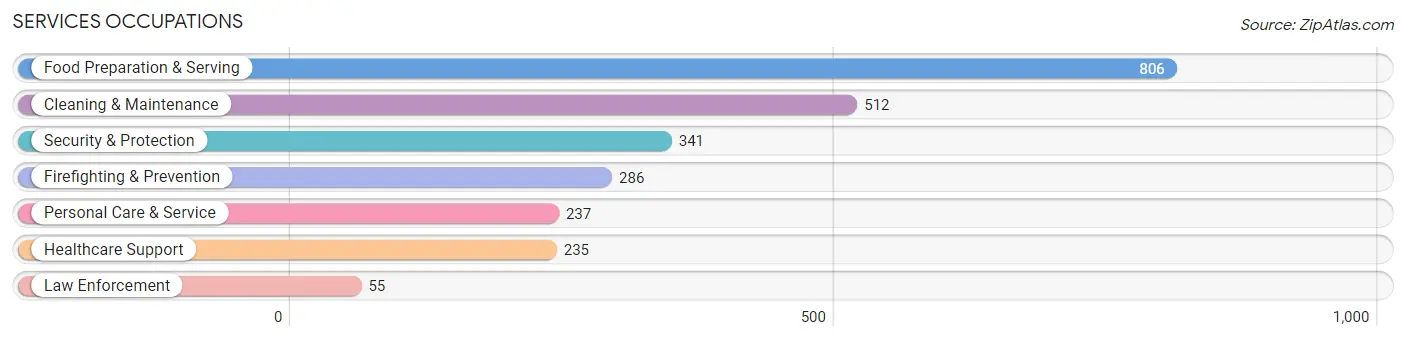
Services Occupations
The most common Services occupations in Kernersville are Food Preparation & Serving (806 | 5.6%), Cleaning & Maintenance (512 | 3.6%), Security & Protection (341 | 2.4%), Firefighting & Prevention (286 | 2.0%), and Personal Care & Service (237 | 1.7%).
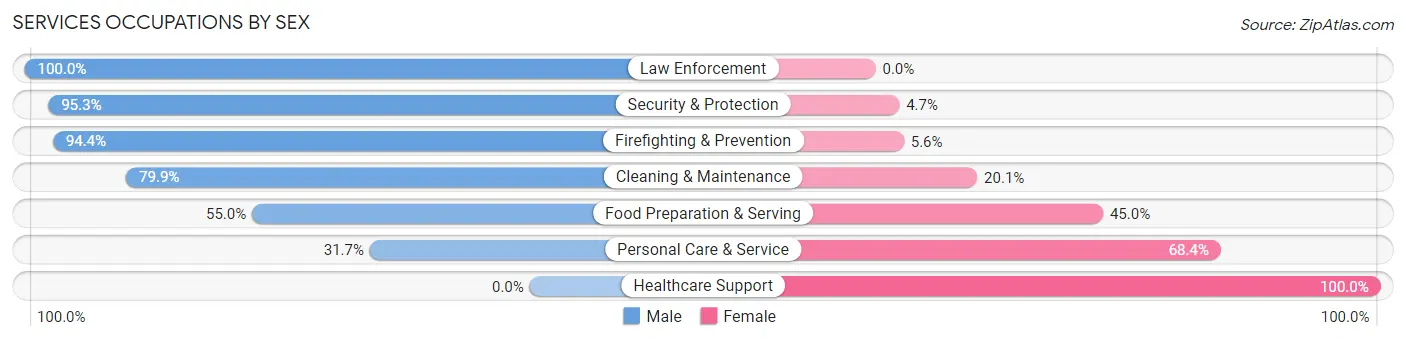
Services Occupations by Sex
Within the Services occupations in Kernersville, the most male-oriented occupations are Law Enforcement (100.0%), Security & Protection (95.3%), and Firefighting & Prevention (94.4%), while the most female-oriented occupations are Healthcare Support (100.0%), Personal Care & Service (68.3%), and Food Preparation & Serving (45.0%).
| Occupation | Male | Female |
| Healthcare Support | 0 (0.0%) | 235 (100.0%) |
| Security & Protection | 325 (95.3%) | 16 (4.7%) |
| Firefighting & Prevention | 270 (94.4%) | 16 (5.6%) |
| Law Enforcement | 55 (100.0%) | 0 (0.0%) |
| Food Preparation & Serving | 443 (55.0%) | 363 (45.0%) |
| Cleaning & Maintenance | 409 (79.9%) | 103 (20.1%) |
| Personal Care & Service | 75 (31.7%) | 162 (68.3%) |
| Total (Category) | 1,252 (58.8%) | 879 (41.2%) |
| Total (Overall) | 7,616 (53.3%) | 6,667 (46.7%) |
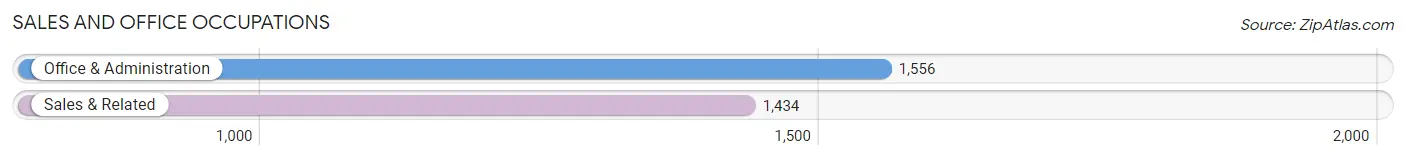
Sales and Office Occupations
The most common Sales and Office occupations in Kernersville are Office & Administration (1,556 | 10.9%), and Sales & Related (1,434 | 10.0%).
Sales and Office Occupations by Sex
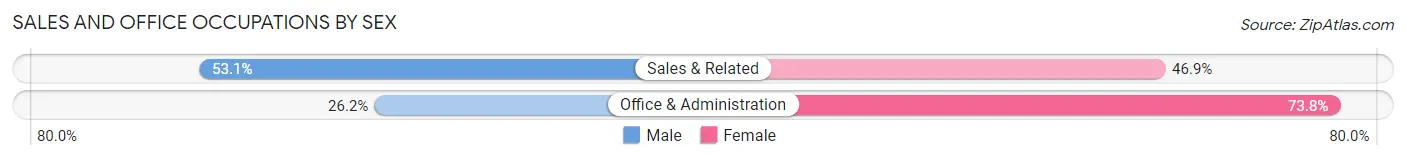
| Occupation | Male | Female |
| Sales & Related | 762 (53.1%) | 672 (46.9%) |
| Office & Administration | 408 (26.2%) | 1,148 (73.8%) |
| Total (Category) | 1,170 (39.1%) | 1,820 (60.9%) |
| Total (Overall) | 7,616 (53.3%) | 6,667 (46.7%) |
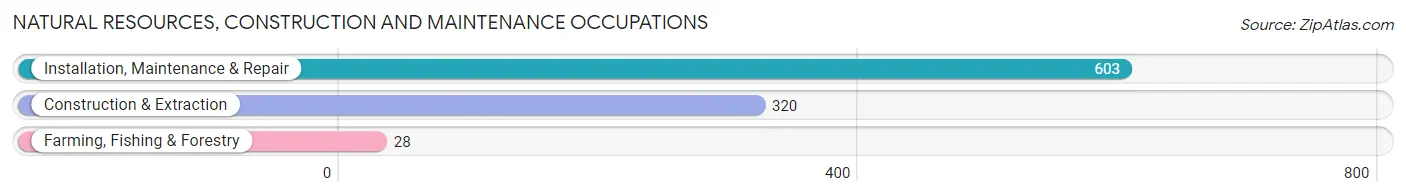
Natural Resources, Construction and Maintenance Occupations
The most common Natural Resources, Construction and Maintenance occupations in Kernersville are Installation, Maintenance & Repair (603 | 4.2%), Construction & Extraction (320 | 2.2%), and Farming, Fishing & Forestry (28 | 0.2%).
Natural Resources, Construction and Maintenance Occupations by Sex
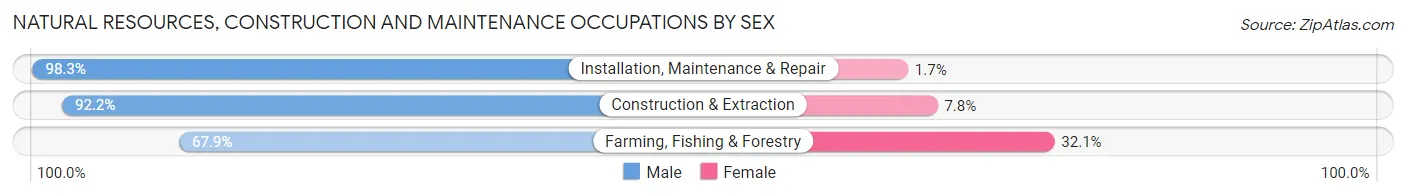
| Occupation | Male | Female |
| Farming, Fishing & Forestry | 19 (67.9%) | 9 (32.1%) |
| Construction & Extraction | 295 (92.2%) | 25 (7.8%) |
| Installation, Maintenance & Repair | 593 (98.3%) | 10 (1.7%) |
| Total (Category) | 907 (95.4%) | 44 (4.6%) |
| Total (Overall) | 7,616 (53.3%) | 6,667 (46.7%) |
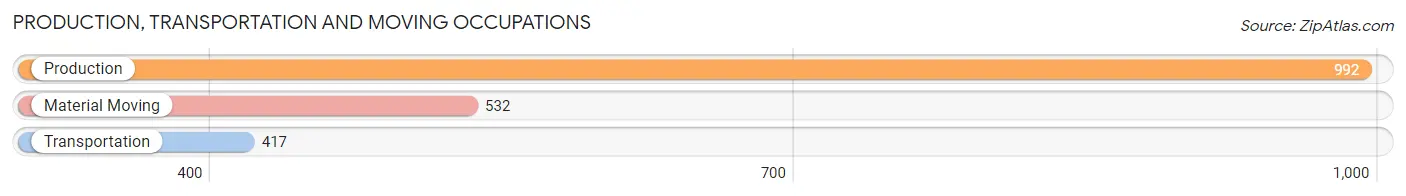
Production, Transportation and Moving Occupations
The most common Production, Transportation and Moving occupations in Kernersville are Production (992 | 7.0%), Material Moving (532 | 3.7%), and Transportation (417 | 2.9%).
Production, Transportation and Moving Occupations by Sex
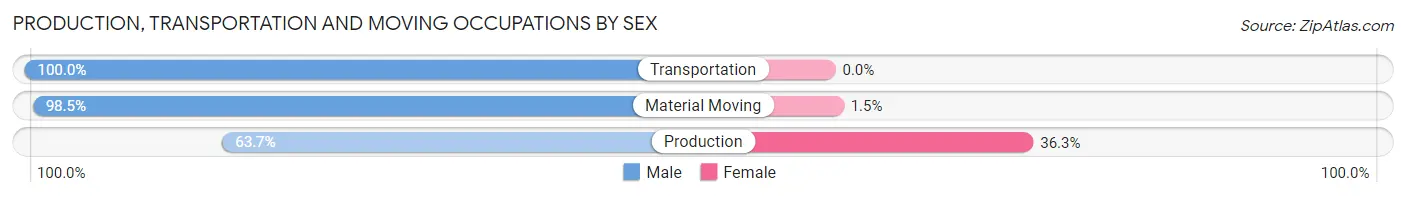
| Occupation | Male | Female |
| Production | 632 (63.7%) | 360 (36.3%) |
| Transportation | 417 (100.0%) | 0 (0.0%) |
| Material Moving | 524 (98.5%) | 8 (1.5%) |
| Total (Category) | 1,573 (81.0%) | 368 (19.0%) |
| Total (Overall) | 7,616 (53.3%) | 6,667 (46.7%) |
Employment Industries by Sex in Kernersville
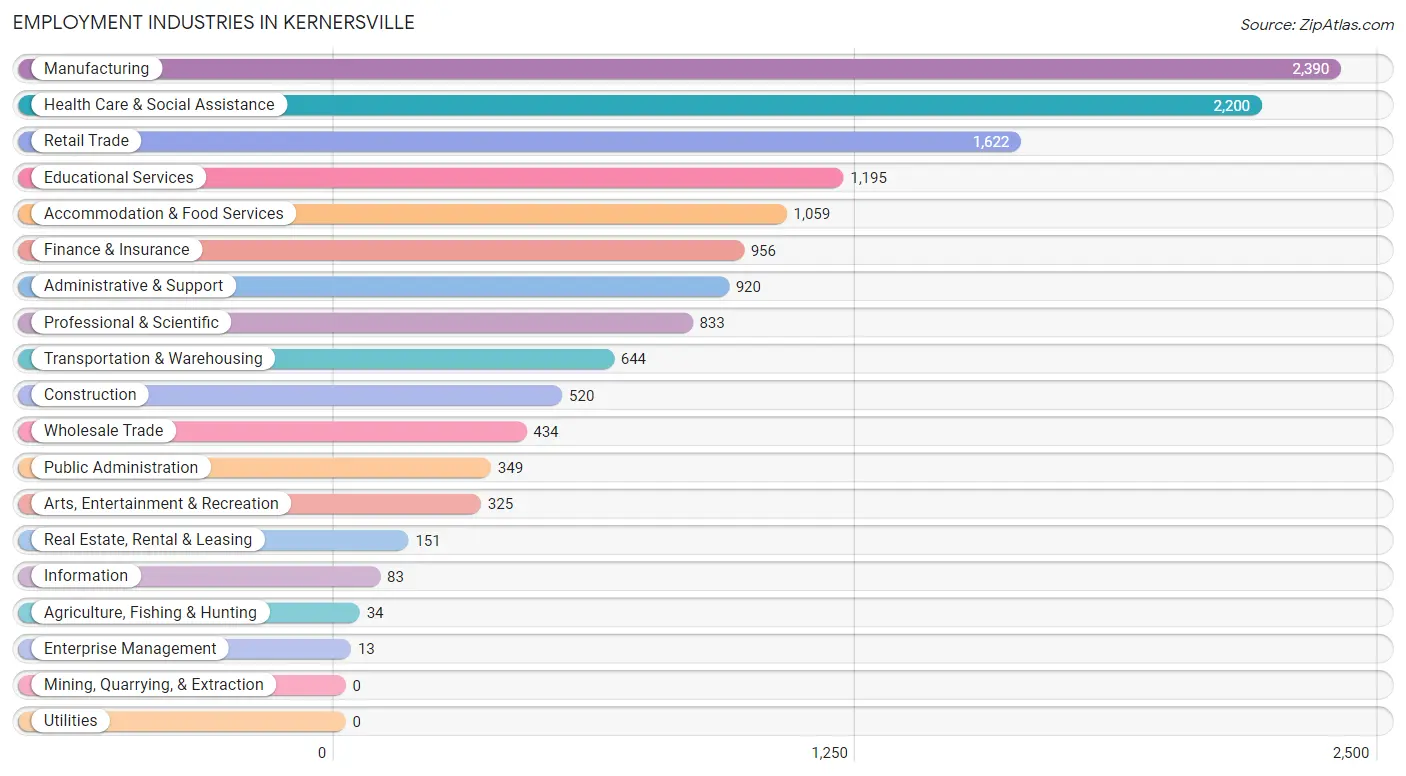
Employment Industries in Kernersville
The major employment industries in Kernersville include Manufacturing (2,390 | 16.7%), Health Care & Social Assistance (2,200 | 15.4%), Retail Trade (1,622 | 11.4%), Educational Services (1,195 | 8.4%), and Accommodation & Food Services (1,059 | 7.4%).
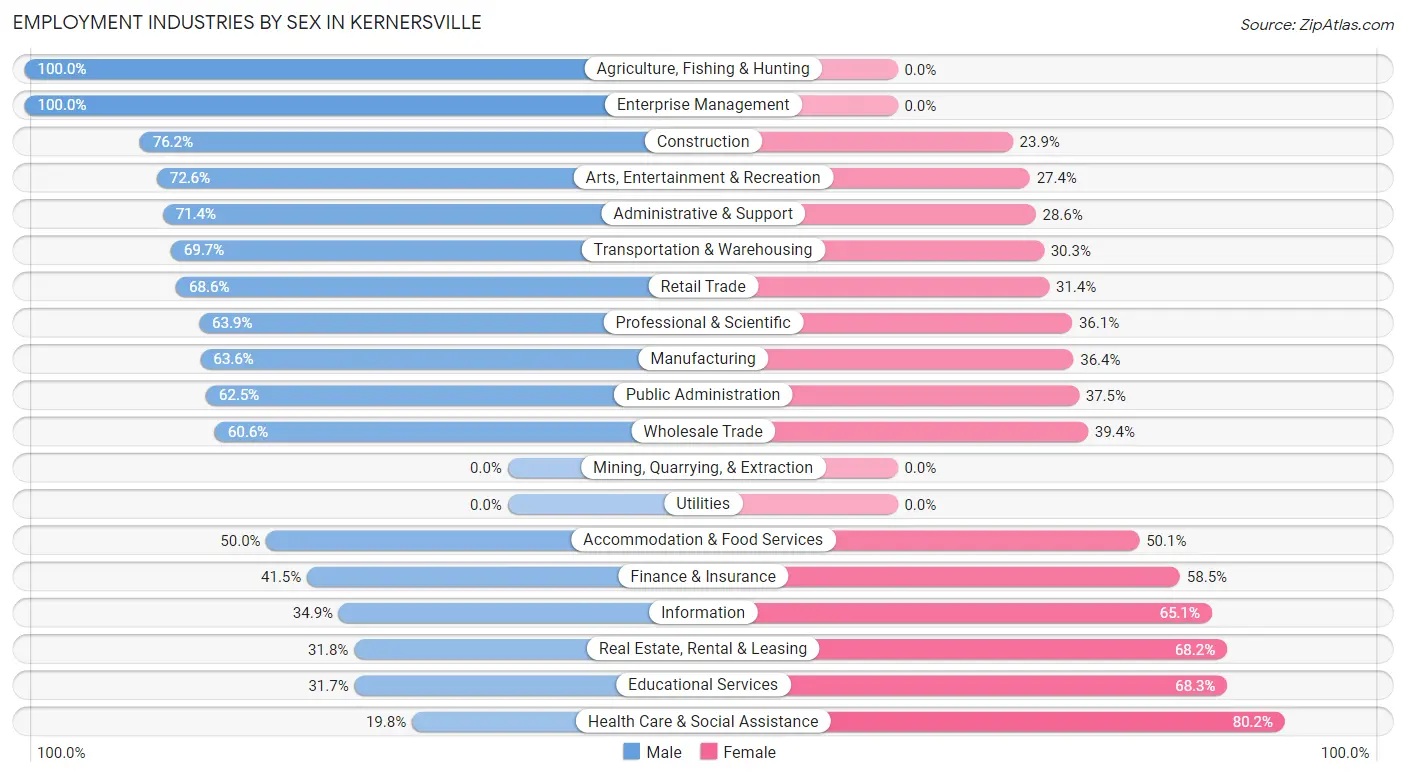
Employment Industries by Sex in Kernersville
The Kernersville industries that see more men than women are Agriculture, Fishing & Hunting (100.0%), Enterprise Management (100.0%), and Construction (76.1%), whereas the industries that tend to have a higher number of women are Health Care & Social Assistance (80.2%), Educational Services (68.3%), and Real Estate, Rental & Leasing (68.2%).
| Industry | Male | Female |
| Agriculture, Fishing & Hunting | 34 (100.0%) | 0 (0.0%) |
| Mining, Quarrying, & Extraction | 0 (0.0%) | 0 (0.0%) |
| Construction | 396 (76.1%) | 124 (23.8%) |
| Manufacturing | 1,520 (63.6%) | 870 (36.4%) |
| Wholesale Trade | 263 (60.6%) | 171 (39.4%) |
| Retail Trade | 1,113 (68.6%) | 509 (31.4%) |
| Transportation & Warehousing | 449 (69.7%) | 195 (30.3%) |
| Utilities | 0 (0.0%) | 0 (0.0%) |
| Information | 29 (34.9%) | 54 (65.1%) |
| Finance & Insurance | 397 (41.5%) | 559 (58.5%) |
| Real Estate, Rental & Leasing | 48 (31.8%) | 103 (68.2%) |
| Professional & Scientific | 532 (63.9%) | 301 (36.1%) |
| Enterprise Management | 13 (100.0%) | 0 (0.0%) |
| Administrative & Support | 657 (71.4%) | 263 (28.6%) |
| Educational Services | 379 (31.7%) | 816 (68.3%) |
| Health Care & Social Assistance | 436 (19.8%) | 1,764 (80.2%) |
| Arts, Entertainment & Recreation | 236 (72.6%) | 89 (27.4%) |
| Accommodation & Food Services | 529 (49.9%) | 530 (50.0%) |
| Public Administration | 218 (62.5%) | 131 (37.5%) |
| Total | 7,616 (53.3%) | 6,667 (46.7%) |
Education in Kernersville
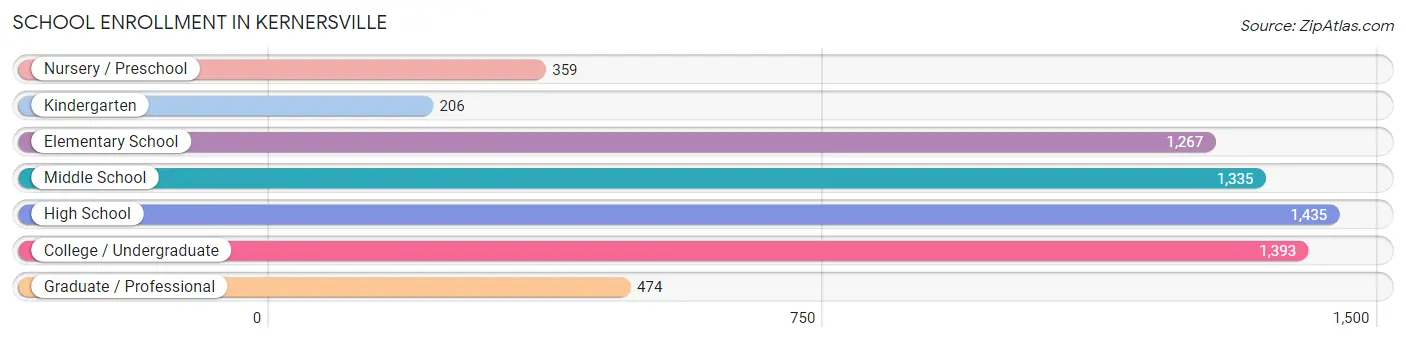
School Enrollment in Kernersville
The most common levels of schooling among the 6,469 students in Kernersville are high school (1,435 | 22.2%), college / undergraduate (1,393 | 21.5%), and middle school (1,335 | 20.6%).
| School Level | # Students | % Students |
| Nursery / Preschool | 359 | 5.6% |
| Kindergarten | 206 | 3.2% |
| Elementary School | 1,267 | 19.6% |
| Middle School | 1,335 | 20.6% |
| High School | 1,435 | 22.2% |
| College / Undergraduate | 1,393 | 21.5% |
| Graduate / Professional | 474 | 7.3% |
| Total | 6,469 | 100.0% |
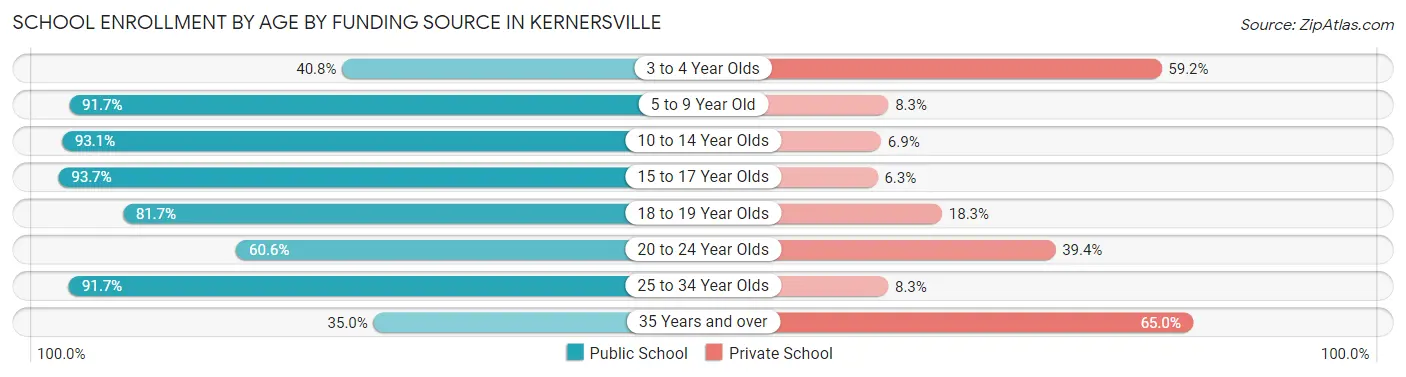
School Enrollment by Age by Funding Source in Kernersville
Out of a total of 6,469 students who are enrolled in schools in Kernersville, 1,171 (18.1%) attend a private institution, while the remaining 5,298 (81.9%) are enrolled in public schools. The age group of 35 years and over has the highest likelihood of being enrolled in private schools, with 301 (65.0% in the age bracket) enrolled. Conversely, the age group of 15 to 17 year olds has the lowest likelihood of being enrolled in a private school, with 937 (93.7% in the age bracket) attending a public institution.
| Age Bracket | Public School | Private School |
| 3 to 4 Year Olds | 118 (40.8%) | 171 (59.2%) |
| 5 to 9 Year Old | 1,193 (91.7%) | 108 (8.3%) |
| 10 to 14 Year Olds | 1,690 (93.1%) | 126 (6.9%) |
| 15 to 17 Year Olds | 937 (93.7%) | 63 (6.3%) |
| 18 to 19 Year Olds | 201 (81.7%) | 45 (18.3%) |
| 20 to 24 Year Olds | 483 (60.6%) | 314 (39.4%) |
| 25 to 34 Year Olds | 511 (91.7%) | 46 (8.3%) |
| 35 Years and over | 162 (35.0%) | 301 (65.0%) |
| Total | 5,298 (81.9%) | 1,171 (18.1%) |
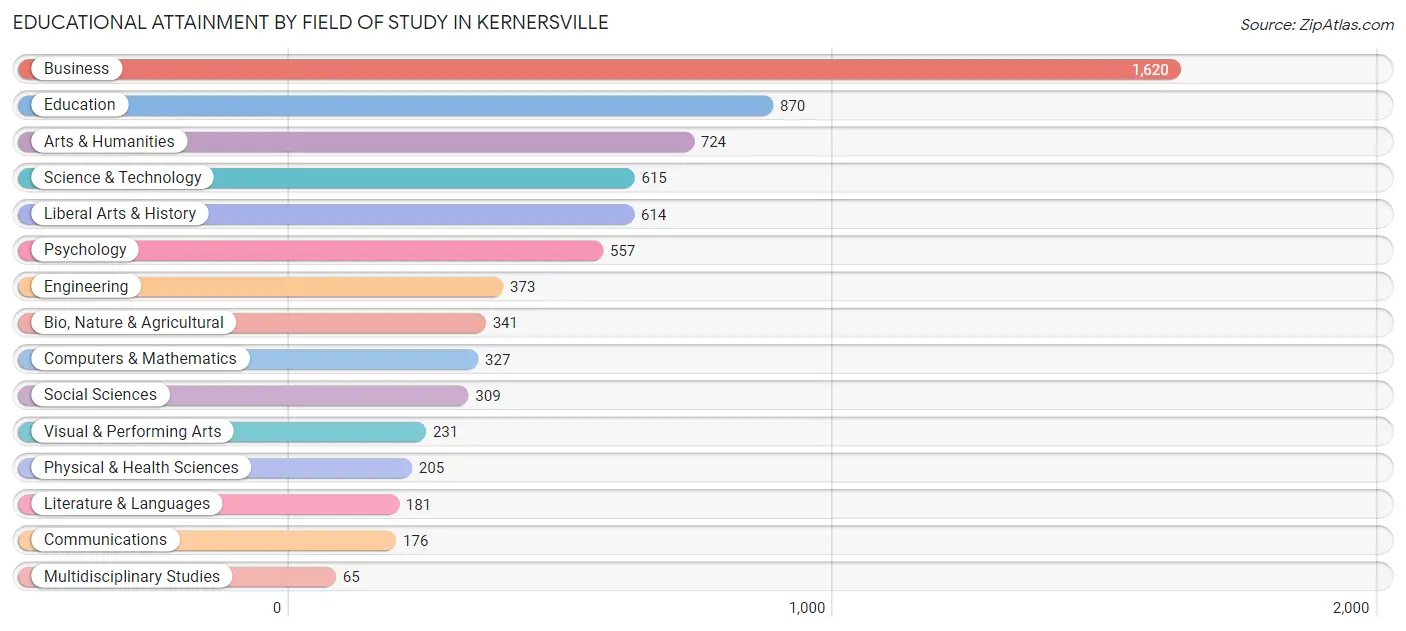
Educational Attainment by Field of Study in Kernersville
Business (1,620 | 22.5%), education (870 | 12.1%), arts & humanities (724 | 10.0%), science & technology (615 | 8.5%), and liberal arts & history (614 | 8.5%) are the most common fields of study among 7,208 individuals in Kernersville who have obtained a bachelor's degree or higher.
| Field of Study | # Graduates | % Graduates |
| Computers & Mathematics | 327 | 4.5% |
| Bio, Nature & Agricultural | 341 | 4.7% |
| Physical & Health Sciences | 205 | 2.8% |
| Psychology | 557 | 7.7% |
| Social Sciences | 309 | 4.3% |
| Engineering | 373 | 5.2% |
| Multidisciplinary Studies | 65 | 0.9% |
| Science & Technology | 615 | 8.5% |
| Business | 1,620 | 22.5% |
| Education | 870 | 12.1% |
| Literature & Languages | 181 | 2.5% |
| Liberal Arts & History | 614 | 8.5% |
| Visual & Performing Arts | 231 | 3.2% |
| Communications | 176 | 2.4% |
| Arts & Humanities | 724 | 10.0% |
| Total | 7,208 | 100.0% |
Transportation & Commute in Kernersville
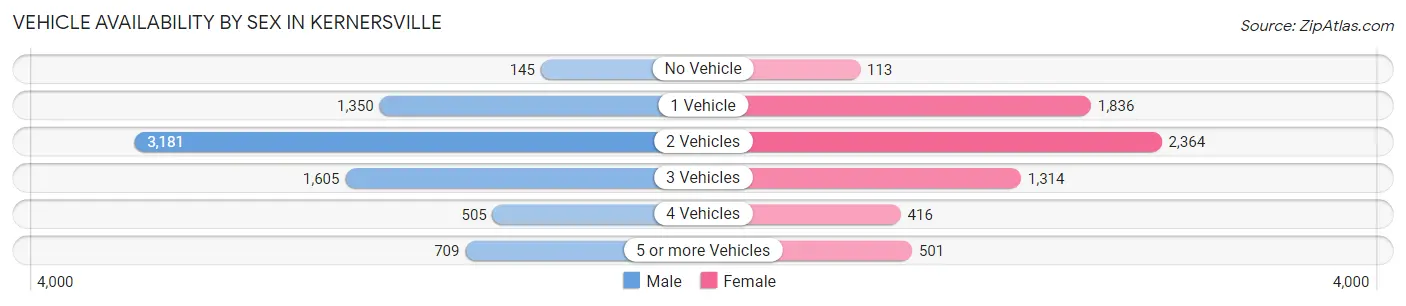
Vehicle Availability by Sex in Kernersville
The most prevalent vehicle ownership categories in Kernersville are males with 2 vehicles (3,181, accounting for 42.4%) and females with 2 vehicles (2,364, making up 48.6%).
| Vehicles Available | Male | Female |
| No Vehicle | 145 (1.9%) | 113 (1.7%) |
| 1 Vehicle | 1,350 (18.0%) | 1,836 (28.1%) |
| 2 Vehicles | 3,181 (42.4%) | 2,364 (36.1%) |
| 3 Vehicles | 1,605 (21.4%) | 1,314 (20.1%) |
| 4 Vehicles | 505 (6.7%) | 416 (6.4%) |
| 5 or more Vehicles | 709 (9.5%) | 501 (7.7%) |
| Total | 7,495 (100.0%) | 6,544 (100.0%) |
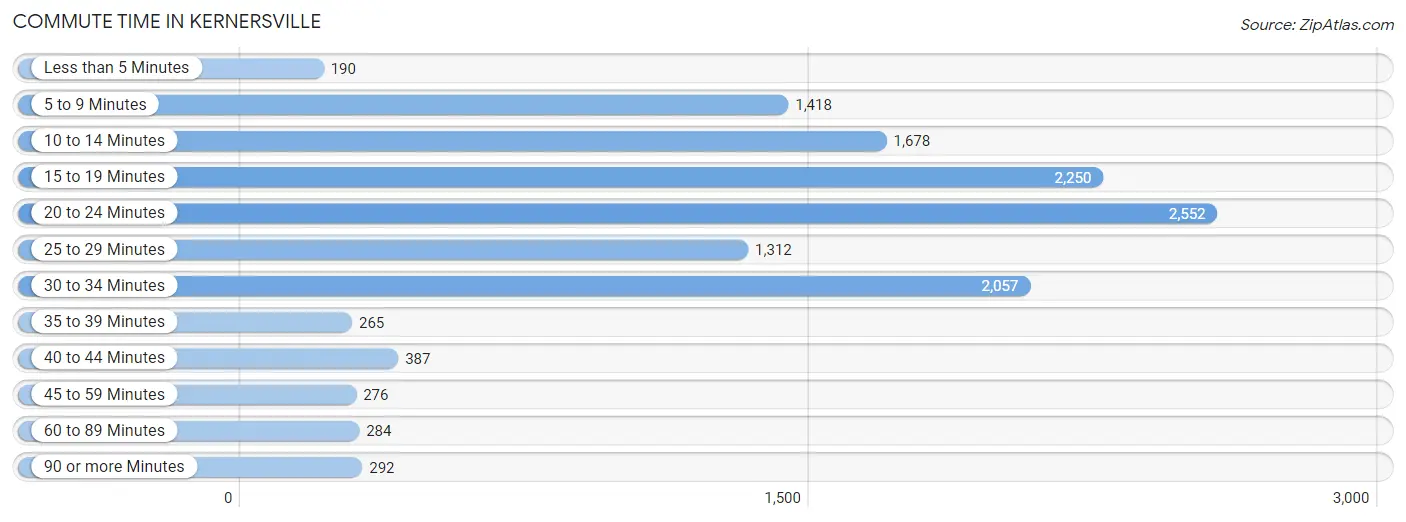
Commute Time in Kernersville
The most frequently occuring commute durations in Kernersville are 20 to 24 minutes (2,552 commuters, 19.7%), 15 to 19 minutes (2,250 commuters, 17.4%), and 30 to 34 minutes (2,057 commuters, 15.9%).
| Commute Time | # Commuters | % Commuters |
| Less than 5 Minutes | 190 | 1.5% |
| 5 to 9 Minutes | 1,418 | 10.9% |
| 10 to 14 Minutes | 1,678 | 13.0% |
| 15 to 19 Minutes | 2,250 | 17.4% |
| 20 to 24 Minutes | 2,552 | 19.7% |
| 25 to 29 Minutes | 1,312 | 10.1% |
| 30 to 34 Minutes | 2,057 | 15.9% |
| 35 to 39 Minutes | 265 | 2.0% |
| 40 to 44 Minutes | 387 | 3.0% |
| 45 to 59 Minutes | 276 | 2.1% |
| 60 to 89 Minutes | 284 | 2.2% |
| 90 or more Minutes | 292 | 2.2% |
Commute Time by Sex in Kernersville
The most common commute times in Kernersville are 30 to 34 minutes (1,316 commuters, 18.9%) for males and 20 to 24 minutes (1,371 commuters, 22.9%) for females.
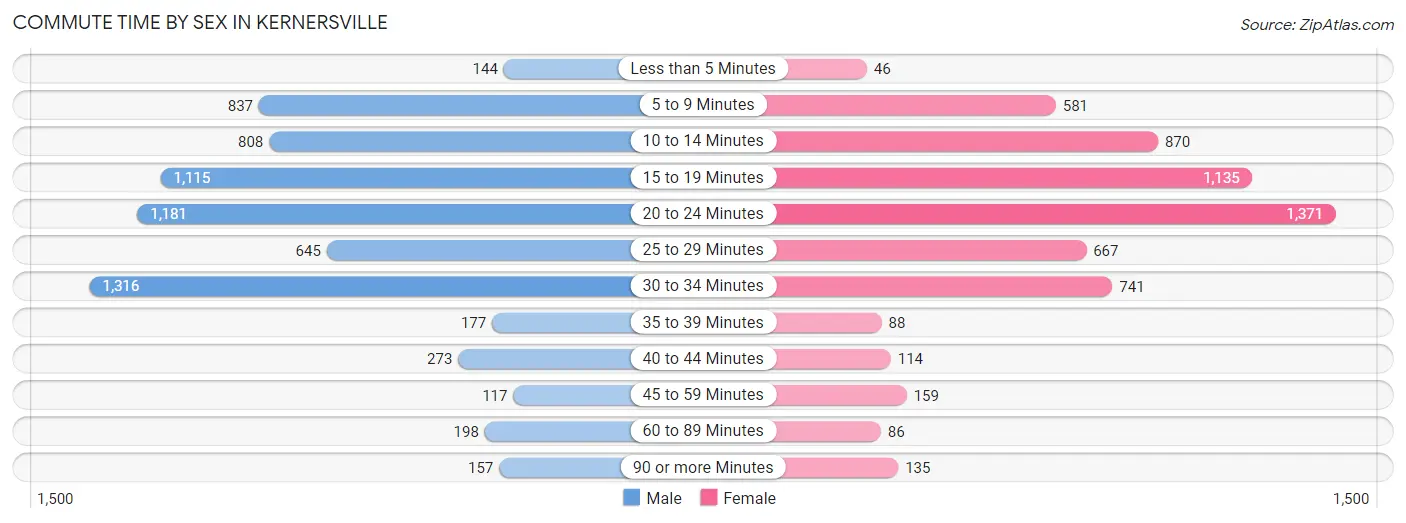
| Commute Time | Male | Female |
| Less than 5 Minutes | 144 (2.1%) | 46 (0.8%) |
| 5 to 9 Minutes | 837 (12.0%) | 581 (9.7%) |
| 10 to 14 Minutes | 808 (11.6%) | 870 (14.5%) |
| 15 to 19 Minutes | 1,115 (16.0%) | 1,135 (18.9%) |
| 20 to 24 Minutes | 1,181 (17.0%) | 1,371 (22.9%) |
| 25 to 29 Minutes | 645 (9.3%) | 667 (11.1%) |
| 30 to 34 Minutes | 1,316 (18.9%) | 741 (12.4%) |
| 35 to 39 Minutes | 177 (2.5%) | 88 (1.5%) |
| 40 to 44 Minutes | 273 (3.9%) | 114 (1.9%) |
| 45 to 59 Minutes | 117 (1.7%) | 159 (2.6%) |
| 60 to 89 Minutes | 198 (2.8%) | 86 (1.4%) |
| 90 or more Minutes | 157 (2.2%) | 135 (2.2%) |
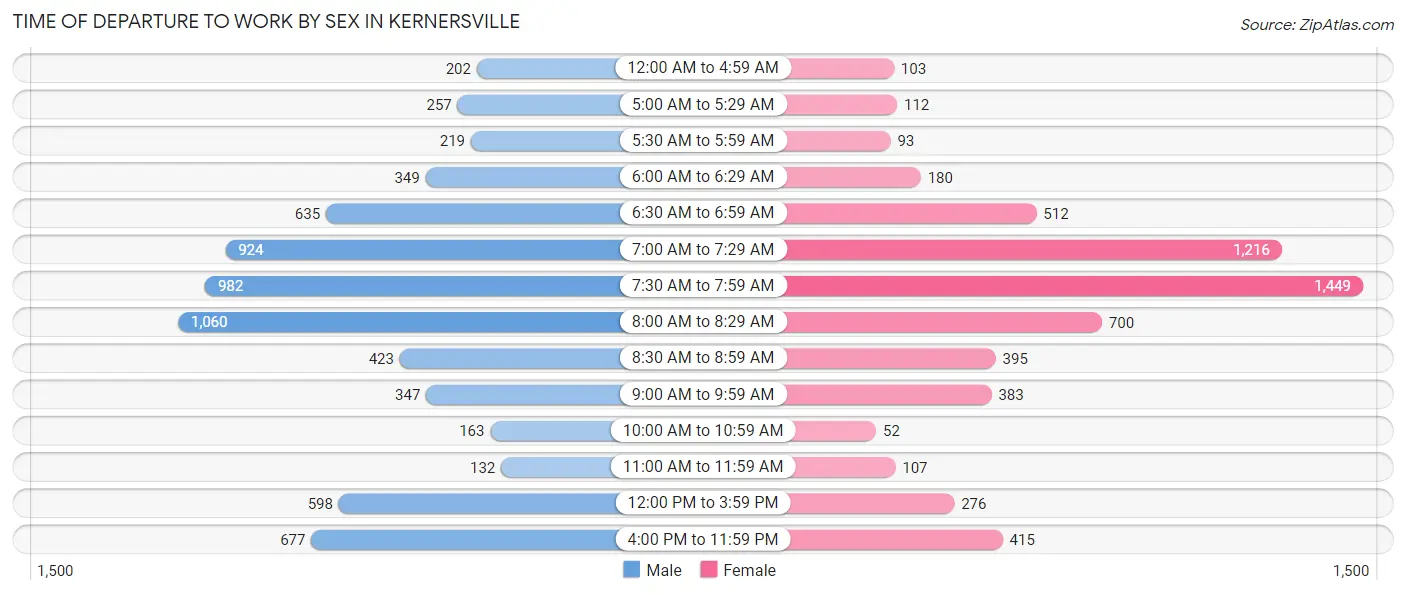
Time of Departure to Work by Sex in Kernersville
The most frequent times of departure to work in Kernersville are 8:00 AM to 8:29 AM (1,060, 15.2%) for males and 7:30 AM to 7:59 AM (1,449, 24.2%) for females.
| Time of Departure | Male | Female |
| 12:00 AM to 4:59 AM | 202 (2.9%) | 103 (1.7%) |
| 5:00 AM to 5:29 AM | 257 (3.7%) | 112 (1.9%) |
| 5:30 AM to 5:59 AM | 219 (3.1%) | 93 (1.5%) |
| 6:00 AM to 6:29 AM | 349 (5.0%) | 180 (3.0%) |
| 6:30 AM to 6:59 AM | 635 (9.1%) | 512 (8.5%) |
| 7:00 AM to 7:29 AM | 924 (13.3%) | 1,216 (20.3%) |
| 7:30 AM to 7:59 AM | 982 (14.1%) | 1,449 (24.2%) |
| 8:00 AM to 8:29 AM | 1,060 (15.2%) | 700 (11.7%) |
| 8:30 AM to 8:59 AM | 423 (6.1%) | 395 (6.6%) |
| 9:00 AM to 9:59 AM | 347 (5.0%) | 383 (6.4%) |
| 10:00 AM to 10:59 AM | 163 (2.3%) | 52 (0.9%) |
| 11:00 AM to 11:59 AM | 132 (1.9%) | 107 (1.8%) |
| 12:00 PM to 3:59 PM | 598 (8.6%) | 276 (4.6%) |
| 4:00 PM to 11:59 PM | 677 (9.7%) | 415 (6.9%) |
| Total | 6,968 (100.0%) | 5,993 (100.0%) |
Housing Occupancy in Kernersville
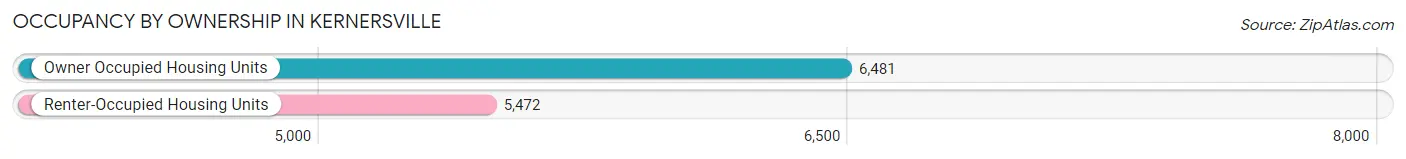
Occupancy by Ownership in Kernersville
Of the total 11,953 dwellings in Kernersville, owner-occupied units account for 6,481 (54.2%), while renter-occupied units make up 5,472 (45.8%).
| Occupancy | # Housing Units | % Housing Units |
| Owner Occupied Housing Units | 6,481 | 54.2% |
| Renter-Occupied Housing Units | 5,472 | 45.8% |
| Total Occupied Housing Units | 11,953 | 100.0% |
Occupancy by Household Size in Kernersville
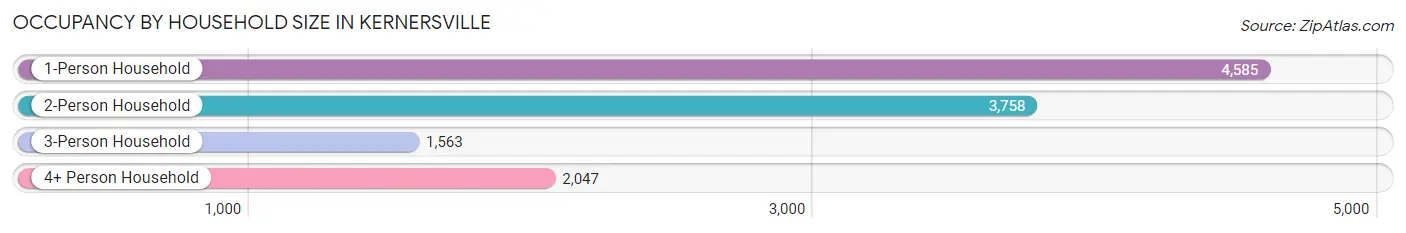
| Household Size | # Housing Units | % Housing Units |
| 1-Person Household | 4,585 | 38.4% |
| 2-Person Household | 3,758 | 31.4% |
| 3-Person Household | 1,563 | 13.1% |
| 4+ Person Household | 2,047 | 17.1% |
| Total Housing Units | 11,953 | 100.0% |
Occupancy by Ownership by Household Size in Kernersville
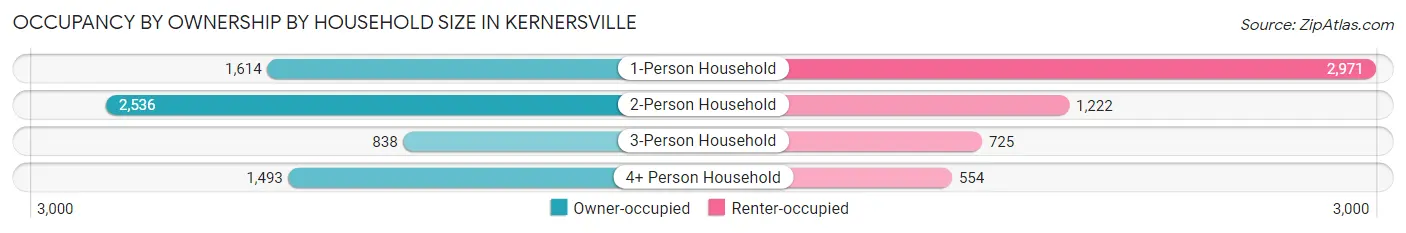
| Household Size | Owner-occupied | Renter-occupied |
| 1-Person Household | 1,614 (35.2%) | 2,971 (64.8%) |
| 2-Person Household | 2,536 (67.5%) | 1,222 (32.5%) |
| 3-Person Household | 838 (53.6%) | 725 (46.4%) |
| 4+ Person Household | 1,493 (72.9%) | 554 (27.1%) |
| Total Housing Units | 6,481 (54.2%) | 5,472 (45.8%) |
Occupancy by Educational Attainment in Kernersville
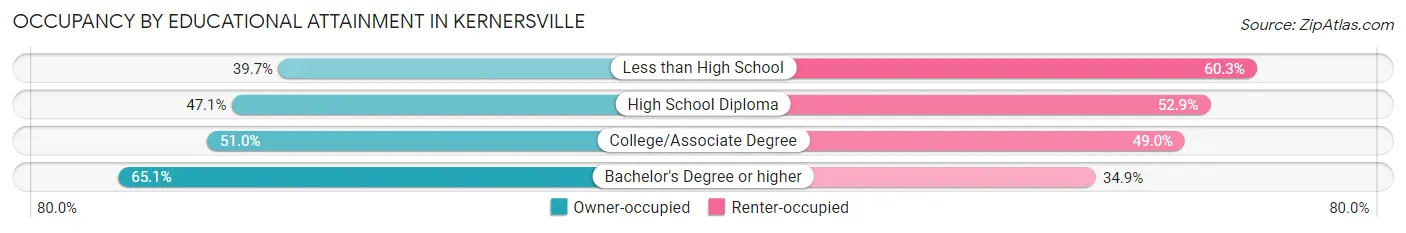
| Household Size | Owner-occupied | Renter-occupied |
| Less than High School | 368 (39.7%) | 560 (60.3%) |
| High School Diploma | 1,210 (47.1%) | 1,361 (52.9%) |
| College/Associate Degree | 2,184 (51.0%) | 2,095 (49.0%) |
| Bachelor's Degree or higher | 2,719 (65.1%) | 1,456 (34.9%) |
Occupancy by Age of Householder in Kernersville
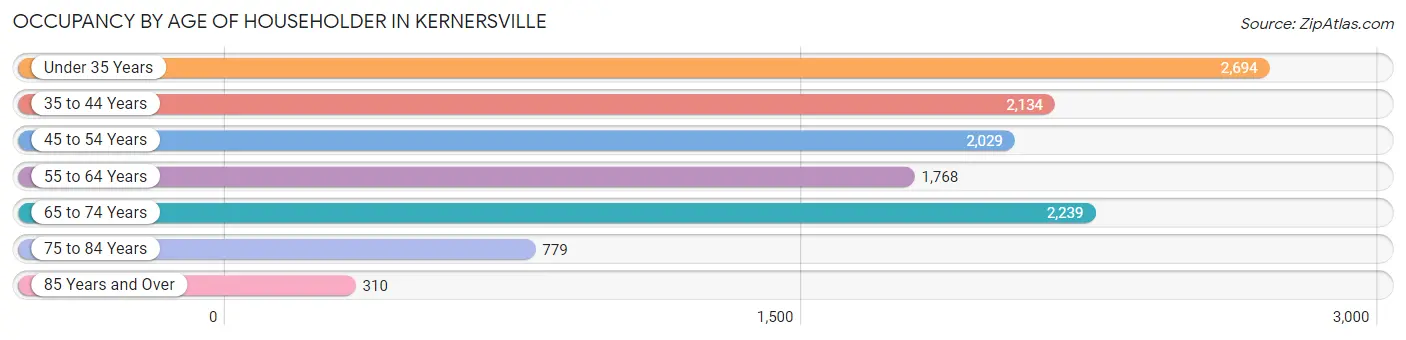
| Age Bracket | # Households | % Households |
| Under 35 Years | 2,694 | 22.5% |
| 35 to 44 Years | 2,134 | 17.8% |
| 45 to 54 Years | 2,029 | 17.0% |
| 55 to 64 Years | 1,768 | 14.8% |
| 65 to 74 Years | 2,239 | 18.7% |
| 75 to 84 Years | 779 | 6.5% |
| 85 Years and Over | 310 | 2.6% |
| Total | 11,953 | 100.0% |
Housing Finances in Kernersville
Median Income by Occupancy in Kernersville
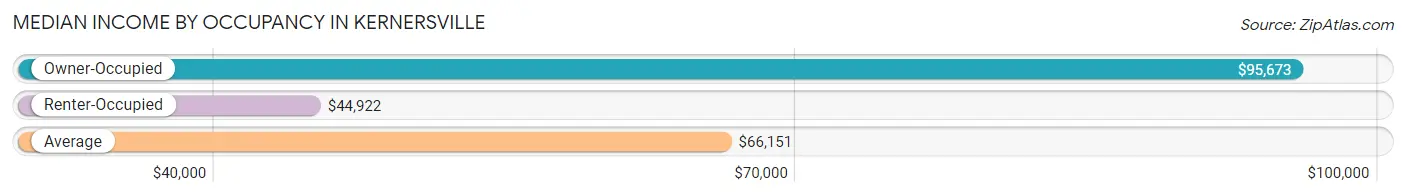
| Occupancy Type | # Households | Median Income |
| Owner-Occupied | 6,481 (54.2%) | $95,673 |
| Renter-Occupied | 5,472 (45.8%) | $44,922 |
| Average | 11,953 (100.0%) | $66,151 |
Occupancy by Householder Income Bracket in Kernersville
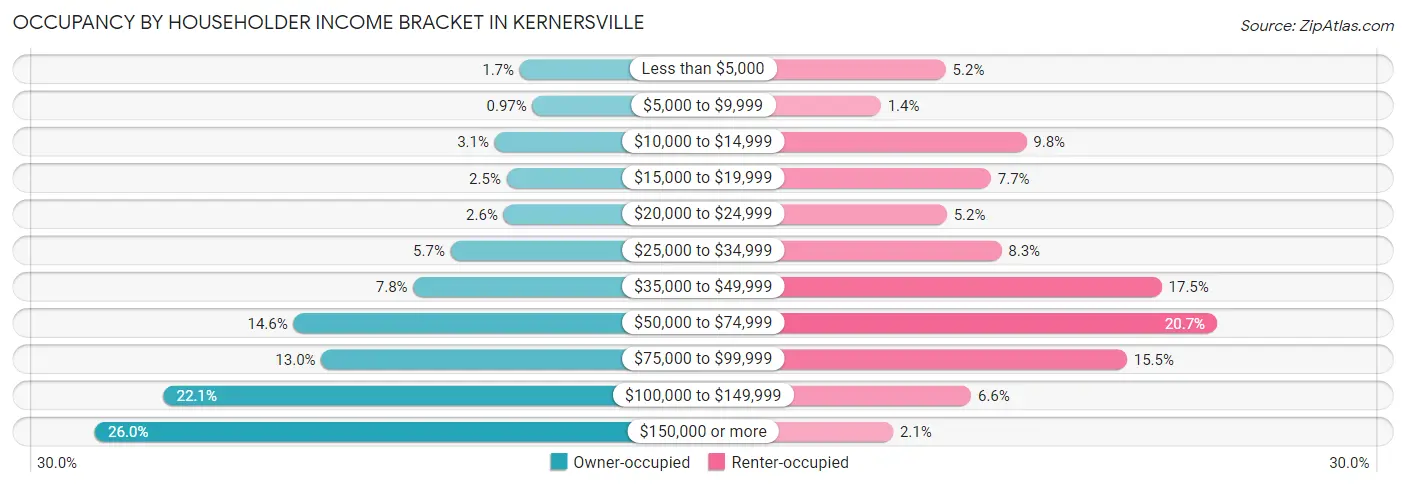
| Income Bracket | Owner-occupied | Renter-occupied |
| Less than $5,000 | 110 (1.7%) | 282 (5.1%) |
| $5,000 to $9,999 | 63 (1.0%) | 79 (1.4%) |
| $10,000 to $14,999 | 203 (3.1%) | 534 (9.8%) |
| $15,000 to $19,999 | 159 (2.5%) | 423 (7.7%) |
| $20,000 to $24,999 | 170 (2.6%) | 285 (5.2%) |
| $25,000 to $34,999 | 366 (5.7%) | 456 (8.3%) |
| $35,000 to $49,999 | 504 (7.8%) | 957 (17.5%) |
| $50,000 to $74,999 | 948 (14.6%) | 1,130 (20.6%) |
| $75,000 to $99,999 | 845 (13.0%) | 848 (15.5%) |
| $100,000 to $149,999 | 1,430 (22.1%) | 361 (6.6%) |
| $150,000 or more | 1,683 (26.0%) | 117 (2.1%) |
| Total | 6,481 (100.0%) | 5,472 (100.0%) |
Monthly Housing Cost Tiers in Kernersville
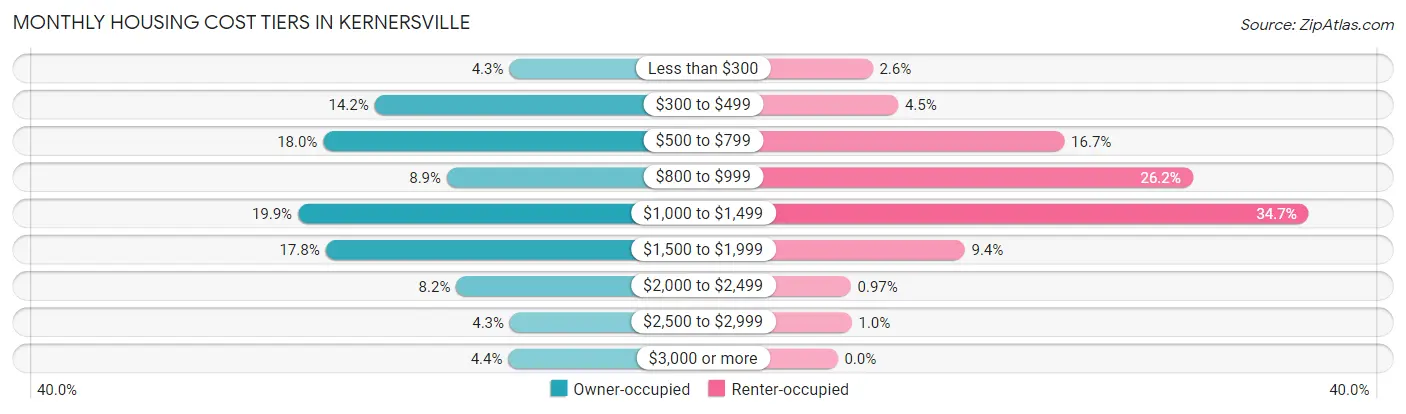
| Monthly Cost | Owner-occupied | Renter-occupied |
| Less than $300 | 279 (4.3%) | 141 (2.6%) |
| $300 to $499 | 922 (14.2%) | 244 (4.5%) |
| $500 to $799 | 1,167 (18.0%) | 914 (16.7%) |
| $800 to $999 | 577 (8.9%) | 1,431 (26.2%) |
| $1,000 to $1,499 | 1,288 (19.9%) | 1,898 (34.7%) |
| $1,500 to $1,999 | 1,156 (17.8%) | 512 (9.4%) |
| $2,000 to $2,499 | 532 (8.2%) | 53 (1.0%) |
| $2,500 to $2,999 | 276 (4.3%) | 57 (1.0%) |
| $3,000 or more | 284 (4.4%) | 0 (0.0%) |
| Total | 6,481 (100.0%) | 5,472 (100.0%) |
Physical Housing Characteristics in Kernersville
Housing Structures in Kernersville
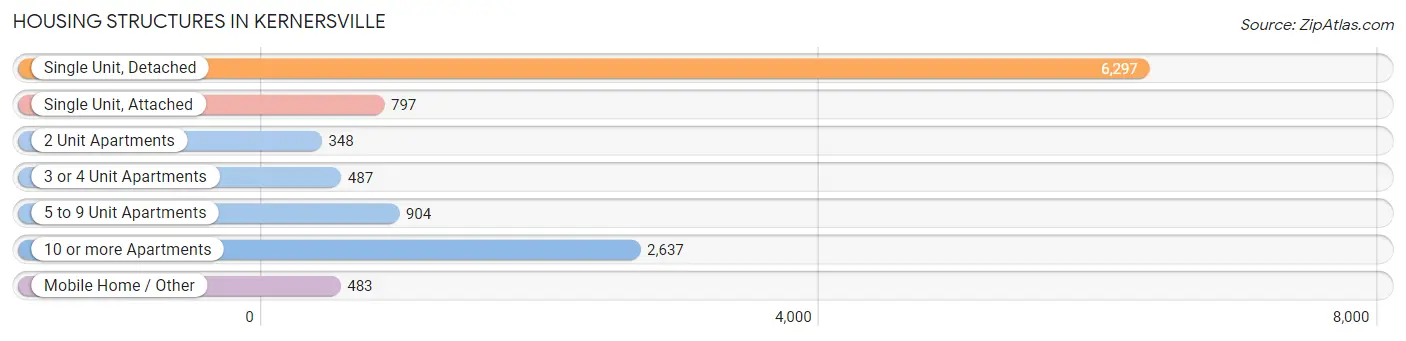
| Structure Type | # Housing Units | % Housing Units |
| Single Unit, Detached | 6,297 | 52.7% |
| Single Unit, Attached | 797 | 6.7% |
| 2 Unit Apartments | 348 | 2.9% |
| 3 or 4 Unit Apartments | 487 | 4.1% |
| 5 to 9 Unit Apartments | 904 | 7.6% |
| 10 or more Apartments | 2,637 | 22.1% |
| Mobile Home / Other | 483 | 4.0% |
| Total | 11,953 | 100.0% |
Housing Structures by Occupancy in Kernersville
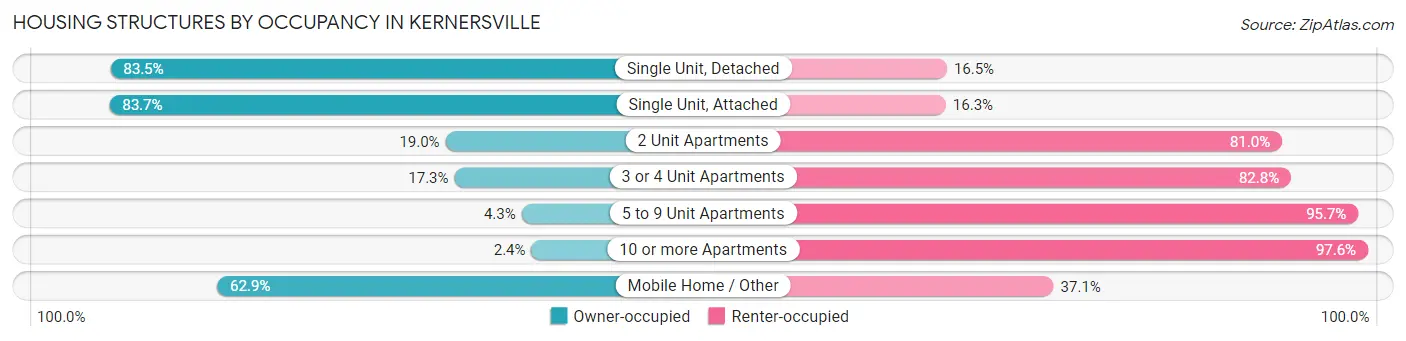
| Structure Type | Owner-occupied | Renter-occupied |
| Single Unit, Detached | 5,257 (83.5%) | 1,040 (16.5%) |
| Single Unit, Attached | 667 (83.7%) | 130 (16.3%) |
| 2 Unit Apartments | 66 (19.0%) | 282 (81.0%) |
| 3 or 4 Unit Apartments | 84 (17.2%) | 403 (82.8%) |
| 5 to 9 Unit Apartments | 39 (4.3%) | 865 (95.7%) |
| 10 or more Apartments | 64 (2.4%) | 2,573 (97.6%) |
| Mobile Home / Other | 304 (62.9%) | 179 (37.1%) |
| Total | 6,481 (54.2%) | 5,472 (45.8%) |
Housing Structures by Number of Rooms in Kernersville
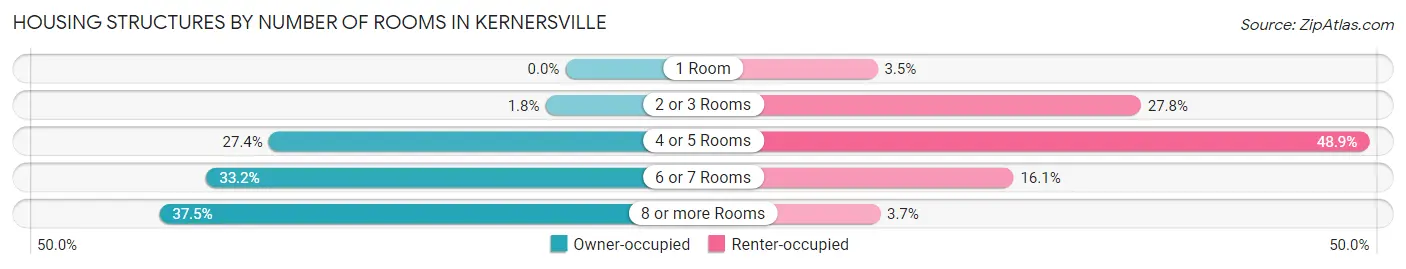
| Number of Rooms | Owner-occupied | Renter-occupied |
| 1 Room | 0 (0.0%) | 190 (3.5%) |
| 2 or 3 Rooms | 119 (1.8%) | 1,523 (27.8%) |
| 4 or 5 Rooms | 1,778 (27.4%) | 2,678 (48.9%) |
| 6 or 7 Rooms | 2,151 (33.2%) | 878 (16.1%) |
| 8 or more Rooms | 2,433 (37.5%) | 203 (3.7%) |
| Total | 6,481 (100.0%) | 5,472 (100.0%) |
Housing Structure by Heating Type in Kernersville
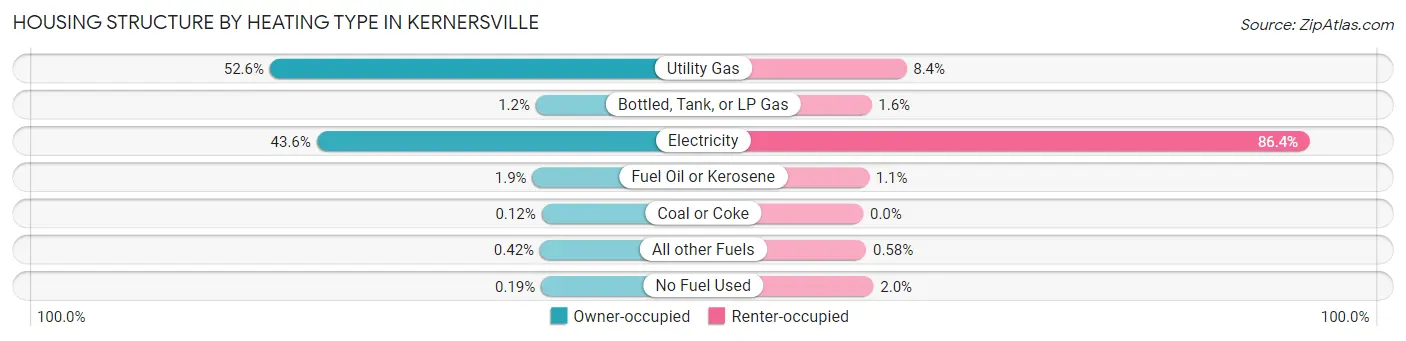
| Heating Type | Owner-occupied | Renter-occupied |
| Utility Gas | 3,410 (52.6%) | 457 (8.4%) |
| Bottled, Tank, or LP Gas | 79 (1.2%) | 88 (1.6%) |
| Electricity | 2,824 (43.6%) | 4,725 (86.4%) |
| Fuel Oil or Kerosene | 121 (1.9%) | 61 (1.1%) |
| Coal or Coke | 8 (0.1%) | 0 (0.0%) |
| All other Fuels | 27 (0.4%) | 32 (0.6%) |
| No Fuel Used | 12 (0.2%) | 109 (2.0%) |
| Total | 6,481 (100.0%) | 5,472 (100.0%) |
Household Vehicle Usage in Kernersville
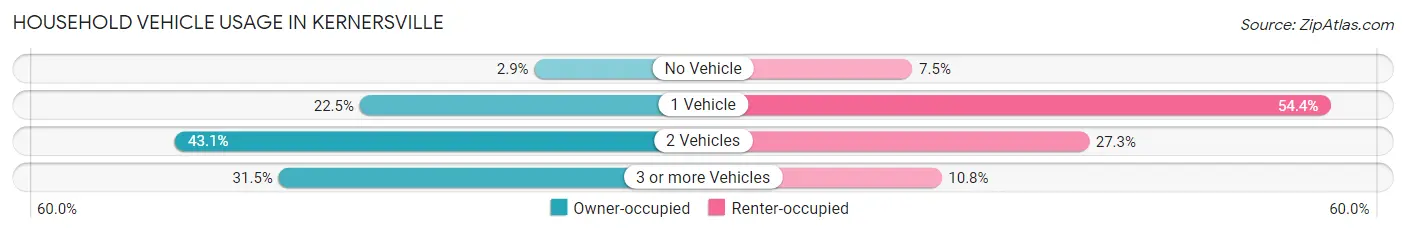
| Vehicles per Household | Owner-occupied | Renter-occupied |
| No Vehicle | 187 (2.9%) | 412 (7.5%) |
| 1 Vehicle | 1,455 (22.5%) | 2,974 (54.3%) |
| 2 Vehicles | 2,795 (43.1%) | 1,495 (27.3%) |
| 3 or more Vehicles | 2,044 (31.5%) | 591 (10.8%) |
| Total | 6,481 (100.0%) | 5,472 (100.0%) |
Real Estate & Mortgages in Kernersville
Real Estate and Mortgage Overview in Kernersville
| Characteristic | Without Mortgage | With Mortgage |
| Housing Units | 2,355 | 4,126 |
| Median Property Value | $212,100 | $255,300 |
| Median Household Income | $58,877 | $1,243 |
| Monthly Housing Costs | $498 | $284 |
| Real Estate Taxes | $2,358 | $23 |
Property Value by Mortgage Status in Kernersville
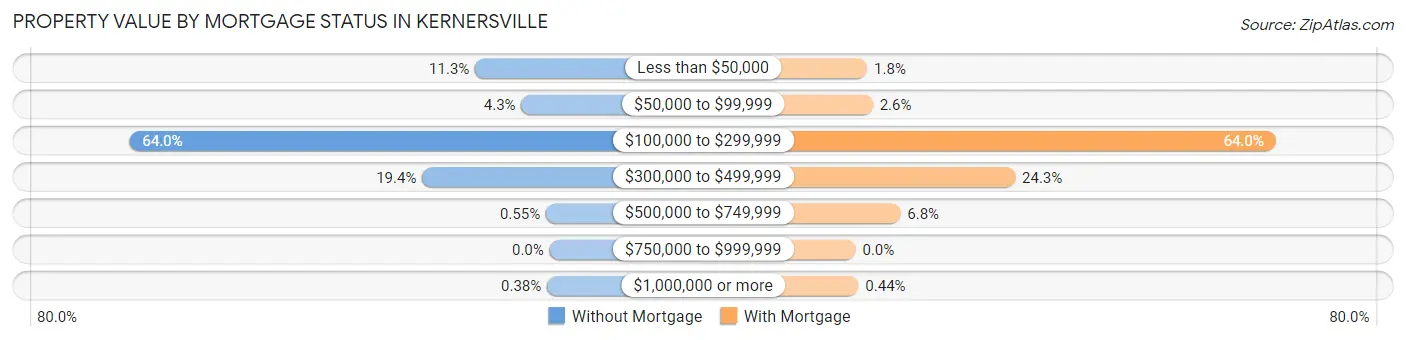
| Property Value | Without Mortgage | With Mortgage |
| Less than $50,000 | 267 (11.3%) | 73 (1.8%) |
| $50,000 to $99,999 | 101 (4.3%) | 108 (2.6%) |
| $100,000 to $299,999 | 1,508 (64.0%) | 2,642 (64.0%) |
| $300,000 to $499,999 | 457 (19.4%) | 1,003 (24.3%) |
| $500,000 to $749,999 | 13 (0.5%) | 282 (6.8%) |
| $750,000 to $999,999 | 0 (0.0%) | 0 (0.0%) |
| $1,000,000 or more | 9 (0.4%) | 18 (0.4%) |
| Total | 2,355 (100.0%) | 4,126 (100.0%) |
Household Income by Mortgage Status in Kernersville
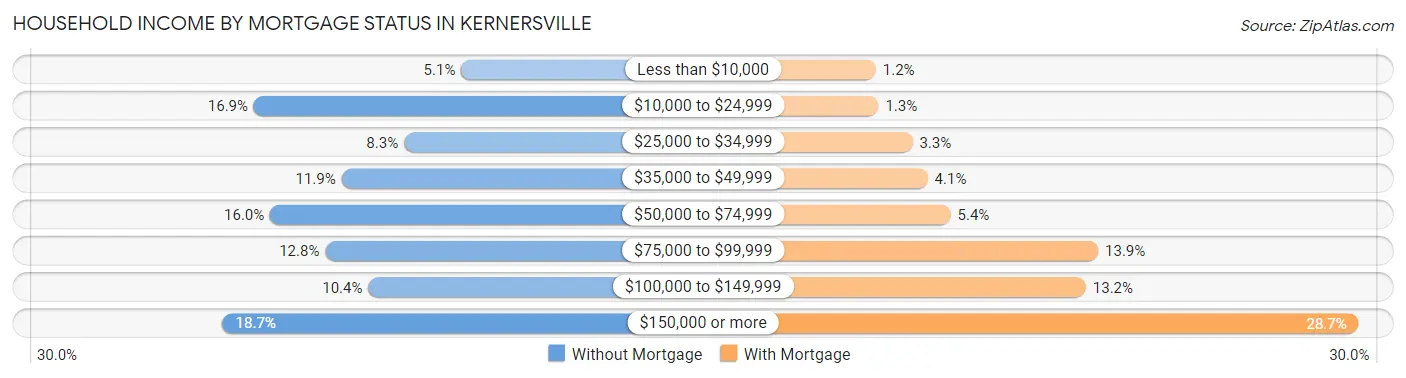
| Household Income | Without Mortgage | With Mortgage |
| Less than $10,000 | 119 (5.1%) | 48 (1.2%) |
| $10,000 to $24,999 | 398 (16.9%) | 54 (1.3%) |
| $25,000 to $34,999 | 196 (8.3%) | 134 (3.3%) |
| $35,000 to $49,999 | 280 (11.9%) | 170 (4.1%) |
| $50,000 to $74,999 | 376 (16.0%) | 224 (5.4%) |
| $75,000 to $99,999 | 302 (12.8%) | 572 (13.9%) |
| $100,000 to $149,999 | 244 (10.4%) | 543 (13.2%) |
| $150,000 or more | 440 (18.7%) | 1,186 (28.7%) |
| Total | 2,355 (100.0%) | 4,126 (100.0%) |
Property Value to Household Income Ratio in Kernersville
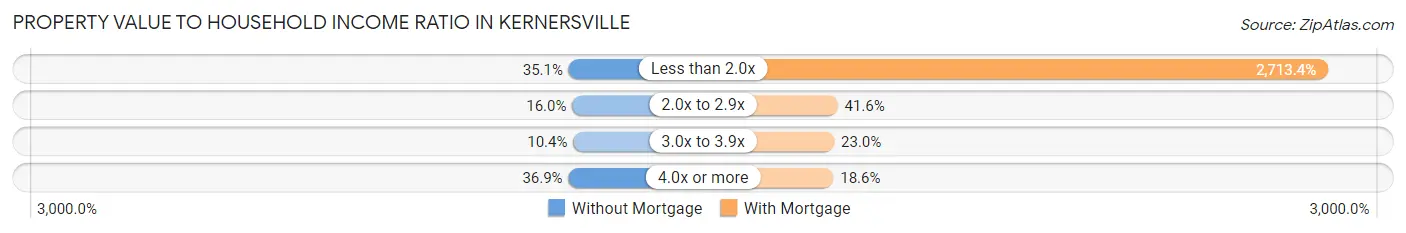
| Value-to-Income Ratio | Without Mortgage | With Mortgage |
| Less than 2.0x | 827 (35.1%) | 111,953 (2,713.4%) |
| 2.0x to 2.9x | 377 (16.0%) | 1,718 (41.6%) |
| 3.0x to 3.9x | 244 (10.4%) | 948 (23.0%) |
| 4.0x or more | 868 (36.9%) | 768 (18.6%) |
| Total | 2,355 (100.0%) | 4,126 (100.0%) |
Real Estate Taxes by Mortgage Status in Kernersville
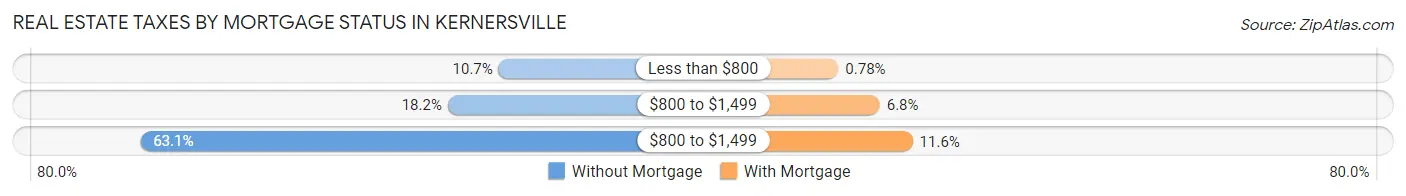
| Property Taxes | Without Mortgage | With Mortgage |
| Less than $800 | 253 (10.7%) | 32 (0.8%) |
| $800 to $1,499 | 428 (18.2%) | 282 (6.8%) |
| $800 to $1,499 | 1,486 (63.1%) | 480 (11.6%) |
| Total | 2,355 (100.0%) | 4,126 (100.0%) |
Health & Disability in Kernersville
Health Insurance Coverage by Age in Kernersville
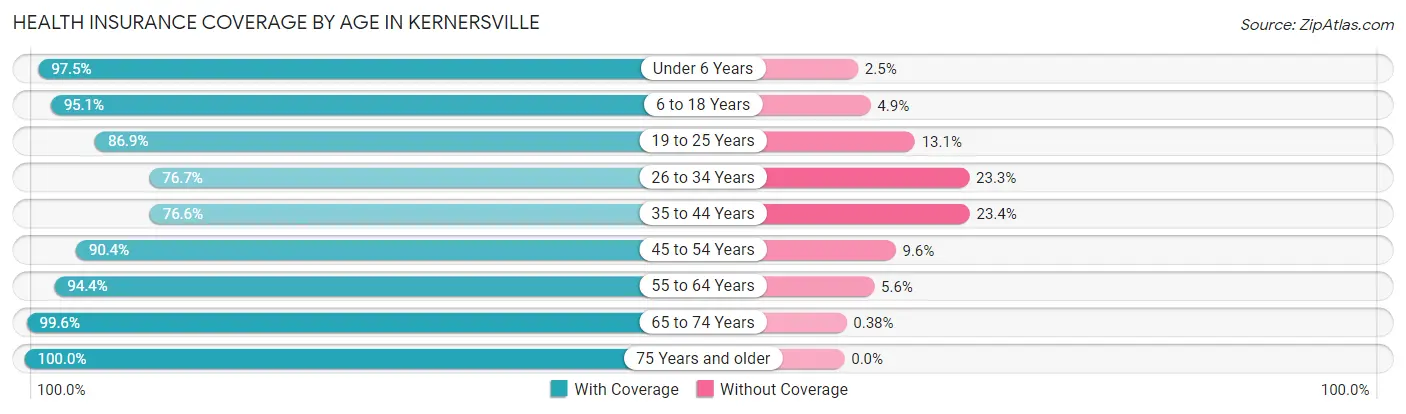
| Age Bracket | With Coverage | Without Coverage |
| Under 6 Years | 1,649 (97.5%) | 43 (2.5%) |
| 6 to 18 Years | 4,066 (95.1%) | 208 (4.9%) |
| 19 to 25 Years | 2,579 (86.9%) | 390 (13.1%) |
| 26 to 34 Years | 2,495 (76.7%) | 757 (23.3%) |
| 35 to 44 Years | 2,651 (76.6%) | 808 (23.4%) |
| 45 to 54 Years | 3,093 (90.4%) | 327 (9.6%) |
| 55 to 64 Years | 3,057 (94.4%) | 180 (5.6%) |
| 65 to 74 Years | 3,127 (99.6%) | 12 (0.4%) |
| 75 Years and older | 1,565 (100.0%) | 0 (0.0%) |
| Total | 24,282 (89.9%) | 2,725 (10.1%) |
Health Insurance Coverage by Citizenship Status in Kernersville
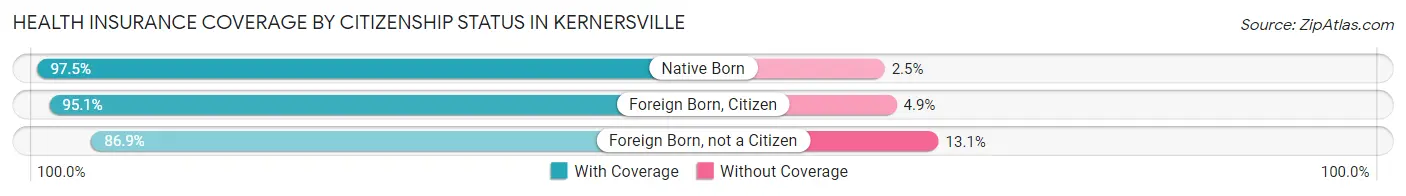
| Citizenship Status | With Coverage | Without Coverage |
| Native Born | 1,649 (97.5%) | 43 (2.5%) |
| Foreign Born, Citizen | 4,066 (95.1%) | 208 (4.9%) |
| Foreign Born, not a Citizen | 2,579 (86.9%) | 390 (13.1%) |
Health Insurance Coverage by Household Income in Kernersville
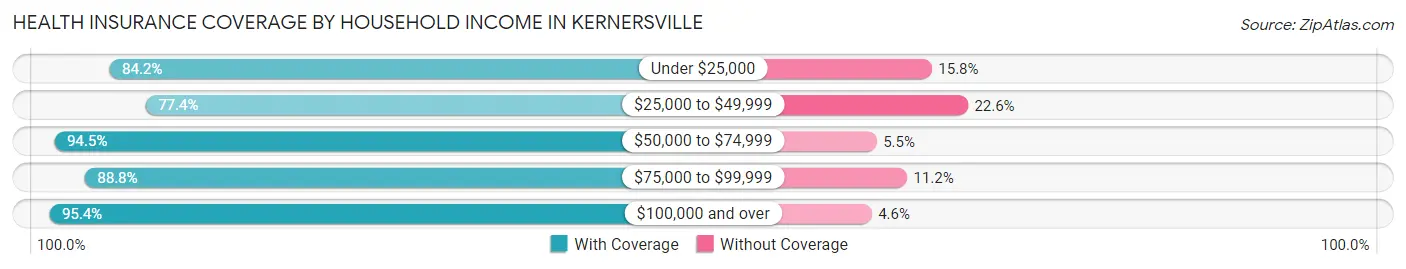
| Household Income | With Coverage | Without Coverage |
| Under $25,000 | 3,097 (84.2%) | 583 (15.8%) |
| $25,000 to $49,999 | 3,304 (77.4%) | 965 (22.6%) |
| $50,000 to $74,999 | 4,186 (94.5%) | 244 (5.5%) |
| $75,000 to $99,999 | 3,329 (88.8%) | 420 (11.2%) |
| $100,000 and over | 10,342 (95.4%) | 495 (4.6%) |
Public vs Private Health Insurance Coverage by Age in Kernersville
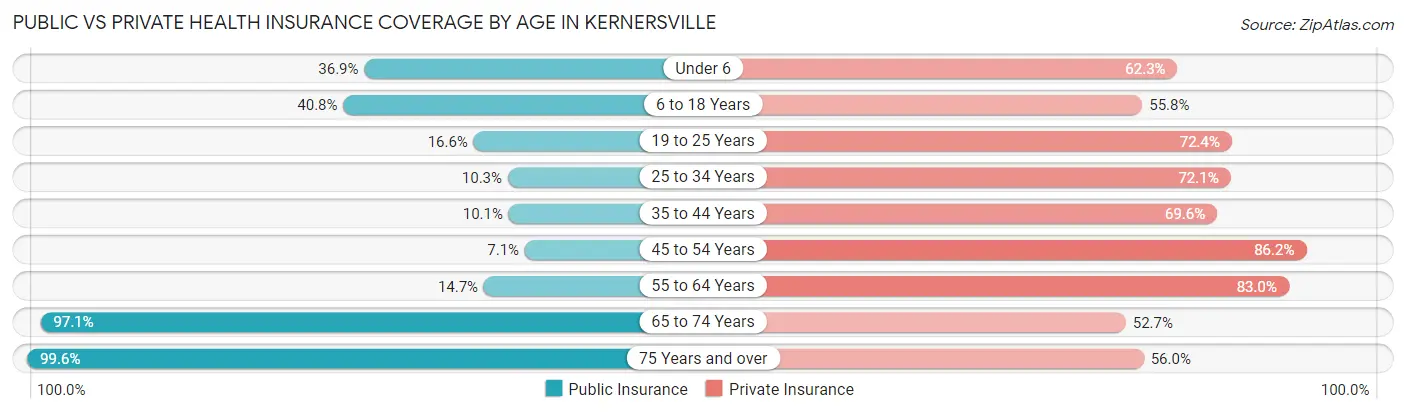
| Age Bracket | Public Insurance | Private Insurance |
| Under 6 | 625 (36.9%) | 1,054 (62.3%) |
| 6 to 18 Years | 1,745 (40.8%) | 2,384 (55.8%) |
| 19 to 25 Years | 494 (16.6%) | 2,149 (72.4%) |
| 25 to 34 Years | 335 (10.3%) | 2,346 (72.1%) |
| 35 to 44 Years | 350 (10.1%) | 2,409 (69.6%) |
| 45 to 54 Years | 244 (7.1%) | 2,948 (86.2%) |
| 55 to 64 Years | 477 (14.7%) | 2,685 (83.0%) |
| 65 to 74 Years | 3,047 (97.1%) | 1,655 (52.7%) |
| 75 Years and over | 1,558 (99.6%) | 877 (56.0%) |
| Total | 8,875 (32.9%) | 18,507 (68.5%) |
Disability Status by Sex by Age in Kernersville
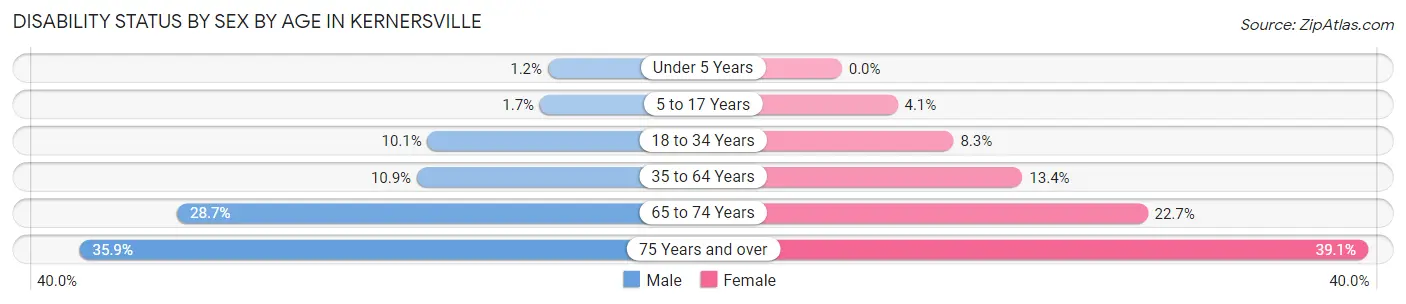
| Age Bracket | Male | Female |
| Under 5 Years | 7 (1.1%) | 0 (0.0%) |
| 5 to 17 Years | 31 (1.7%) | 101 (4.1%) |
| 18 to 34 Years | 347 (10.1%) | 253 (8.3%) |
| 35 to 64 Years | 553 (10.9%) | 674 (13.4%) |
| 65 to 74 Years | 348 (28.7%) | 437 (22.7%) |
| 75 Years and over | 208 (35.9%) | 385 (39.1%) |
Disability Class by Sex by Age in Kernersville
Disability Class: Hearing Difficulty
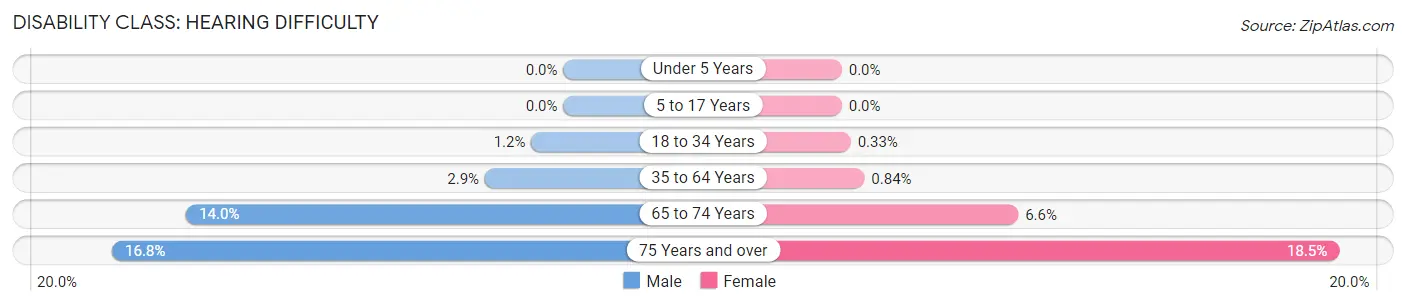
| Age Bracket | Male | Female |
| Under 5 Years | 0 (0.0%) | 0 (0.0%) |
| 5 to 17 Years | 0 (0.0%) | 0 (0.0%) |
| 18 to 34 Years | 41 (1.2%) | 10 (0.3%) |
| 35 to 64 Years | 148 (2.9%) | 42 (0.8%) |
| 65 to 74 Years | 170 (14.0%) | 126 (6.6%) |
| 75 Years and over | 97 (16.8%) | 182 (18.5%) |
Disability Class: Vision Difficulty
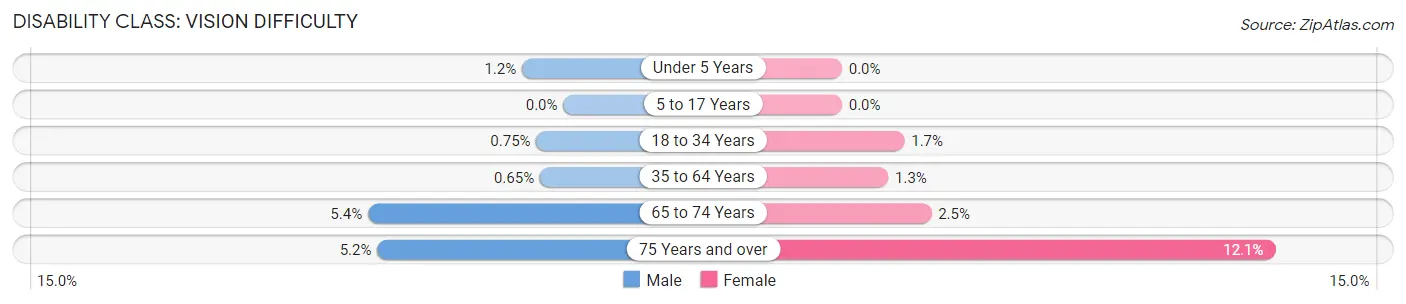
| Age Bracket | Male | Female |
| Under 5 Years | 7 (1.1%) | 0 (0.0%) |
| 5 to 17 Years | 0 (0.0%) | 0 (0.0%) |
| 18 to 34 Years | 26 (0.7%) | 53 (1.7%) |
| 35 to 64 Years | 33 (0.6%) | 65 (1.3%) |
| 65 to 74 Years | 66 (5.4%) | 48 (2.5%) |
| 75 Years and over | 30 (5.2%) | 119 (12.1%) |
Disability Class: Cognitive Difficulty
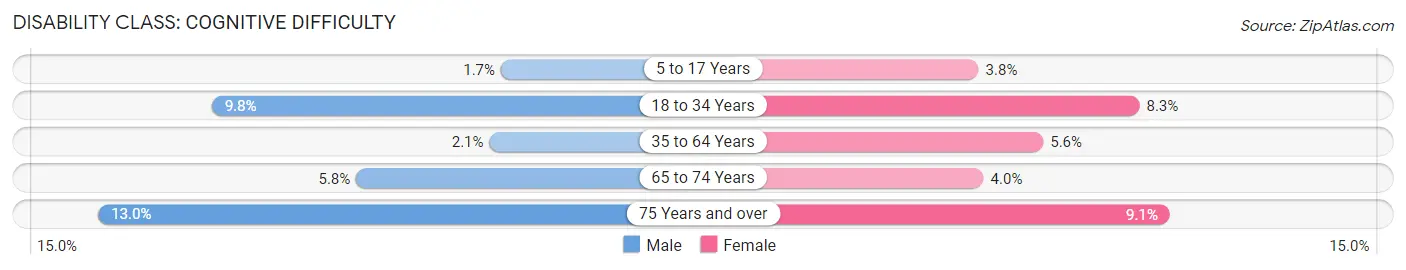
| Age Bracket | Male | Female |
| 5 to 17 Years | 31 (1.7%) | 93 (3.8%) |
| 18 to 34 Years | 337 (9.8%) | 253 (8.3%) |
| 35 to 64 Years | 105 (2.1%) | 282 (5.6%) |
| 65 to 74 Years | 70 (5.8%) | 76 (4.0%) |
| 75 Years and over | 75 (13.0%) | 90 (9.1%) |
Disability Class: Ambulatory Difficulty
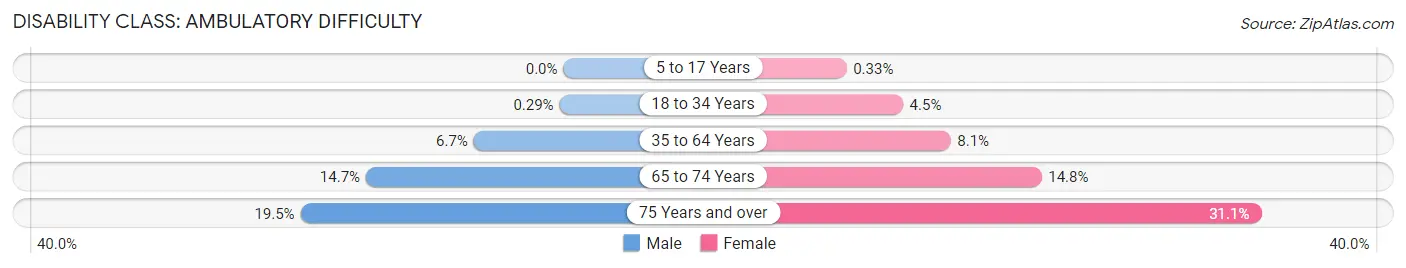
| Age Bracket | Male | Female |
| 5 to 17 Years | 0 (0.0%) | 8 (0.3%) |
| 18 to 34 Years | 10 (0.3%) | 138 (4.5%) |
| 35 to 64 Years | 339 (6.7%) | 405 (8.1%) |
| 65 to 74 Years | 178 (14.7%) | 285 (14.8%) |
| 75 Years and over | 113 (19.5%) | 307 (31.1%) |
Disability Class: Self-Care Difficulty
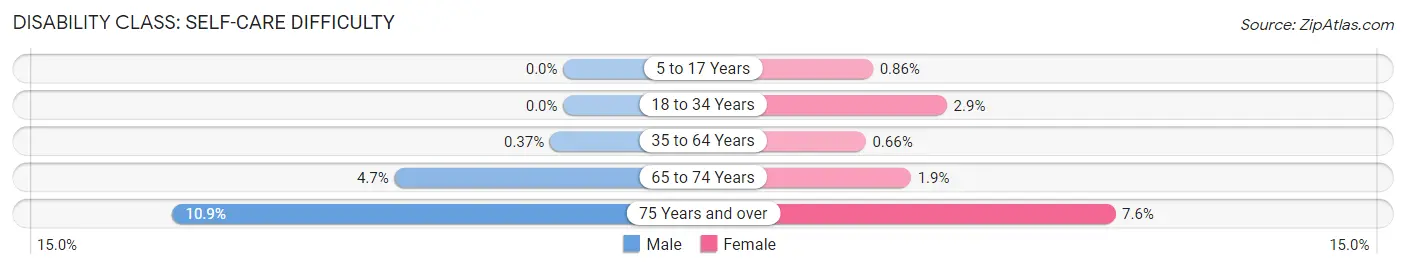
| Age Bracket | Male | Female |
| 5 to 17 Years | 0 (0.0%) | 21 (0.9%) |
| 18 to 34 Years | 0 (0.0%) | 89 (2.9%) |
| 35 to 64 Years | 19 (0.4%) | 33 (0.7%) |
| 65 to 74 Years | 57 (4.7%) | 37 (1.9%) |
| 75 Years and over | 63 (10.9%) | 75 (7.6%) |
Technology Access in Kernersville
Computing Device Access in Kernersville
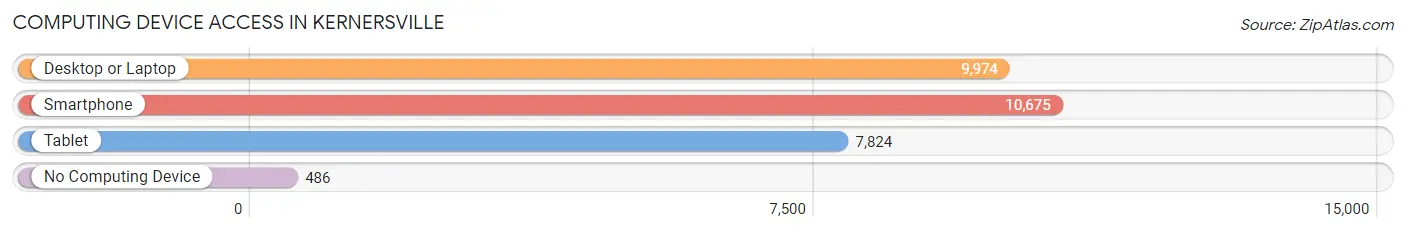
| Device Type | # Households | % Households |
| Desktop or Laptop | 9,974 | 83.4% |
| Smartphone | 10,675 | 89.3% |
| Tablet | 7,824 | 65.5% |
| No Computing Device | 486 | 4.1% |
| Total | 11,953 | 100.0% |
Internet Access in Kernersville
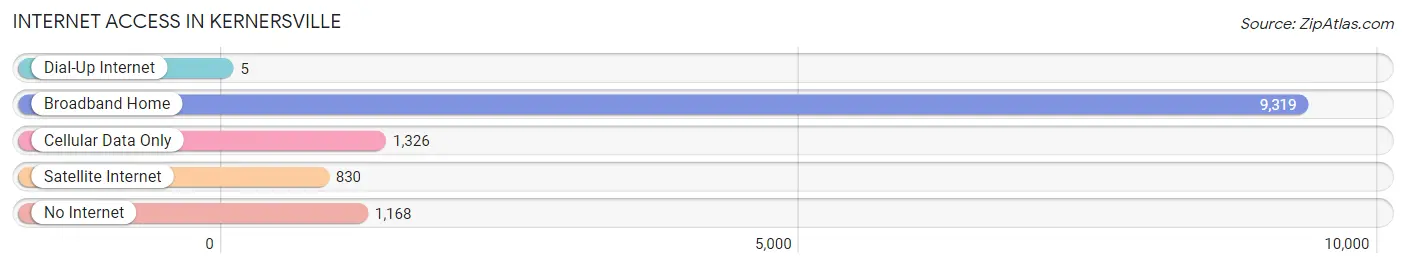
| Internet Type | # Households | % Households |
| Dial-Up Internet | 5 | 0.0% |
| Broadband Home | 9,319 | 78.0% |
| Cellular Data Only | 1,326 | 11.1% |
| Satellite Internet | 830 | 6.9% |
| No Internet | 1,168 | 9.8% |
| Total | 11,953 | 100.0% |
Kernersville Summary
Kernersville is a town located in Forsyth County, North Carolina, United States. The population was 17,126 at the 2010 census. Kernersville is located at the center of the Piedmont Triad metropolitan area, between Greensboro to the east, High Point to the south, and Winston-Salem to the west.
History
Kernersville was founded in 1793 by Peter Kerners, a German immigrant who had purchased the land from the local Native Americans. The town was originally known as "Dunkersville" after the German Baptist Brethren, also known as Dunkers, who had settled in the area. The name was changed to Kernersville in 1817.
Kernersville was an important stop on the North Carolina Railroad, which ran from Goldsboro to Charlotte. The railroad was completed in 1856 and brought increased economic activity to the area. The town was incorporated in 1873 and was the largest town in Forsyth County until the early 20th century.
Geography
Kernersville is located in the Piedmont region of North Carolina, approximately 20 miles northeast of Winston-Salem and 40 miles west of Greensboro. The town is situated in the Yadkin-Pee Dee River Basin, with the town of Winston-Salem to the west and the town of High Point to the south.
Kernersville is located at the intersection of Interstate 40 and US Highway 421. The town is also served by the North Carolina Railroad, which runs from Goldsboro to Charlotte.
The town has a total area of 8.3 square miles, of which 8.2 square miles is land and 0.1 square miles is water.
Economy
Kernersville is home to a variety of businesses, including manufacturing, retail, and service industries. The town is also home to several large employers, including Hanesbrands, Inc., a clothing manufacturer; Novant Health, a healthcare provider; and Volvo Trucks North America, a truck manufacturer.
Kernersville is also home to several educational institutions, including Forsyth Technical Community College, Piedmont International University, and the University of North Carolina School of the Arts.
Demographics
As of the 2010 census, the population of Kernersville was 17,126. The racial makeup of the town was 79.2% White, 13.3% African American, 0.4% Native American, 2.2% Asian, 0.1% Pacific Islander, 2.7% from other races, and 2.1% from two or more races. Hispanic or Latino of any race were 6.2% of the population.
The median income for a household in Kernersville was $45,945, and the median income for a family was $54,945. The per capita income for the town was $22,945. About 8.2% of families and 10.7% of the population were below the poverty line, including 14.2% of those under age 18 and 8.2% of those age 65 or over.
Common Questions
What is Per Capita Income in Kernersville?
Per Capita income in Kernersville is $38,019.
What is the Median Family Income in Kernersville?
Median Family Income in Kernersville is $93,786.
What is the Median Household income in Kernersville?
Median Household Income in Kernersville is $66,151.
What is Income or Wage Gap in Kernersville?
Income or Wage Gap in Kernersville is 0.8%.
Women in Kernersville earn 99.2 cents for every dollar earned by a man.
What is Family Income Deficit in Kernersville?
Family Income Deficit in Kernersville is $7,748.
Families that are below poverty line in Kernersville earn $7,748 less on average than the poverty threshold level.
What is Inequality or Gini Index in Kernersville?
Inequality or Gini Index in Kernersville is 0.45.
What is the Total Population of Kernersville?
Total Population of Kernersville is 27,177.
What is the Total Male Population of Kernersville?
Total Male Population of Kernersville is 12,795.
What is the Total Female Population of Kernersville?
Total Female Population of Kernersville is 14,382.
What is the Ratio of Males per 100 Females in Kernersville?
There are 88.97 Males per 100 Females in Kernersville.
What is the Ratio of Females per 100 Males in Kernersville?
There are 112.40 Females per 100 Males in Kernersville.
What is the Median Population Age in Kernersville?
Median Population Age in Kernersville is 39.0 Years.
What is the Average Family Size in Kernersville
Average Family Size in Kernersville is 3.0 People.
What is the Average Household Size in Kernersville
Average Household Size in Kernersville is 2.3 People.
How Large is the Labor Force in Kernersville?
There are 14,733 People in the Labor Forcein in Kernersville.
What is the Percentage of People in the Labor Force in Kernersville?
66.0% of People are in the Labor Force in Kernersville.
What is the Unemployment Rate in Kernersville?
Unemployment Rate in Kernersville is 3.0%.